Review
. 2014 Jun;4(3):245-62.
doi: 10.3978/j.issn.2223-3652.2014.06.05.

Multi-modal CT scanning in the evaluation of cerebrovascular disease patients

Affiliations
Review

Multi-modal CT scanning in the evaluation of cerebrovascular disease patients

Luca Saba et al. Cardiovasc Diagn Ther. 2014 Jun.

Abstract

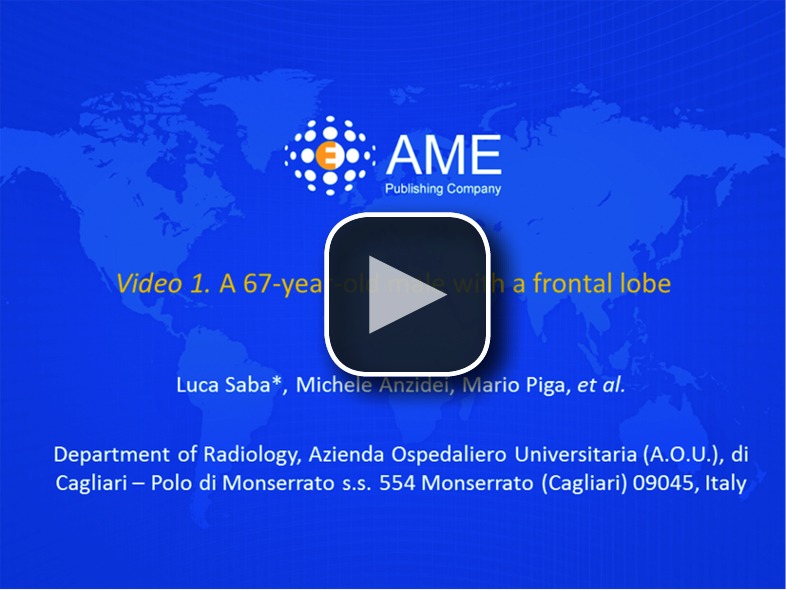
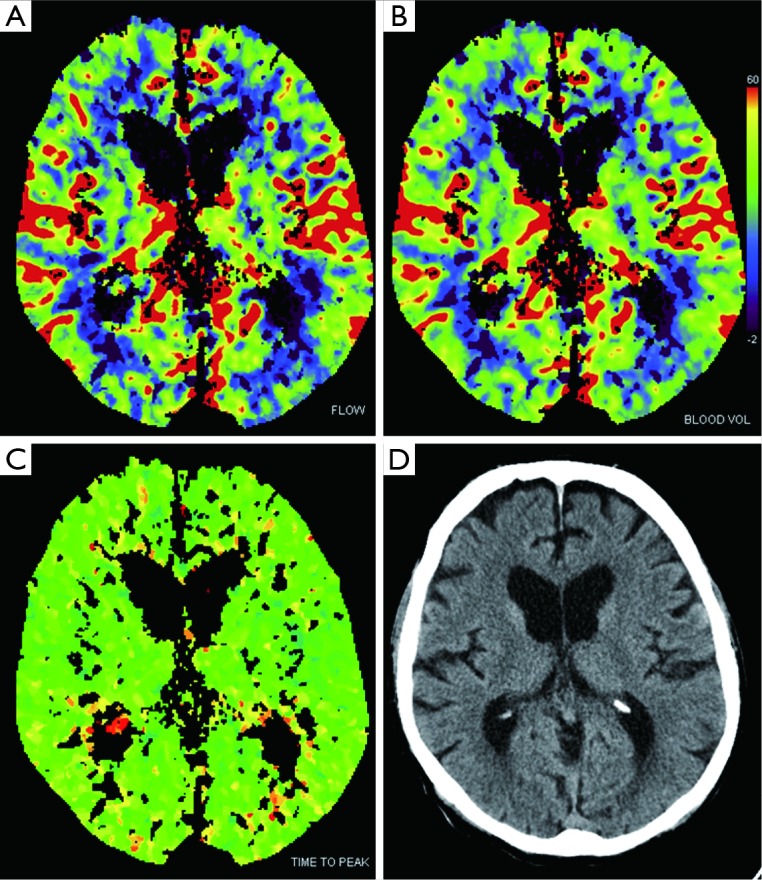
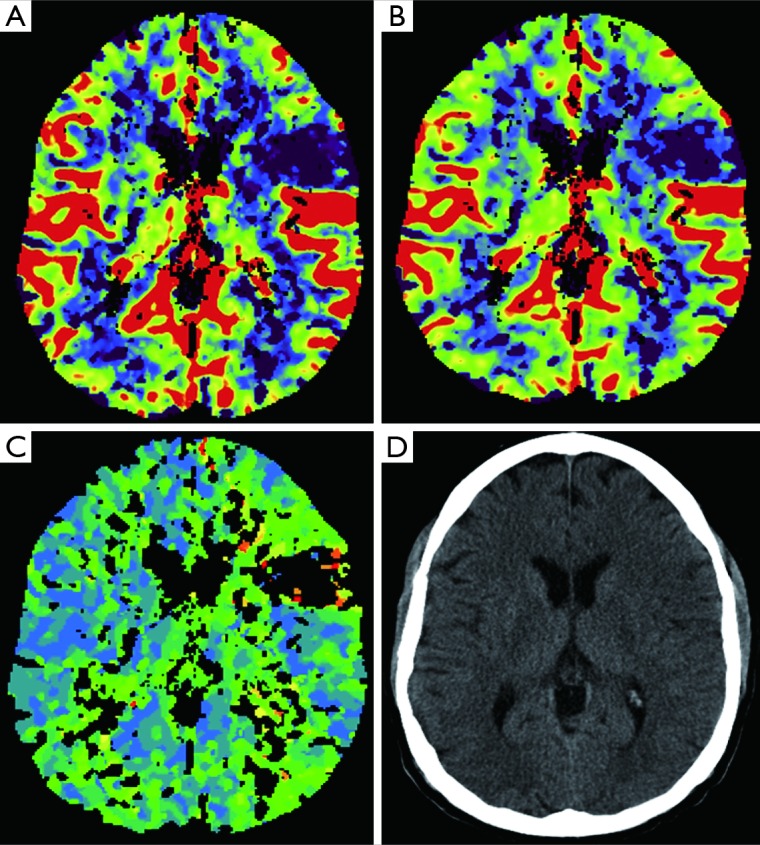
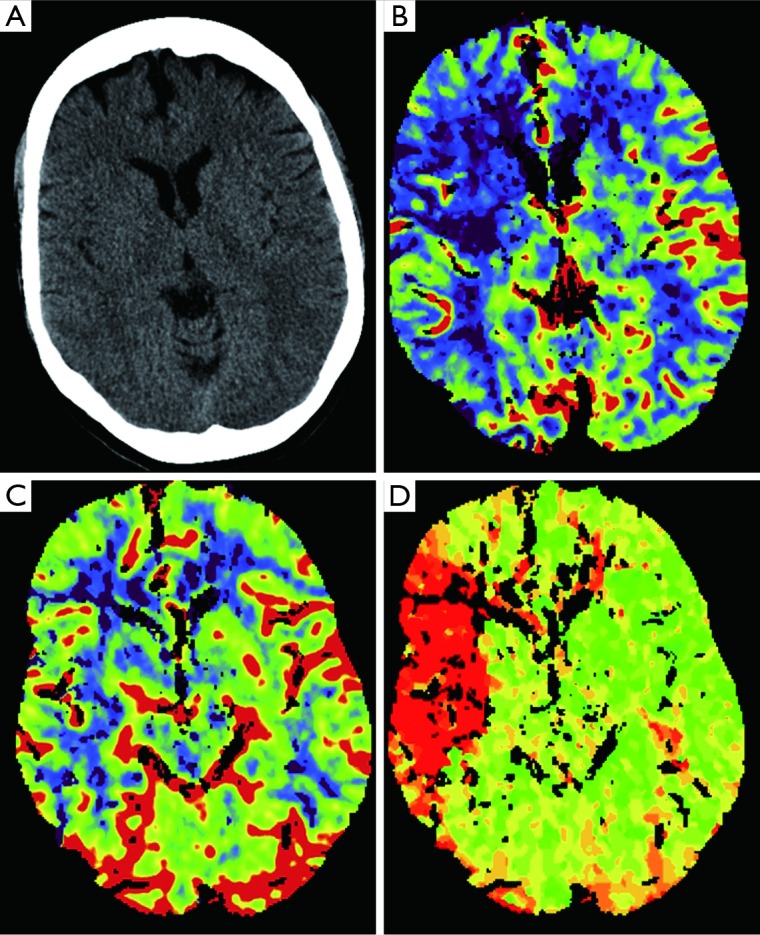
Ischemic stroke currently represents one of the leading causes of severe disability and mortality in the Western World. Until now, angiography was the most used imaging technique for the detection of the extra-cranial and intracranial vessel pathology. Currently, however, non-invasive imaging tool like ultrasound (US), magnetic resonance (MR) and computed tomography (CT) have proven capable of offering a detailed analysis of the vascular system. CT in particular represents an advanced system to explore the pathology of carotid arteries and intracranial vessels and also offers tools like CT perfusion (CTP) that provides valuable information of the brain's vascular physiology by increasing the stroke diagnostic. In this review, our purpose is to discuss stroke risk prediction and detection using CT.

Keywords: CT perfusion (CTP); CT-angiography (CTA); Computed tomography (CT); carotid artery; stroke; vulnerable plaque.


Figures

Figure 1
Figure 1
Imaging flow-chart. US, ultrasound; CTA, CT-angiography.
Figure 2
Figure 2
VR, MIP and multiplanar reconstruction show an ulcerated plaque of the carotid bifurcation (A-C) (red arrow). Axial images (D,E) show degree of stenosis, ulceration and composition of the plaque (low density). Common carotid artery is indicated by white arrows whereas internal carotid artery by white arrowheads. VP, volume rendered; MIP, maximum intensity projection.
Figure 3
Figure 3
VR and MPR (A,B) show a non-significant stenosis caused by a smooth plaque with irregular and ulcerated surface (C-E). CTA incidentally detects the presence of two intracranial aneurysms (yellow arrow). Common carotid artery is indicated by white arrows whereas internal carotid artery by white open arrows. VR, volume rendered; MPR, maximum intensity projection; CTA, CT-angiography.
Figure 4
Figure 4
VR (A) and axial CTA images (B,C) of a 67-year-old patient with a severe stenosis in the left ICA. According to the NASCET the degree of stenosis is calculated with the ratio between the lumen diameter at the stenosis site (C) and lumen diameter of the distal, healthy internal carotid artery (B). VR, volume rendered; CTA, CT-angiography; NASCET, North American Symptomatic Carotid Endarterectomy Trial.
Figure 5
Figure 5
VR (A) and axial CTA images (B-D) of a 62-year-old patient with a near occlusion of the left ICA (white open arrow) that is markedly smaller compared to the right ICA (white arrow) in the different level (panel B at C3 level, panel C at C2 level and panel D at C1 level). VR, volume rendered; CTA, CT-angiography.
Figure 6
Figure 6
A 59-year-old female with acute onset of left-sided weakness and clinical suspicion for stroke. CT stroke series included a non-enhanced CT (A), which demonstrates minimal gray-white matter loss of differentiation and loss of the definition of the right basal ganglia. CTA (source image on B and VR on C demonstrates abrupt termination of the contrast column in the right middle cerebral artery distal M1 segment. This is confirmed on the subsequently performed DSA (D). CT, computed tomography; CTA, CT-angiography; VR, volume rendered.
Figure 7
Figure 7
A 63-year-old male with acute onset of asymmetric quadriparesis, alteration in the level of consciousness and oculomotor abnormalities, suspicious for a basilar artery territory infarction. Unenhanced CT was negative. CTA (source image on A and detailed MPR on B and C) demonstrates a focal occlusion in the proximal basilar artery. This was confirmed on the subsequently performed DSA (D). CT, computed tomography; CTA, CT-angiography.
Figure 8
Figure 8
MIP (A,B) of a 37-year-old female patient with normal venous intra-cerebral system. The superior sagittal sinus is visible (white arrows) as well as the straight sinus (white arrowhead). In panel C the CTA axial image of a 42-year-old patient with headache that demonstrated the presence of thrombus at the confluence of sinuses (white open arrow). MIP, maximum intensity projection; CTA, CT-angiography.
Figure 9
Figure 9
A 67-year-old male with a frontal lobe. The first video—CBF and CBV (Cerebral blood flow and cerebral blood volume), the second with the CBF and the third with the CBV demonstrate a left frontal cortical-subcortical area of decreased CBF and decreased CBV without mismatch are noted in the same location. All maps are color-coded red blue for low values and red for high values. CBF, cerebral blood flow; CBV, cerebral blood volume.
Figure 10
Figure 10
A healthy 42-year-old man. CT perfusion maps showing cerebral blood flow (A), cerebral blood volume (B), time to peak (C), demonstrates normal symmetric brain parenchyma perfusion. All maps are color-coded red blue for low values and red for high values. CT, computed tomography.
Figure 11
Figure 11
A 55-year-old male with acute onset of slurred speech, suspicious for a left frontal infarction. CTP maps showing CBF (A), CBV (B), TTP (C), demonstrates a left frontal cortical-subcortical area of decreased CBF and decreased CBV without mismatch are noted in the same location. There is, however, a very small mismatch between the TTP and the CBF and CBV maps. Notably, the unenhanced CT (D) performed right before the CTP was negative. CT, computed tomography; CBF, cerebral blood flow; CBV, cerebral blood volume; TTP, time to peak; CTP, CT perfusion.
Figure 12
Figure 12
A 63-year-old female with acute onset of left-sided weakness, profound left neglect and right gaze preference. Unenhanced CT (A) demonstrates very mild symmetric density within the right middle cerebral artery territory. CTP maps showing CBF (B), CBV (C), MTT (D), demonstrates a right large area of decreased CBF (B) and a relative maintained CBV (C). There is elevated MTT (D), suggesting a large penumbra. CT, computed tomography; CTP, CT perfusion; CBF, cerebral blood flow; CBV, cerebral blood volume; TTP, time to peak; MTT, mean transit time.
Figure 13
Figure 13
A 63-year-old female with acute stroke, same patient of Figure 8. Cerebral angiogram (A) demonstrates a fully occluding thromboembolus within the proximal M1 segment of the right middle cerebral artery, with evidence of some collateral to superior convexity and temporal regions, the former via anterior cerebral artery leptomeningeal branches. Same view demonstrates recanalization of multiple middle cerebral artery branches (B) after intra-arterial thrombolysis and thrombectomy performed with administration of t-PA and penumbra device reperfusion and direct mechanical thrombectomy. Internal carotid artery is indicated by white arrows whereas middle cerebral artery by white open arrow.

Similar articles

Cited by

References

    1. Kim AS, Johnston SC. Global variation in the relative burden of stroke and ischemic heart disease. Circulation 2011;124:314-23 - PubMed
    1. Saposnik G, Kapral MK, Liu Y, et al. IScore: a risk score to predict death early after hospitalization for an acute ischemic stroke. Circulation 2011;123:739-49 - PubMed
    1. Saba L, Sanfilippo R, Pirisi R, et al. Multidetector-row CT angiography in the study of atherosclerotic carotid arteries. Neuroradiology 2007;49:623-37 - PubMed
    1. Saba L, Montisci R, Sanfilippo R, et al. Multidetector row CT of the brain and carotid artery: a correlative analysis. Clin Radiol 2009;64:767-78 - PubMed
    1. Saba L, Potters F, van der Lugt A, et al. Imaging of the fibrous cap in atherosclerotic carotid plaque. Cardiovasc Intervent Radiol 2010;33:681-9 - PubMed