. 2014 Jul 10;9(7):e101239.
doi: 10.1371/journal.pone.0101239. eCollection 2014.

Visualizing molecular profiles of glioblastoma with GBM-BioDP

Affiliations

Visualizing molecular profiles of glioblastoma with GBM-BioDP

Orieta Celiku et al. PLoS One. .

Abstract

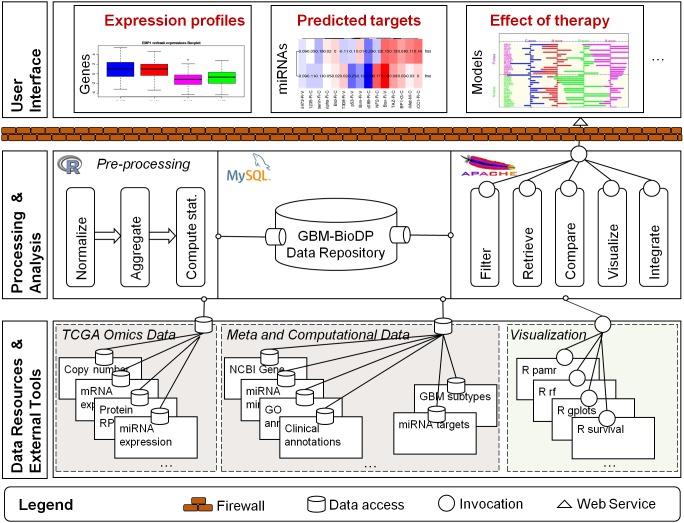
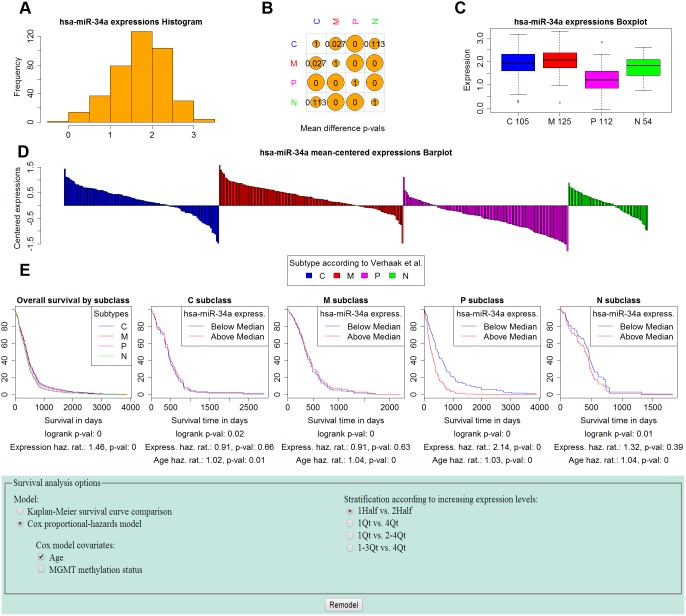
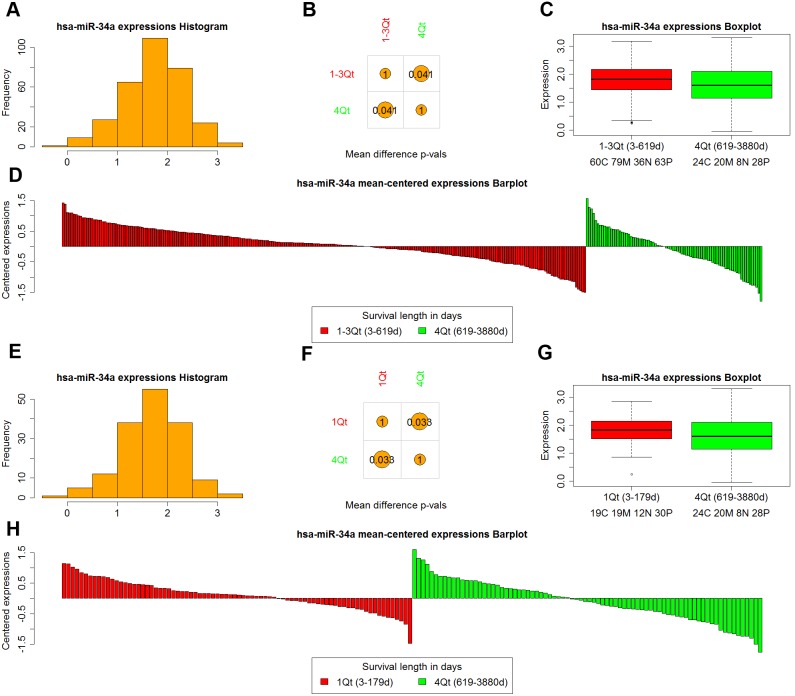
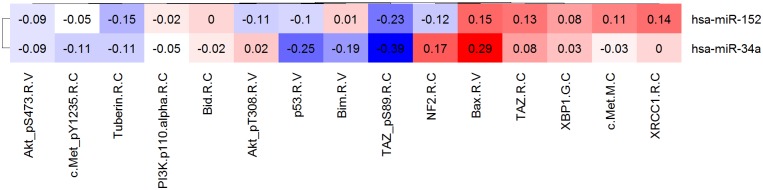
Validation of clinical biomarkers and response to therapy is a challenging topic in cancer research. An important source of information for virtual validation is the datasets generated from multi-center cancer research projects such as The Cancer Genome Atlas project (TCGA). These data enable investigation of genetic and epigenetic changes responsible for cancer onset and progression, response to cancer therapies, and discovery of the molecular profiles of various cancers. However, these analyses often require bulk download of data and substantial bioinformatics expertise, which can be intimidating for investigators. Here, we report on the development of a new resource available to scientists: a data base called Glioblastoma Bio Discovery Portal (GBM-BioDP). GBM-BioDP is a free web-accessible resource that hosts a subset of the glioblastoma TCGA data and enables an intuitive query and interactive display of the resultant data. This resource provides visualization tools for the exploration of gene, miRNA, and protein expression, differential expression within the subtypes of GBM, and potential associations with clinical outcome, which are useful for virtual biological validation. The tool may also enable generation of hypotheses on how therapies impact GBM molecular profiles, which can help in personalization of treatment for optimal outcome. The resource can be accessed freely at http://gbm-biodp.nci.nih.gov (a tutorial is included).


Conflict of interest statement

Competing Interests: The authors have declared that no competing interests exist.

Figures

Figure 1
Figure 1. GBM-BioDP overall architecture.
The diagram represents a runtime view of the architecture of GBM-BioDP. The lower tier represents the sources of experimental and meta data, and external tools that are invoked to visualize the data. The middle tier represents how the data are processed, stored, and made available to the user. The right hand side of the middle tier represents the visualization “services” that are available at runtime to the user. These services are made available as web-services and are hosted on an Apache server. The higher tier represents the user interface, and is organized in a tabbed interface.
Figure 2
Figure 2. miRNAs module use case – mir-34a profile and survival analysis by GBM subtype stratification.
mir-34a was recently identified (by Genovese et al. [26]) as a regulator of TGF-Beta in GBM, and as having prognostic value. Panels A–D show the distribution of mir-34a expression levels. Panel A shows the distribution over all GBM samples. Panel B tabulates the p-values of two-sided t-tests comparing the expression levels between subtypes. Panel C shows a boxplot of the mir-34a expression distribution for each subtype. The proneural subtype shows significantly lower expression compared to the other subtypes (the proneural p-values from Panel B are both zero). Panel D shows barplots of the expression for each group, centered around the entire GBM sample mean. Panel E shows the survival analysis results and options used. We perform a Cox proportional hazards survival analysis with mir-34a expression levels stratified as low if they are below the median and high otherwise, and Age as covariate. The analysis confirms the results of Genovese et al. who found lower expression of mir-34a in proneural patients to be associated with better prognosis. Indeed, the analysis shows that high levels of mir-34a expression are associated with a hazard ratio of 2.14 (p-value = 0, and logrank = 0).
Figure 3
Figure 3. miRNAs module use case – mir-34a profile by survivorship stratification.
We compare the expression levels of mir-34a in samples stratified by length of survival. Panels A–D shows comparison of 1–3 Quartiles (short survivors) versus 4th Quartile (long survivors). Panels E–H shows comparison of 1st Quartile (short survivors) versus 4th Quartile (long survivors). A, E show the histogram of expression distribution for all GBM patients. B, F show the p-values of the t-tests comparing expression of mir-34a in short and long survivors. C, G show the boxplots of expression for short and long survivors, and D, H show barplots of expressions mean-centered around the mean of the two groups. In both stratifications, long survivors (4th Quartile patients) express significantly lower levels of mir-34a compared to short survivors (p-val 0.041 when compared to 1–3 Quartile patients, and p-val 0.033 when compared to 1st Quartile patients).
Figure 4
Figure 4. Use case from miRNAs module – miRNA targets.
Correlation of mir-34a predicted targets, and p53. Color red represent positive correlation, whereas blue color represent negative correlation. The cells are annotated with the correlation values. p53 and mir-34a expression are anti-correlated, which indicates a possible suppressor role of mir-34a.
Figure 5
Figure 5. Hypothesis generation – Molecular classification of GBM clinical data.
A. Model depicting parallels between tumor subtypes and stages in neurogenesis . B. Main features of tumor subtypes , . C. Random forest model “out of bag” error rates for training data using 201 samples from and the corresponding 768 gene expression measurements common between the training and validated data. D. Summary of error rates for the predicted subtypes of validated data. Abbreviations RF: random forest, C: classical, M: mesenchymal, N: neural, P: proneural.

References

    1. Network CGAR (2008) Comprehensive genomic characterization defines human glioblastoma genes and core pathways. Nature 455: 1061–1068. - PMC - PubMed
    1. Stupp R, Mason WP, van den Bent MJ, Weller M, Fisher B, et al. (2005) Radiotherapy plus concomitant and adjuvant temozolomide for glioblastoma. N Engl J Med 352: 987–996. - PubMed
    1. Hegi ME, Diserens AC, Gorlia T, Hamou MF, de Tribolet N, et al. (2005) MGMT gene silencing and benefit from temozolomide in glioblastoma. N Engl J Med 352: 997–1003. - PubMed
    1. Addeo R, De Santi MS, Del Prete S, Caraglia M (2009) Fotemustine and recurrent glioblastoma: possible new opportunities for an old drug. Cancer Chemother Pharmacol 64: 863–866. - PubMed
    1. Addeo R, Caraglia M, De Santi MS, Montella L, Abbruzzese A, et al. (2011) A new schedule of fotemustine in temozolomide-pretreated patients with relapsing glioblastoma. J Neurooncol 102: 417–424. - PMC - PubMed

Publication types