. 2014 Jul 10;10(7):e1004475.
doi: 10.1371/journal.pgen.1004475. eCollection 2014 Jul.

The genomic landscape of the Ewing Sarcoma family of tumors reveals recurrent STAG2 mutation

Affiliations

The genomic landscape of the Ewing Sarcoma family of tumors reveals recurrent STAG2 mutation

Andrew S Brohl et al. PLoS Genet. .

Erratum in

  • PLoS Genet. 2014 Aug;10(8):e1004629

Abstract

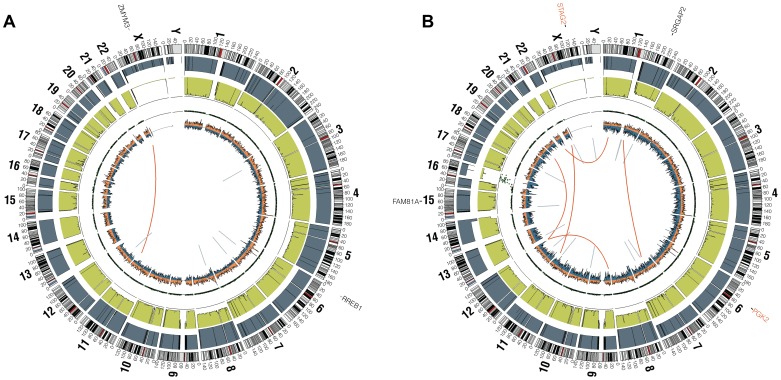
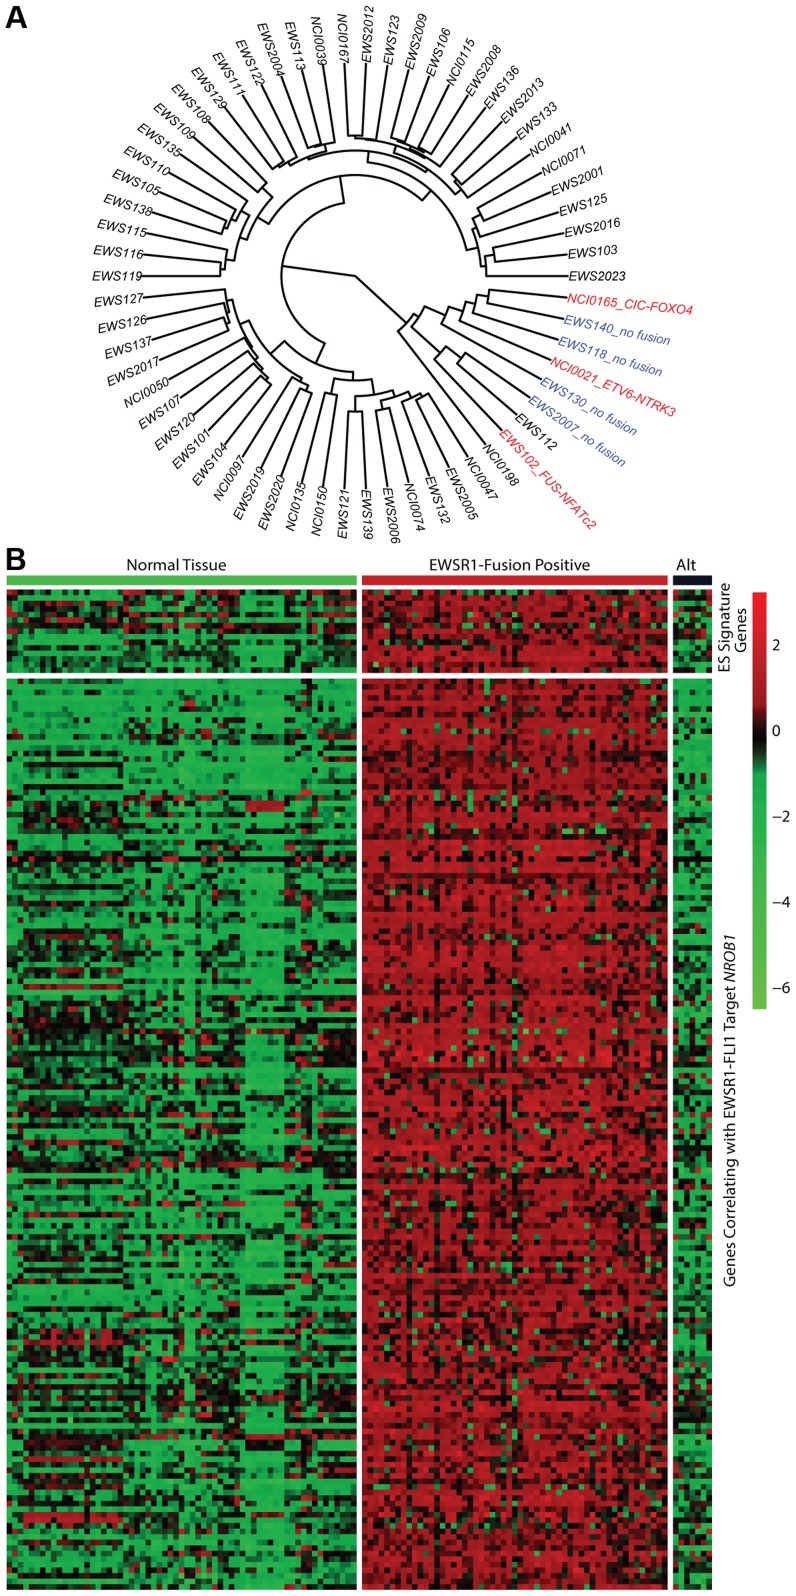
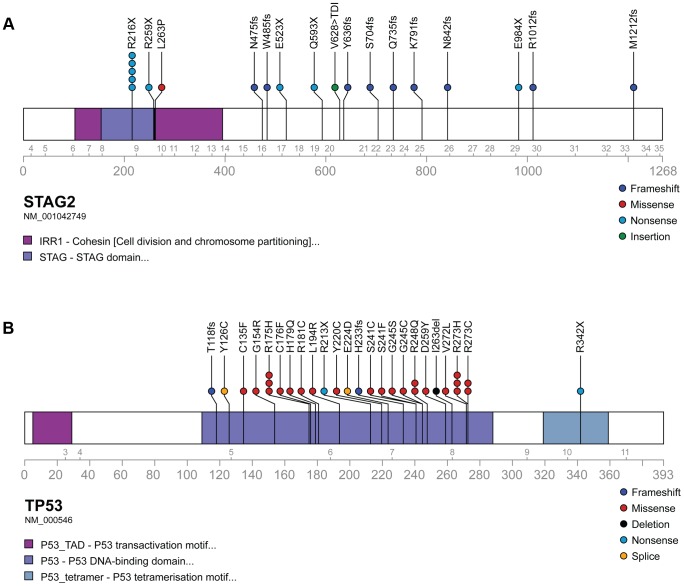
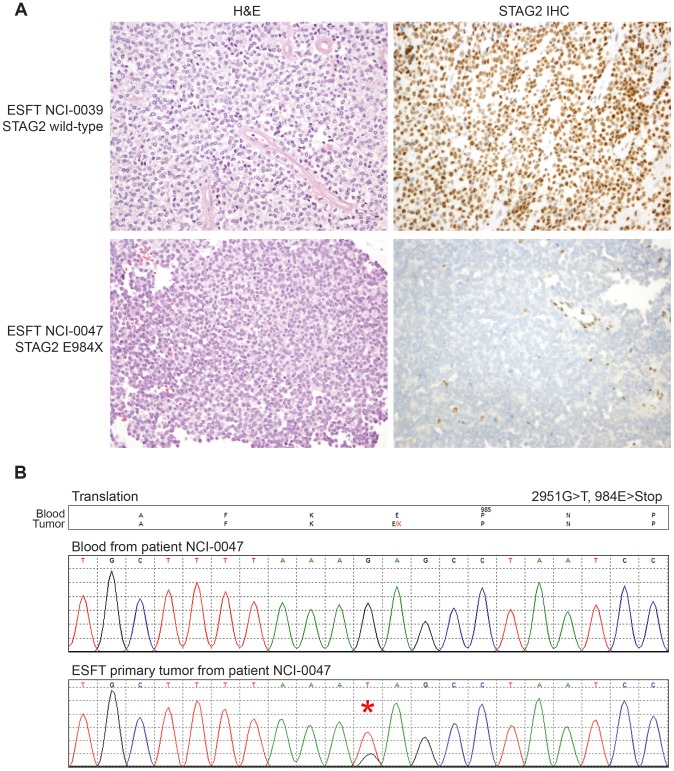
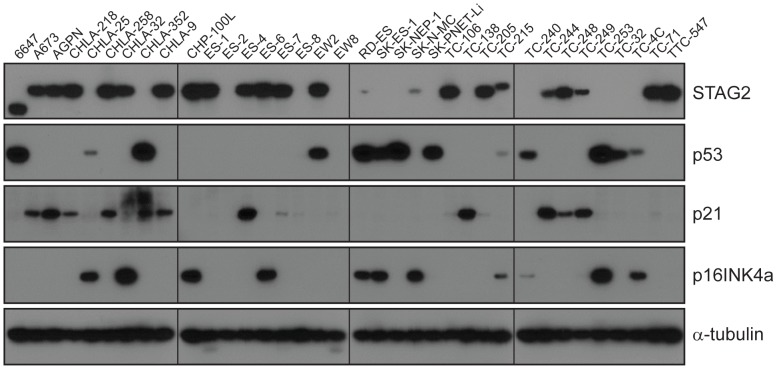
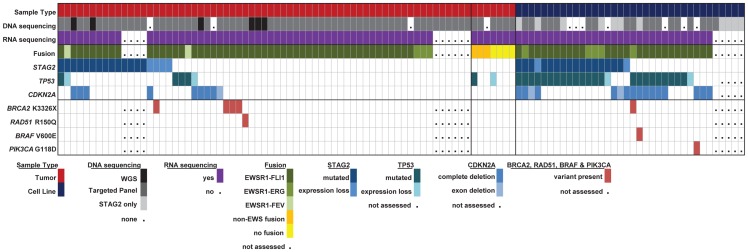
The Ewing sarcoma family of tumors (EFT) is a group of highly malignant small round blue cell tumors occurring in children and young adults. We report here the largest genomic survey to date of 101 EFT (65 tumors and 36 cell lines). Using a combination of whole genome sequencing and targeted sequencing approaches, we discover that EFT has a very low mutational burden (0.15 mutations/Mb) but frequent deleterious mutations in the cohesin complex subunit STAG2 (21.5% tumors, 44.4% cell lines), homozygous deletion of CDKN2A (13.8% and 50%) and mutations of TP53 (6.2% and 71.9%). We additionally note an increased prevalence of the BRCA2 K3326X polymorphism in EFT patient samples (7.3%) compared to population data (OR 7.1, p = 0.006). Using whole transcriptome sequencing, we find that 11% of tumors pathologically diagnosed as EFT lack a typical EWSR1 fusion oncogene and that these tumors do not have a characteristic Ewing sarcoma gene expression signature. We identify samples harboring novel fusion genes including FUS-NCATc2 and CIC-FOXO4 that may represent distinct small round blue cell tumor variants. In an independent EFT tissue microarray cohort, we show that STAG2 loss as detected by immunohistochemistry may be associated with more advanced disease (p = 0.15) and a modest decrease in overall survival (p = 0.10). These results significantly advance our understanding of the genomic and molecular underpinnings of Ewing sarcoma and provide a foundation towards further efforts to improve diagnosis, prognosis, and precision therapeutics testing.


Conflict of interest statement

The authors have declared that no competing interests exist.

Figures

Figure 1
Figure 1. Circos plots of representative Ewing sarcoma family tumors.
Circos plot tracks represent somatic mutations, from outside circle: mutated genes including missense (Black), indel (Red) and nonsense (Orange); genomic location; genome copy number alterations (Grey); lesser allele frequency (Green); LOH (dotted track); density of heterozygous SNPs (Orange); density of homozygous SNPs (Blue); Intrachromasomal (Grey) and interchromasomal (Red) rearrangements. Tumor EWS2006 (A) contains only 2 somatic coding mutations. Tumor EWS2017 (B) has 4 somatic coding mutations including a frameshift mutation in STAG2. Both tumors shown have the characteristic EWSR1-FLI1 fusion and a modest degree of aneuploidy.
Figure 2
Figure 2. Molecular profiling of Ewing sarcoma family tumors using RNA sequencing data.
EFT clinical samples that lack an EWSR1-fusion have a distinct profile. A) Hierarchical clustering based on RNA expressional profile shows the fusion negative (blue) and alternate fusion (red) samples to separate from the majority of EWSR1-fusion positive EFTs. B) Expression profile of Ewing sarcoma signature genes (top) and genes correlating with EWSR1-FLI1 target NROB1 (bottom) in normal tissues and EFT cohort demonstrating the lack of typical expressional profile in EWSR1-fusion negative samples (Alt).
Figure 3
Figure 3. Mutational spectrum in STAG2 (A) and TP53 (B) on linear protein models.
Exonic point mutations and small indels are shown in relation to the functional domains of these genes. Larger structural mutations and non-exonic mutations in STAG2 are not pictured and include multi-exon intragenic deletions (3), intronic splice site mutations (3), intragenic duplication events (2), 5′ (1) and 3′ UTR (1) mutations.
Figure 4
Figure 4. Examples of immunohistochemistry showing STAG2 expression in Ewing sarcoma tumor samples.
A) STAG2 is robustly expressed in EFT harboring wild-type STAG2 alleles (top), but is completely lost in the subset of EFT harboring truncating mutations of the STAG2 gene (bottom). Expression is retained within the non-neoplastic stromal and endothelial cells, demonstrating the somatic nature of STAG2 loss in these tumors. B) Sequence trace demonstrating the E984X STAG2 nonsense mutation present in EFT sample NCI-0047 that is shown in A.
Figure 5
Figure 5. Western blots analysis of STAG2, TP53, p21WAF1/CIP1, and p16INK4a on a panel of 36 unique EFT cell lines.
13 of 36 cell lines have complete absence of STAG2 protein, an additional two cell lines (6647 and TC-215) have STAG2 isoforms with altered molecular weight due to large intragenic in-frame insertions or deletions, one additional cell line (ES-7) has intact STAG2 expression despite a frameshift mutation occurring at amino acid residue 1212 that is C-terminal to the epitope recognized by the antibody, and two additional cell lines have intact STAG2 expression but harbor a small in-frame insertion (CHLA-9) and a missense mutation (ES-6). Absence of p16INK4a protein is seen in 25/36 cell lines including all 16 with identified CDKN2A deletion.
Figure 6
Figure 6. Summary of sequencing findings in EFT tumors (red) and cell lines (dark blue) highlighting recurrent alterations.
There are frequent alterations in STAG2, TP53, and CDKN2A in EFT tumors and cell lines. 57/97 (58.7%) of samples containing an EWSR1-ETS fusion have a secondary mutation in one of these three tumor suppressor genes. Notable variants in BRAF, PI3KCA, RAD51 and BRCA2 are also shown.

References

    1. Howlader N, Noone A, Krapcho M, Garshell J, Neyman N, et al.. (2013) SEER Cancer Statistics Review (1975–2010). Available: http://seer.cancer.gov/csr/1975_2010/. Accessed 11 June 2014.
    1. Barker LM, Pendergrass TW, Sanders JE, Hawkins DS (2005) Survival after recurrence of Ewing's sarcoma family of tumors. J Clin Oncol 23: 4354–4362. - PubMed
    1. Esiashvili N, Goodman M, Marcus RB Jr (2008) Changes in incidence and survival of Ewing sarcoma patients over the past 3 decades: Surveillance Epidemiology and End Results data. J Pediatr Hematol Oncol 30: 425–430. - PubMed
    1. Delattre O, Zucman J, Melot T, Garau XS, Zucker JM, et al. (1994) The Ewing family of tumors–a subgroup of small-round-cell tumors defined by specific chimeric transcripts. N Engl J Med 331: 294–299. - PubMed
    1. Turc-Carel C, Aurias A, Mugneret F, Lizard S, Sidaner I, et al. (1988) Chromosomes in Ewing's sarcoma. I. An evaluation of 85 cases of remarkable consistency of t(11;22)(q24;q12). Cancer Genet Cytogenet 32: 229–238. - PubMed

Publication types