. 2014 Jul 10;10(7):e1004462.
doi: 10.1371/journal.pgen.1004462. eCollection 2014 Jul.

Clonal architecture of secondary acute myeloid leukemia defined by single-cell sequencing

Affiliations

Clonal architecture of secondary acute myeloid leukemia defined by single-cell sequencing

Andrew E O Hughes et al. PLoS Genet. .

Abstract

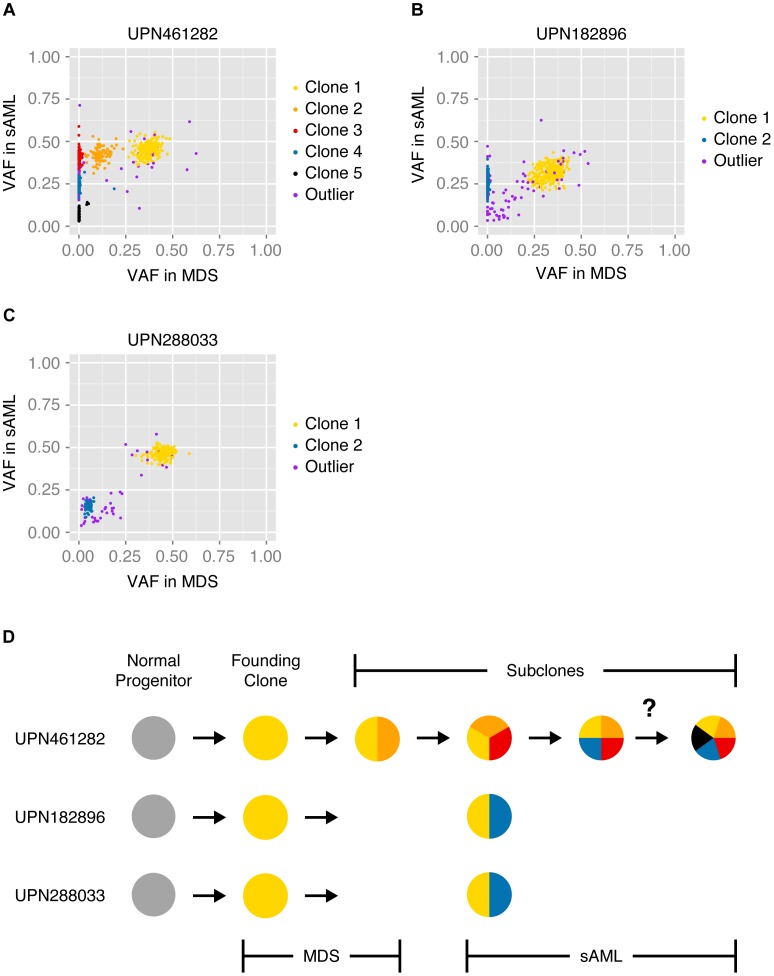
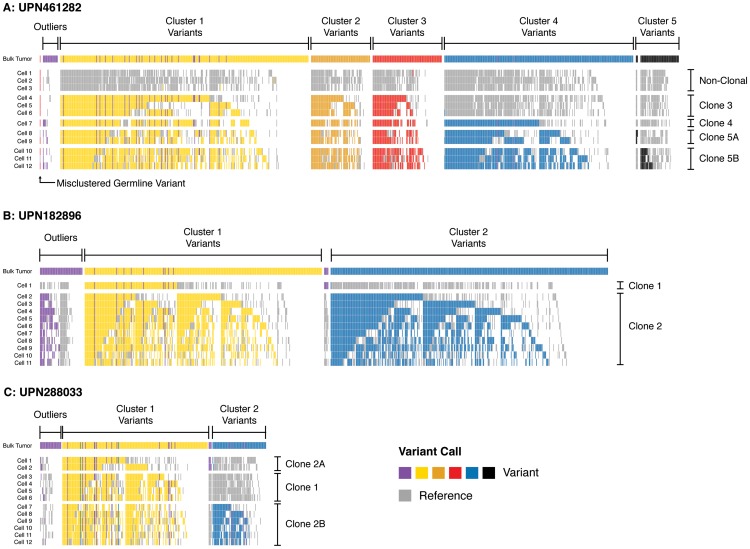
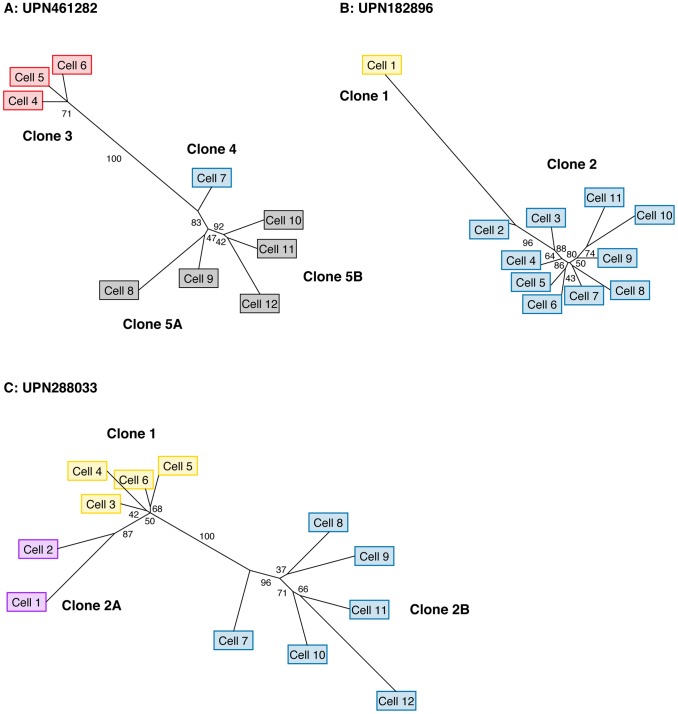
Next-generation sequencing has been used to infer the clonality of heterogeneous tumor samples. These analyses yield specific predictions-the population frequency of individual clones, their genetic composition, and their evolutionary relationships-which we set out to test by sequencing individual cells from three subjects diagnosed with secondary acute myeloid leukemia, each of whom had been previously characterized by whole genome sequencing of unfractionated tumor samples. Single-cell mutation profiling strongly supported the clonal architecture implied by the analysis of bulk material. In addition, it resolved the clonal assignment of single nucleotide variants that had been initially ambiguous and identified areas of previously unappreciated complexity. Accordingly, we find that many of the key assumptions underlying the analysis of tumor clonality by deep sequencing of unfractionated material are valid. Furthermore, we illustrate a single-cell sequencing strategy for interrogating the clonal relationships among known variants that is cost-effective, scalable, and adaptable to the analysis of both hematopoietic and solid tumors, or any heterogeneous population of cells.


Conflict of interest statement

The authors have declared that no competing interests exist.

Figures

Figure 1
Figure 1. Depth and distribution of coverage for each sequencing library (n = 56).
(A) Cumulative coverage represented as the proportion of the capture target (y-axis) with read depth greater than or equal to specific coverage thresholds (x-axis). Coverage values are derived from quality-filtered data (de-duplicated, phred-scaled alignment quality ≥10, phred- scaled base quality ≥13). The intersection of each curve with y = 0.5 identifies the median coverage. Higher coverage was obtained for the unsorted samples (median 228×), compared to the single- or two-cell samples (median 28×). (B) Lorenz curve detailing uniformity of coverage as proportion of targeted bases versus proportion of sequenced bases. Dashed line (y = x) represents a perfectly uniform distribution of read depth across the capture target. Libraries prepared from WGA samples (single- and two-cells) exhibit significantly less uniform representation, compared to libraries derived from unfractionated material. See Table 1 and Table S3 for additional details.
Figure 2
Figure 2. Performance of variant calling.
The specificity (A) and sensitivity (B, C) of three separate variant callers—SAMtools, VarScan2, and GATK—were evaluated by analyzing single-cell variant calls at germline SNPs previously ascertained by Affymetrix SNP arrays . As we have defined true positive and true negative, sensitivity is undefined at homozygous reference positions (there are no true positives) and specificity is undefined at heterozygous and homozygous variant positions (there are no true negatives). Sensitivity and specificity were similar among all three callers at homozygous positions, but GATK demonstrated greater sensitivity at heterozygous sites. Variants were called jointly across all single-cell libraries with the GATK Unified Genotyper utility, whereas variants were called independently for each sample using SAMtools and VarScan2. See Table 2 and Table S6 for additional details. TPR: true positive rate. FPR: false positive rate.
Figure 3
Figure 3. Model of tumor clonality predicted from unfractionated samples.
SciClone analysis and cluster assignment of previously validated somatic mutations present in unsorted MDS and sAML bone marrow cells , . Variant allele fractions of variants at MDS (x-axis) and sAML (y-axis) predict specific tumor substructure and evolution over time. Color-coded mutation clusters are completely non-overlapping between subjects. (A) At sAML diagnosis, UPN461282 was predicted to harbor 10% non-tumor cells in addition to 5 subclones: 1) 6% of cells harboring cluster 1 variants (clone 1), 2) 4% of cells harboring cluster 1 and cluster 2 variants (clone 2), 3) 33% of cells harboring cluster 1, cluster 2, and cluster 3 variants (clone 3), 4) 33% of cells harboring cluster 1, cluster 2, cluster 3, and cluster 4 variants (clone 4), and 5) 14% of cells harboring either cluster 1, cluster 2, cluster 3, and cluster 5 variants or cluster 1, cluster 2, cluster 3, cluster 4, and cluster 5 variants (clone 5). (B) At diagnosis with sAML, UPN182896 was predicted to harbor 35% non-tumor cells in addition to 2 subclones: 1) 13% of cells harboring cluster 1 variants (clone 1), and 2) 52% of cells harboring cluster 1 and cluster 2 variants (clone 2). (C) At diagnosis with sAML, UPN288033 was predicted to harbor 7% non-tumor cells in addition to 2 subclones: 1) 62% of cells harboring cluster 1 variants (clone 1), and 2) 31% of cells harboring cluster 1 and cluster 2 variants (clone 2). (D) Schematic summarizing our initial models of clonal evolution inferred from SciClone analysis—the question mark denotes ambiguity of clone 5 origin in UPN461282.
Figure 4
Figure 4. Single-cell mutation profiles.
Variant profiles across targeted somatic mutations in single-cell samples (sAML bone marrow) in (A) UPN461282, (B) UPN182896, and (C) UPN288033. Rows display positive and negative variant calls color-coded by mutation cluster for each single-cell sample, and columns indicate specific SNVs somatic at sAML diagnosis. Variants are grouped and color-coded by cluster as predicted from sequencing unfractionated material (uppermost track in each panel). Each cell is grouped by the clone it is inferred to represent. Outlier SNVs (purple) were those which could not be confidently clustered based on bulk sequencing. Here, many of these are merged into predicted clusters based upon their presence/absence in single-cell libraries (i.e., harboring the same pattern as well-defined clones). Positions where reference calls were made are colored grey; positions where no call was made (<25× coverage) are colored white. Pairs of variants that always travel in the same state (reference or variant) likely arose in the same clonal expansion. Pairs of variants that are called together in some cells but not others are likely related by linear evolution. Pairs of variants that are mutually exclusive suggest evolutionary branch points, and were rare. This suggested that variants in subclone 5 in UPN461282 (A), and subclone 1 in UPN288033 (C) were divided among additional subclones (now 5A/5B, 2A/2B). See Figure S7 for data presentation with unmodified clone and cluster definitions (derived from bulk sequencing).
Figure 5
Figure 5. Single-cell reconstruction of tumor phylogeny.
Maximum likelihood phylogenetic trees derived from single-cell genotypes at targeted somatic SNVs. (A) UPN461282 (B) UPN182896 (C) UPN288033. Values along edges represent branch support determined by non-parametric bootstrap (n = 1000 iterations). Edges with ≥75% support are considered strongly supported. Cell labels are identical to those in Figure 4 , and colored based on the presence variant clusters corresponding to the profiles detailed in Figure 4 .

References

    1. Welch JS, Ley TJ, Link DC, Miller CA, Larson DE, et al. (2012) The origin and evolution of mutations in acute myeloid leukemia. Cell 150: 264–278. - PMC - PubMed
    1. Ding L, Ley TJ, Larson DE, Miller CA, Koboldt DC, et al. (2012) Clonal evolution in relapsed acute myeloid leukaemia revealed by whole-genome sequencing. Nature 481: 506–510. - PMC - PubMed
    1. Ding L, Ellis MJ, Li S, Larson DE, Chen K, et al. (2010) Genome remodelling in a basal-like breast cancer metastasis and xenograft. Nature 464: 999–1005. - PMC - PubMed
    1. Yachida S, Jones S, Bozic I, Antal T, Leary R, et al. (2010) Distant metastasis occurs late during the genetic evolution of pancreatic cancer. Nature 467: 1114–1117. - PMC - PubMed
    1. Tao Y, Ruan J, Yeh SH, Lu X, Wang Y, et al. (2011) Rapid growth of a hepatocellular carcinoma and the driving mutations revealed by cell-population genetic analysis of whole-genome data. Proc Natl Acad Sci U S A 108: 12042–12047. - PMC - PubMed

Publication types

MeSH terms