. 2014 Sep 9;111(6):1188-200.
doi: 10.1038/bjc.2014.382. Epub 2014 Jul 10.

Downregulated miR-646 in clear cell renal carcinoma correlated with tumour metastasis by targeting the nin one binding protein (NOB1)

Affiliations

Downregulated miR-646 in clear cell renal carcinoma correlated with tumour metastasis by targeting the nin one binding protein (NOB1)

W Li et al. Br J Cancer. .

Abstract

Background: Nin one binding protein (NOB1) was identified as a potential oncogene in human glioma and miR-646 plays an important role in human growth and development. However, the underlying molecular mechanisms of NOB1 in tumorigenicity and its correlation with miR-646 in renal cell carcinoma (RCC) have not been investigated.

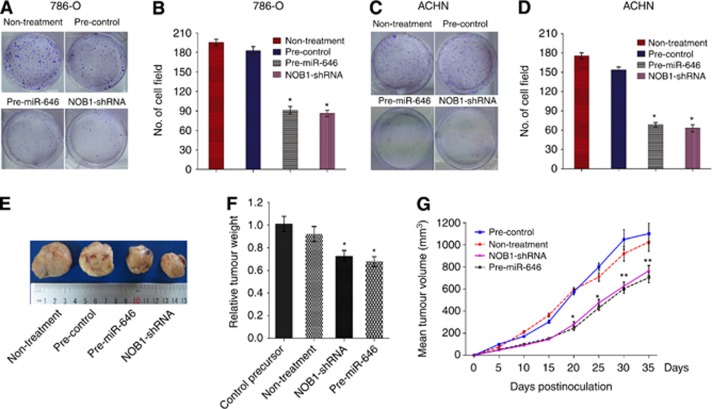
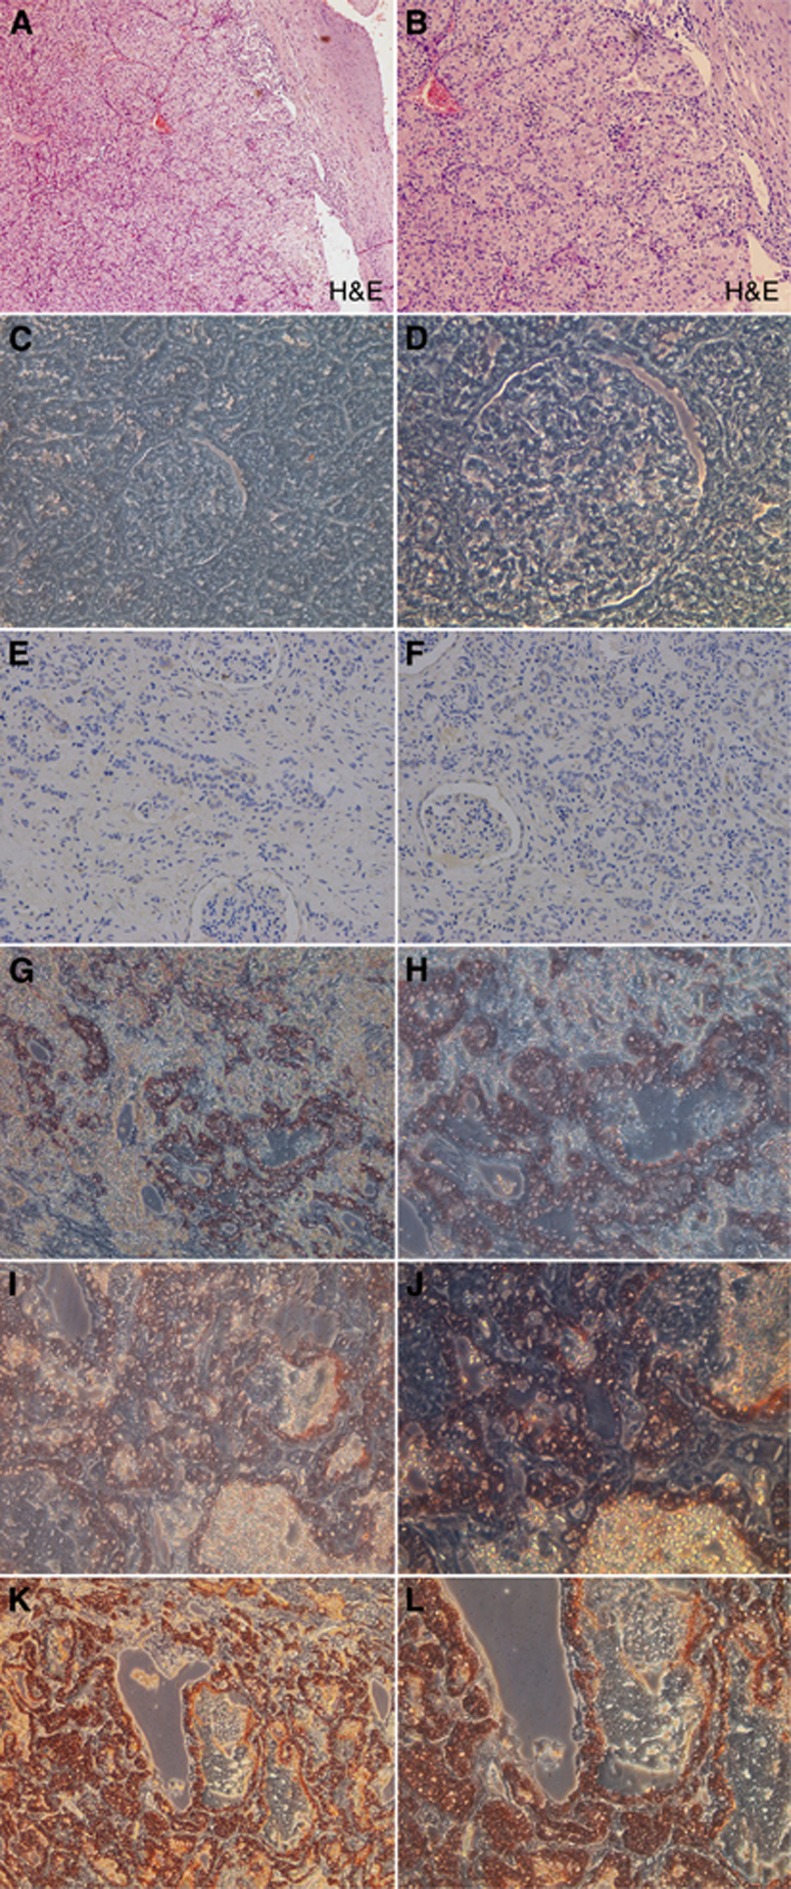
Methods: We performed bioinformatic analysis to explore miRNA targeting NOB1. The expression of NOB1 and miR-646 from 100 cases of clear cell RCC (ccRCC) and 30 cases of adjacent non-tumour tissues were detected by quantitative real-time PCR. The expression of miR-646 was correlated with NOB1 expression, tumour features and patient metastasis-free survival. The effect of overexpression of mir-646 on renal cancer cell proliferation was detected by colony formation in soft agar. Using a xenograft tumour model, we observed the in vivo tumorigenesis effect of miR-646 and NOB1.

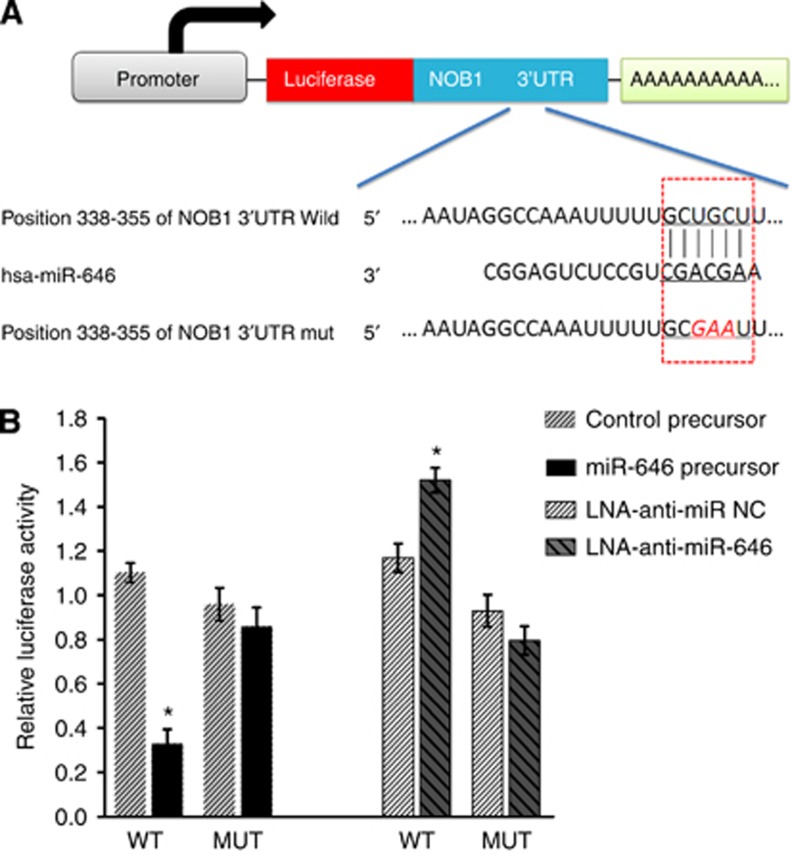
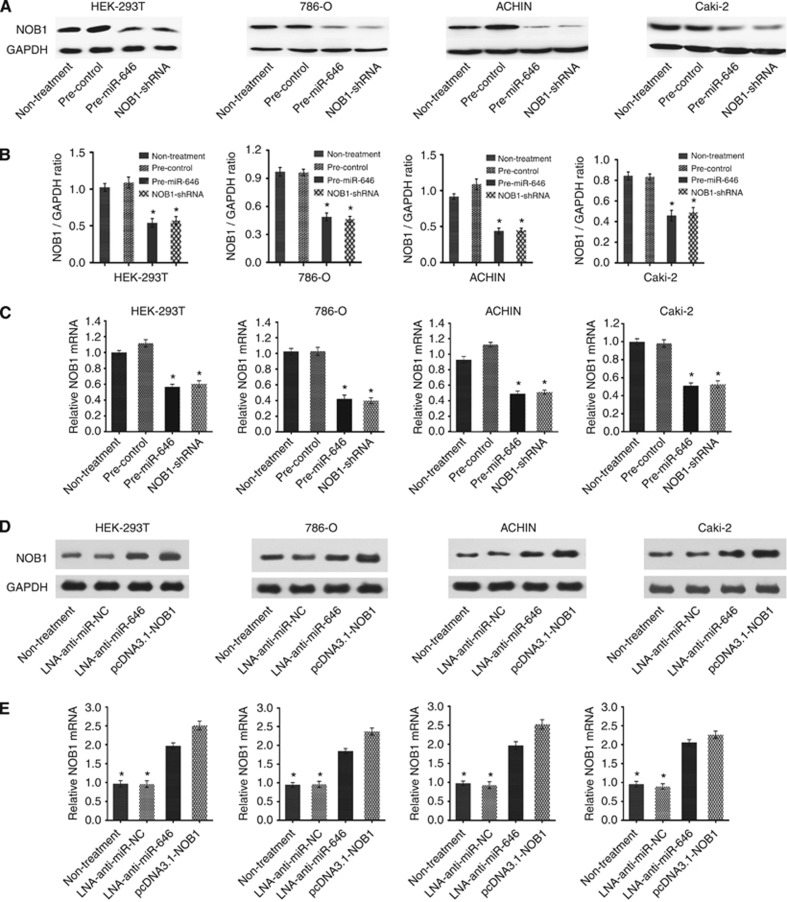
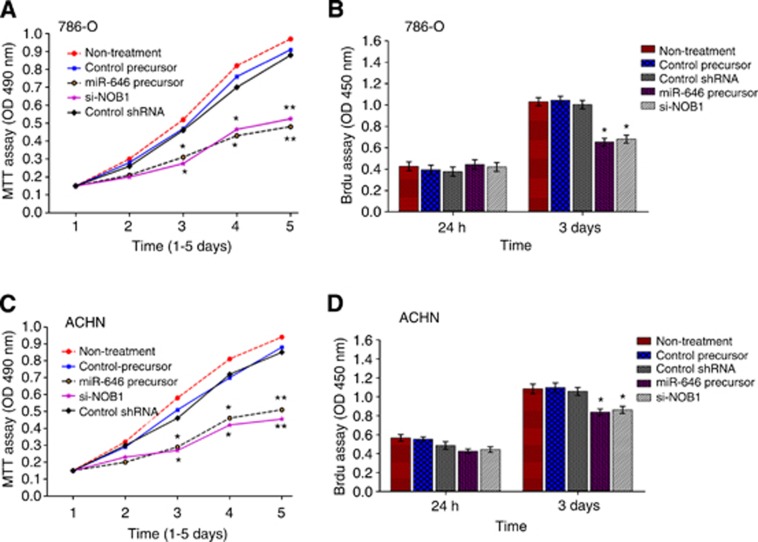
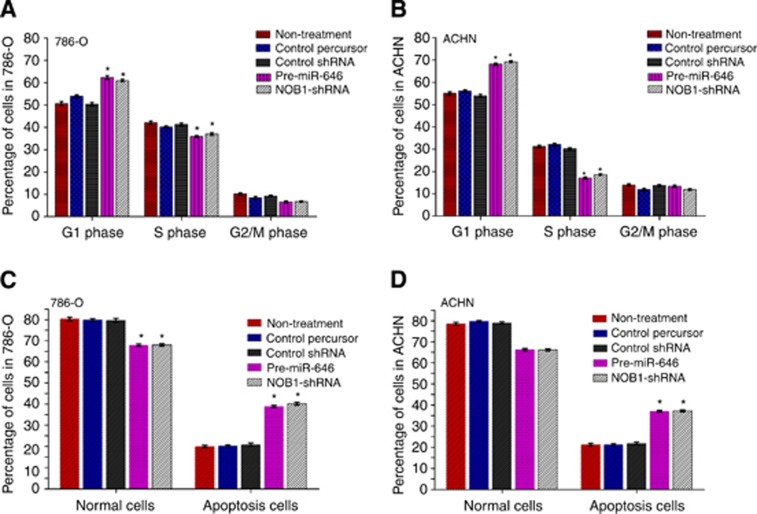
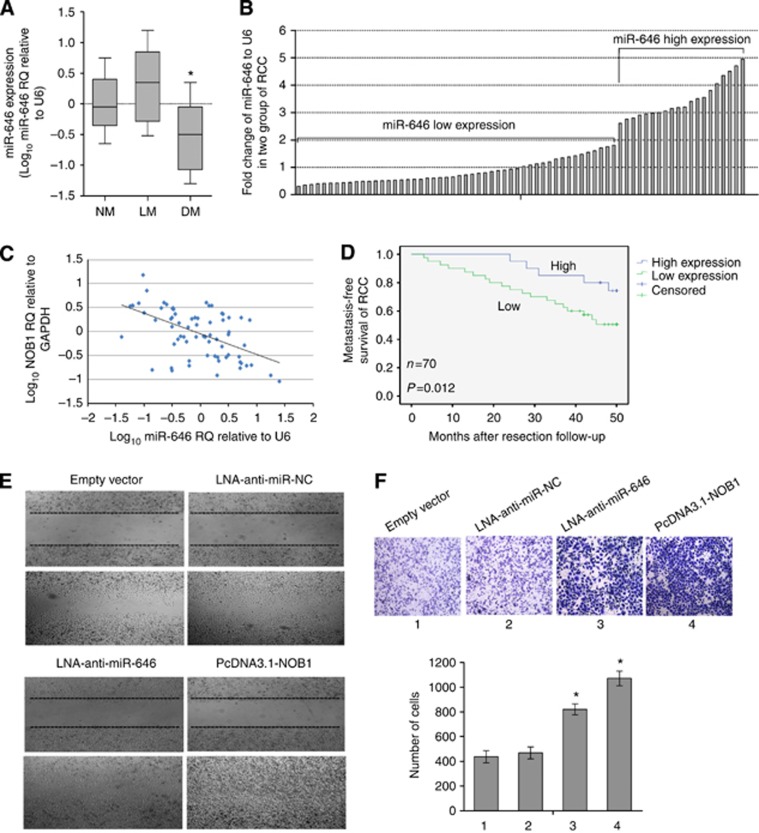
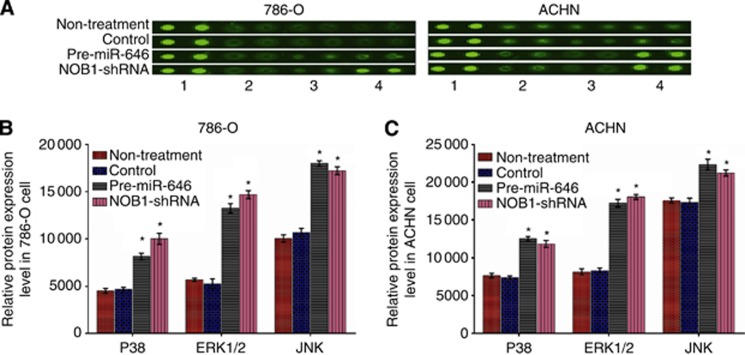
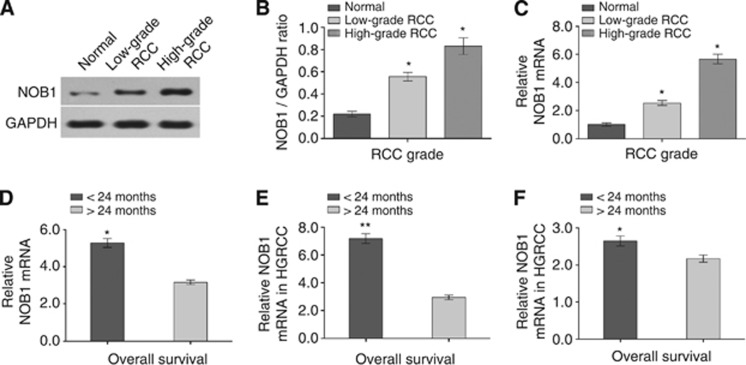
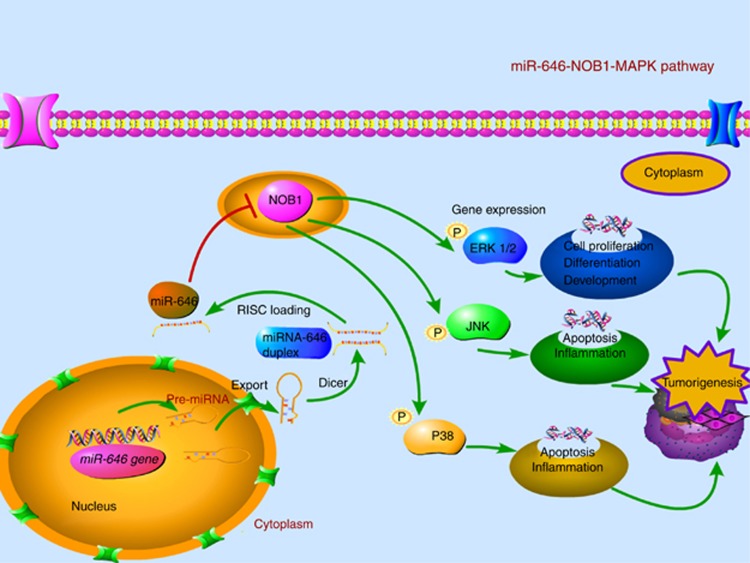
Results: miR-646 negatively regulated NOB1 and inhibited the proliferation and migration of renal cancer cells. There was a significant upregulation of NOB1 in ccRCC and it was further increased in metastatic cases, while miR-646 was downregulated in tumour tissues and further decreased in metastatic ccRCC. Additionally, expression of miR-646 was inversely correlated with the expression of NOB1. The downregulation of miR-646 also indicated a higher probability of developing metastasis. Most importantly, miR-646 expression was an independent predictor of ccRCC metastasis by the univariate analysis and binary logistic regression model (both P<0.05). Colony formation in soft agar and xenograft tumour model suggested that miR-646 and NOB1 are required for tumorigenesis in vitro and in vivo. Furthermore, suppression of NOB1 increased the phosphorylation of several proteins in MAPK pathway.

Conclusions: Downregulated miR-646 in ccRCC was associated with tumour metastasis through MAPK pathway by targeting NOB1. miR-646 and NOB1 may play an important role in the development of ccRCC.


Figures

Figure 1
Figure 1
miR-646 targets the 3′-UTR of NOB1 in luciferase reporter assay. (A) Ideograph of NOB1 mRNA. The predicted miR-646-binding site in the NOB1 3′-UTR. The sequence of wild-type (WT) and mutant (MUT) miR-646 target sites in the NOB1 3′-UTR shown in frame. A point mutation (underlined) was made in the seed region to block the binding between miR-646 and mRNA. (B) The luciferase reporter assay was used to confirm the contribution of the four miR-646 target sites. ACHN cells were co-transfected with luciferase reporter plasmids containing either WT or MUT miR-646 target sites and miR-646, control precursors, LNA-anti-miR NC and LNA-anti-miR-646. miR-646 and full-length wild-type NOB1 3′-UTR decreased luciferase activity. All results were derived from independent experiments performed in triplicate (*P<0.01).
Figure 2
Figure 2
miR-646 overexpression can downregulate NOB1 protein and mRNA expression. HEK-293T, 786-O, ACHN and Caki-2 cells were transfected with previously generated miR-646, miR-NC, NOB1-shRNA or untreated control vectors. (A and B) The results of western blot were analysed with Quantity One (n=3). miR-646 significantly repressed NOB1 protein expression in RCC cell lines. (C) The downregulation of NOB1 mRNA following miR-646 transfection in three RCC cell lines was analysed by RT–PCR (*P<0.01). (D) HEK-293T, 786-O, ACHN and Caki-2 cells were transfected with LNA-anti-miR-646, LNA-anti-miR NC, pcDNA3.1-NOB1 or untreated control vectors. The results of western blot shown miR-646 significantly increased NOB1 protein expression in RCC cell lines. (E) The upregulation of NOB1 mRNA following LNA-anti-miR-646 transfection in three RCC cell lines was analysed by RT–PCR (*P<0.01).
Figure 3
Figure 3
Cell viability and proliferation were detected in human renal cancer cells transfected with pre-miR-646. 786-O (A) and ACHN (C) cells were transfected with miR-646 precursor, control precursor, NOB1-shRNA, non-treatment and control shRNA for 3 days as described in the methods section before measurement of the conversion of MTT to a coloured formazan product. A statistically significant delay of cell proliferation was observed after day 3. 786-O cells (B) and ACHN cells (D) were transfected with miR-646 precursor, control precursor, NOB1-shRNA, nothing and control shRNA for 3 days as described in the methods section, and the BrdU incorporation assay was performed. BrdU incorporation was decreased in the miR-646 group and NOB1-shRNA group compared to the controls at 3 days. Significant differences between transfected cells and mock-infected cells were determined using the two-tailed Student's t-test (**P<0.01, *P<0.05).
Figure 4
Figure 4
Effect of NOB1 and miR-646 expression on the cell cycle and apoptosis in renal cancer cells. (A and B) 786-O and ACHN cells were transfected with pre-miR-646, NOB1-shRNA, control percursor or control shRNA, respectively. After being cultured for 48 h, cells were fixed and stained with propidium iodide and cell cycle was analysed by flow cytometry. Representative analysis of three independent experiments is shown. (C and D) Quantities of the apoptosis cells with Annexin V-FITC/PI stain and flow cytometry analysis. miR-646 expression or NOB1 silencing causes G1-phase cell cycle arrest, and induced early apoptosis (Annexin V+/PI−). Three independent experiments were performed in each group (*P<0.05).
Figure 5
Figure 5
Association of miR-646 with ccRCC distant metastasis and metastasis-free survival. (A) Real-time PCR analyses of miR-646 expression in non-metastatic (NM; n=70), lymphatic metastatic (LM; n=9) and distant metastatic (DM; n=20) ccRCC (*P<0.05 between the DM and NM groups). (B) A total of 70 cases of NM RCC were grouped into two, ‘low miR-646' (n=50) and ‘high miR-646' (n=20) according to miR-646 expression at the threshold giving the lowest P value of log-rank test comparing metastasis-free survival between the two groups. (C) NOB1 expression was negatively correlated with miR-646 expression in ccRCC (linear correlation analysis, r=−0.745, P<0.001). (D) Kaplan–Meier graph representing the probability of metastasis-free survival in ccRCC from the two groups. The status was defined as ‘occurred metastasis or not', ‘high' referred to ‘high level of miR-646 expression', and ‘low' referred to ‘low level of miR-646 expression'. (E) Inhibition of the expression of miR-646 and overexpression of NOB1promoted the migration of 786-O cells in a wound-healing assay. (F) LNA-anti-miR-646 and pcDNA3.1-NOB1 of 786-O cells exhibited more invasive potential in a transwell chamber invasion assay (*P<0.05; the P value was from a log-rank test).
Figure 6
Figure 6
The effect of miR-646 and NOB1-shRNA treatment on tumour growth in 786-O and ACHN cells and xenograft model. (A and B) Soft agar assay was performed to investigate the effect of miR-646 on tumour growth in vitro. 786-O cells had been infected with miR-646 precursor, control precursor, non-treatment or NOB1-shRNA were plated in wells coated with agar. (C and D) The same assay was performed on ACHN cells. Significant differences between transfected cells and mock-infected cells were determined using the two-tailed Student's t-test (*P<0.05). miR-646 overexpression or NOB1 silencing decreased colony formation. (E) Xenograft model was used to examine the effect of miR-646 on tumorigenesis in vivo. Tumour volume was calculated as width2 × length × 0.5 (mm3) every 5 days. miR-646 overexpression significantly inhibited tumour formation was observed. (F) Vertical bars indicate mean tumour weight at the end of the experiment. *P<0.05 as compared to the control precursor. (G) Tumour volume was evaluated periodically at the indicated days postinoculation. Data represent mean±s.d. of three independent experiments. All error bars indicated s.e.m. (**P<0.01, *P<0.05).
Figure 7
Figure 7
Overexpression of miR-646 transform the three key components of the MAPK pathway. (A) Cell extracts of 786-O and ACHN cells treated with pre-miR-646, NOB1-shRNA, control or nothing were incubated on a Phospho-Kinase Array and phosphorylation status was detected by subsequent incubation with anti-phosphotyrosine horseradish peroxidase. Each protein was spotted in duplicate. (1, positive control; 2, P38; 3, ERK 1/2; 4, JNK). (B and C) In 786-O and ACHN cells, the phosphorylation of all three components of MAPK pathway were significantly increased after miR-646 overexpression or NOB1-shRNA compared to the control. Values are presented as the mean±s.d. of at least three independent experiments performed in triplicate (*P<0.05).
Figure 8
Figure 8
The expression levels of NOB1 in different grade RCC samples. (A and B) The expression of NOB1 protein was detected by western blotting (n=3). Quantity One analysis showed that NOB1 was significantly higher in high-grade RCC samples compared with low-grade RCC (P=0.011) and normal renal samples (P<0.001). (C) Data analysis revealed that NOB1 mRNA was upregulated both high-grade RCC and low-grade RCC tissue samples (P=0.013 and P=0.021, respectively) compared with normal renal tissues by quantitative RT–PCR. (D) RCC patients who lived >2-year survival (21 patients) showed reduced NOB1 mRNA expression, whereas patients who lived <2-year survival (36 patients) showed higher NOB1 mRNA expression in spite of RCC grade (P<0.01). (E) In high-grade RCC group, those who lived >24 months (nine patients) showed NOB1 mRNA expression was downregulation, further those who lived <24 months (21 patients) showed higher NOB1 mRNA expression (P<0.01). (F) In low-grade RCC group, patients lived >24 months (11 patients) showed NOB1 mRNA expression was lower, meanwhile those who lived <24 months (13 patients) showed higher NOB1 mRNA expression (P=0.026). The differences between groups were verified by Mann–Whitney U test. Values are presented as the mean±s.d. of at least three independent experiments performed in triplicate (*P<0.05, **P<0.01).
Figure 9
Figure 9
Immunohistochemical staining of NOB1 in RCC specimens and normal renal tissues. NOB1 immunohistochemical staining was performed on different types of RCCs and normal renal tissues, and representative images are shown. (A and B) H&E staining of RCC tissue (magnification, left × 100, right × 200). (C and D) Immunohistochemical staining of normal renal tissue, staining revealed that no significant staining was observed in normal renal tissues (magnification, left × 200, right × 400), and with the increasing of grade I–IV (EL), renal tissue specimens expressing NOB1 protein. NOB1 staining was stronger in high-grade RCC than that in low-grade RCC.
Figure 10
Figure 10
Abridged general view for the interplay among miR-646, NOB1 and the MAPK pathway in ccRCC. miR-646 as a tumour suppressor by targeting NOB1, which decreased the tumorigenesis of RCC cells in vivo and in vitro through the modulation of the MAPK pathway. Overexpression of miR-646, which suppresses the expression of NOB1, activates the MAPK pathway by increasing the phosphorylation of ERK1/2, JNK and p38 MAPK, which inhibits cell proliferation and induced apoptosis in human ccRCC.

References

    1. Aguda BD. Modeling microRNA-transcription factor networks in cancer. Adv Exp Med Biol. 2013;774:149–167. - PubMed
    1. Ai Q, Ma X, Huang Q, Liu S, Shi T, Zhang C, Zhu M, Zhang Y, Wang B, Ni D, Li H, Zheng T, Zhang X. High-level expression of Notch1 increased the risk of metastasis in T1 stage clear cell renal cell carcinoma. PLoS One. 2012;7:e35022. - PMC - PubMed
    1. Bartel DP. MicroRNAs: genomics, biogenesis, mechanism, and function. Cell. 2004;116:281–297. - PubMed
    1. Cancer Genome Atlas Research Network Comprehensive genomic characterization defines human glioblastoma genes and core pathways. Nature. 2008;455:1061–1068. - PMC - PubMed
    1. Farazi TA, Hoell JI, Morozov P, Tuschl T. MicroRNAs in human cancer. Adv Exp Med Biol. 2013;774:1–20. - PMC - PubMed

Publication types

MeSH terms