. 2014 Aug 15;345(6198):1255903.
doi: 10.1126/science.1255903. Epub 2014 Jul 10.

In utero effects. In utero undernourishment perturbs the adult sperm methylome and intergenerational metabolism

Affiliations

In utero effects. In utero undernourishment perturbs the adult sperm methylome and intergenerational metabolism

Elizabeth J Radford et al. Science. .

Abstract

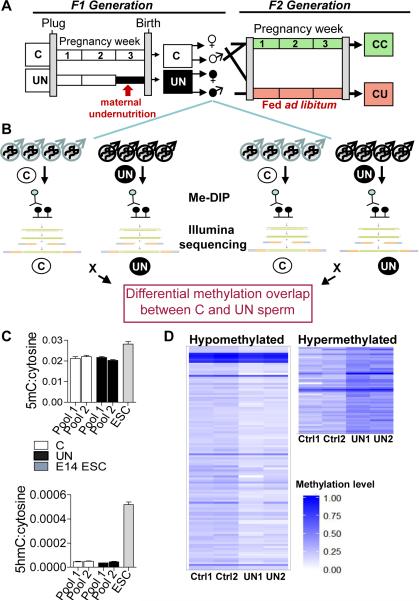
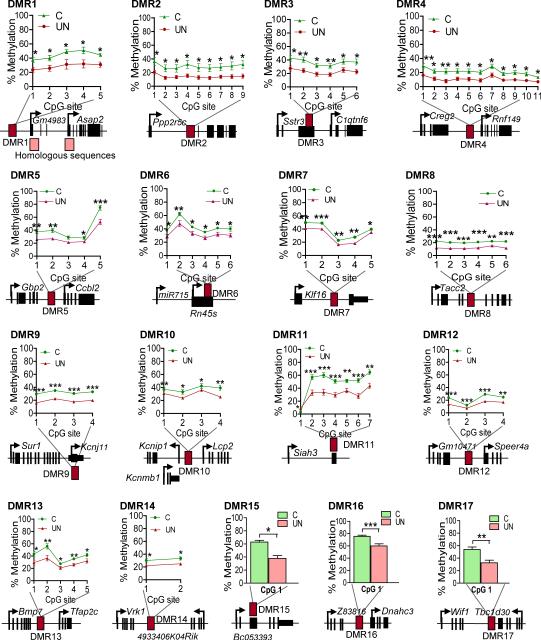
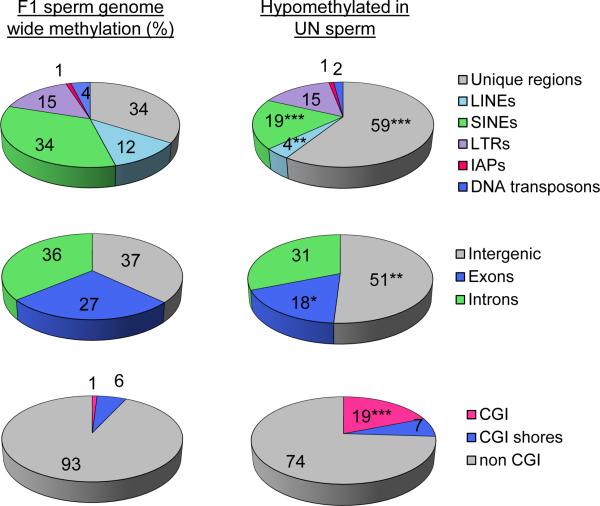
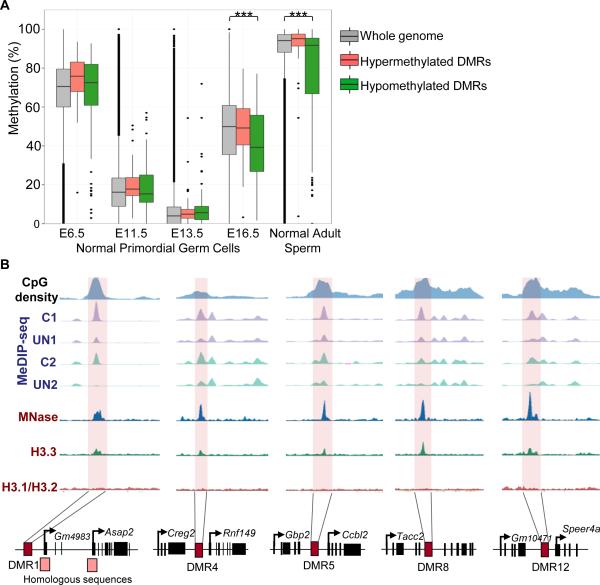
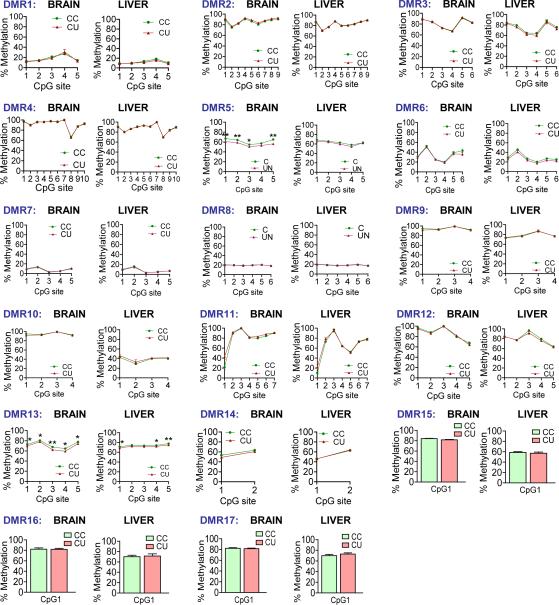
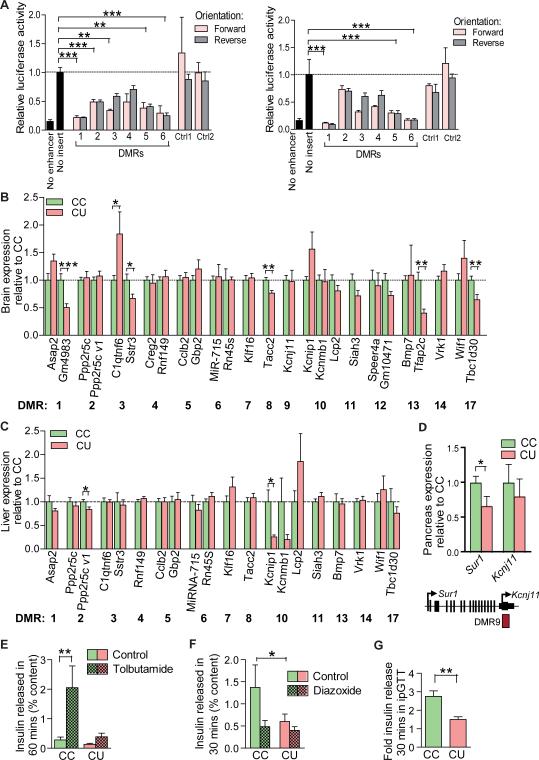
Adverse prenatal environments can promote metabolic disease in offspring and subsequent generations. Animal models and epidemiological data implicate epigenetic inheritance, but the mechanisms remain unknown. In an intergenerational developmental programming model affecting F2 mouse metabolism, we demonstrate that the in utero nutritional environment of F1 embryos alters the germline DNA methylome of F1 adult males in a locus-specific manner. Differentially methylated regions are hypomethylated and enriched in nucleosome-retaining regions. A substantial fraction is resistant to early embryo methylation reprogramming, which may have an impact on F2 development. Differential methylation is not maintained in F2 tissues, yet locus-specific expression is perturbed. Thus, in utero nutritional exposures during critical windows of germ cell development can impact the male germline methylome, associated with metabolic disease in offspring.


Figures

Figure 1
Figure 1. Total methylation is stable in UN sperm, with significant locus specific changes
(A) Experimental design: F1 generation: Dams were randomised on pregnancy day 12.5 to control (C) or undernutrition (UN) groups and UN food intake restricted to 50%. Postnatal litters were equalised to eight pups and animals fed ad libitum. F2 generation: control F1 females mated at age 2 months with non-sibling control or UN males and fed ad libitum to produce: CC - both parents controls; CU - control dam, UN sire. (B) Independent sperm DNA samples were quantified and pooled in equimolar ratios to generate two pools per condition. Control pools: n=8, 5 litters. UN pools: n=8, 4 litters. Following MeDIP-seq two independent C vs UN comparisons identified DMRs where methylation FC >1.5x and binomial p-value <0.0001 in both independent biological replicates. (C) Mass spectrometry quantification of control and UN sperm 5-methyl-cytosine (above) and 5-hydroxymethyl-cytosine (below). E14 ESCs are shown for comparison. (D) Heatmap of 111 hypomethylated DMRs (left) and 55 hypermethylated DMRs (right). Hypermethylated DMRs did not validate.
Figure 2
Figure 2. Bisulphite mutagenesis validation of hypomethylated DMRs in an expanded panel of F1 males’ sperm
17 genomic regions validated (Table 1). Data plotted: mean +/− SEM. (C: n=12, 5 litters; UN: n=11, 4 litters) * P<0.05 ** P<0.01, *** P<0.001 unpaired two-tailed t-test.
Figure 3
Figure 3. DMRs are enriched in intergenic non-repetitive regions and CpG islands
Top: Relative distribution (%) of F1 sperm methylated regions among unique sequence and repetitive elements genome wide (left) and among the F1 UN sperm hypomethylated DMRs (right). Unique regions are significantly enriched (χ2 P<0.0001) while LINEs and SINEs are significantly depleted from hypomethylated DMRs (χ2 P=0.001; χ2 P<0.0001 respectively), relative to all methylated regions detected in F1 sperm. Middle: Relative distribution (%) of methylated regions among coding and non-coding sequence. Exons are significantly depleted (χ2 P=0.036), and intergenic regions significantly enriched (χ2 P=0.0012) among hypomethylated DMRs. Bottom: Relative distribution (%) of methylated regions detected by MeDIP-seq among CpG islands (CGI) and CGI shores. CGIs are significantly enriched among hypomethylated DMRs (χ2 P<0.0001).
Figure 4
Figure 4. DMRs regain methylation late during PGC reprogramming and retain nucleosomes in mature sperm
A) Methylation level of hypomethylated (green) and hypermethylated (red) DMRs in our data set versus the whole genome (grey) in normal PGCs (25) and mature sperm from adult males (26). Hypermethylated DMRs act as an additional negative control since they did not validate. E13.5 and E16.5 are male PGCs. E6.5 and E11.5: mixed sex PGCs (25). B) Nucleosome enrichment (27) at 5 representative hypomethylated DMRs.
Figure 5
Figure 5. Analysis of methylation at F1 sperm DMRs in F2 brain and liver at E16.5
F2 E16.5 CC and CU brain and liver methylation of F1 sperm previously validated hypomethylated DMRs, measured by bisulphite pyrosequencing. Data presented as mean +/− SEM. Brain per condition n = 16, ≥ 3 litters; Liver per condition n = 12, 3 litters.
Figure 6
Figure 6. Developmental legacy of altered UN sperm methylation in the F2 generation
(A) Luciferase assay for a negative effect on transcription in 46C neural stem cells (29) (left) and NIH3T3 cells (right). Sequences were inserted between the promoter and enhancer of the Control pGL3 vector. The pGL3 Promoter vector (lacking an enhancer) was used as a positive control. Two regions validated by pyrosequencing as having unaffected F1 sperm methylation were used as negative controls. Control 1: MMU2:77723600–77723900, Control 2: MMU17:87639700-87640000. Data are plotted as mean +/− SEM, normalised to activity of the Control pGL3 vector with no insert. One way ANOVA, Dunnett's post-test **P<0.001, ***P<0.0001. (B) F2 E16.5 brain expression of genes neighbouring F1 sperm DMRs. Data plotted as mean +/− SEM. MiR-715 expression normalised to SnoRNA 202, all other expression normalised to Hprt. Hprt and SnoRNA202 were unaffected. Unpaired two-tailed t-test: Gmf4983 P=0.0004, C1qtnf6 P=0.049, Sstr3 P=0.02, Tacc2 P=0.0018, Tfap2c P=0.015, Tbc1d30 P=0.006. Per condition n=16, ≥3 litters. (C) F2 E16.5 liver expression of genes neighbouring F1 sperm DMRs. Data plotted as mean +/− SEM. Normalised as for (B). Unpaired two-tailed t-test: Ppp2r5c variant1 P=0.03, Kcnip1 P=0.011. Per condition n=12, 3 litters. (D) F2 Pancreatic expression at 4 months. Per condition n ≥ 5 * P<0.05, unpaired two-tailed t-test (3). (E) Tolbutamide (200μM) stimulated insulin secretion, freshly isolated 4 month old islets; n≥4, ≥ 2 isolations. **P<0.01, unpaired two-tailed t-test. (3) (F) Diazoxide (250μM) inhibition of insulin secretion, freshly isolated 4 month old islets; n=4 per group, ≥ 2 isolations. *P<0.05, unpaired two tailed t-test. (3). (G) Fold change in serum insulin 30 minutes following intraperitoneal glucose bolus (1mg/kg). **P<0.01, n≥8, unpaired two-tailed t-test. (3).

Comment in

References

    1. Gluckman PD, Hanson MA, Cooper C, Thornburg KL. Effect of in utero and early-life conditions on adult health and disease. N Engl J Med. 2008;359:61–73. - PMC - PubMed
    1. Drake AJ, Walker BR. The intergenerational effects of fetal programming: non-genomic mechanisms for the inheritance of low birth weight and cardiovascular risk. J Endocrinol. 2004;180:1–16. - PubMed
    1. Jimenez-Chillaron JC, Isganaitis E, Charalambous M, Gesta S, Pentinat-Pelegrin T, Faucette RR, Otis JP, Chow A, Diaz R, Ferguson-Smith A, Patti ME. Intergenerational transmission of glucose intolerance and obesity by in utero undernutrition in mice. Diabetes. 2009;58:460–468. - PMC - PubMed
    1. Carone BR, Fauquier L, Habib N, Shea JM, Hart CE, Li R, Bock C, Li C, Gu H, Zamore PD, Meissner A, Weng Z, Hofmann HA, Friedman N, Rando OJ. Paternally induced transgenerational environmental reprogramming of metabolic gene expression in mammals. Cell. 2010;143:1084–1096. - PMC - PubMed
    1. Ng SF, Lin RC, Laybutt DR, Barres R, Owens JA, Morris MJ. Chronic high-fat diet in fathers programs beta-cell dysfunction in female rat offspring. Nature. 2010;467:963–966. - PubMed

Publication types

Associated data