. 2014 Dec;25(12):2752-63.
doi: 10.1681/ASN.2013091030. Epub 2014 Jul 10.

Renal angiotensin-converting enzyme is essential for the hypertension induced by nitric oxide synthesis inhibition

Affiliations

Renal angiotensin-converting enzyme is essential for the hypertension induced by nitric oxide synthesis inhibition

Jorge F Giani et al. J Am Soc Nephrol. 2014 Dec.

Abstract

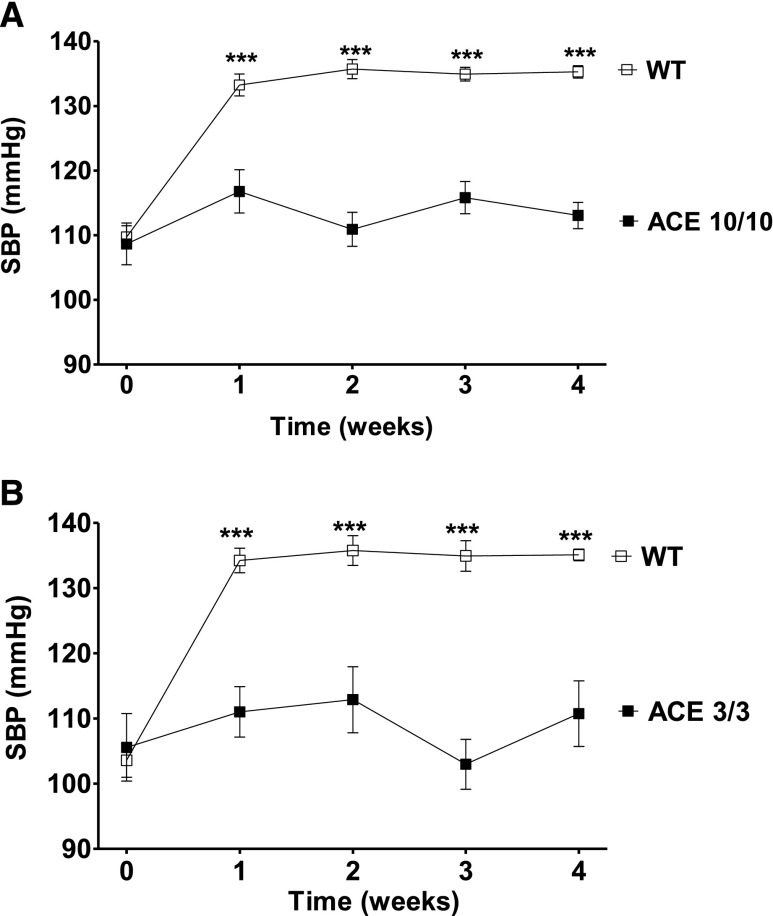
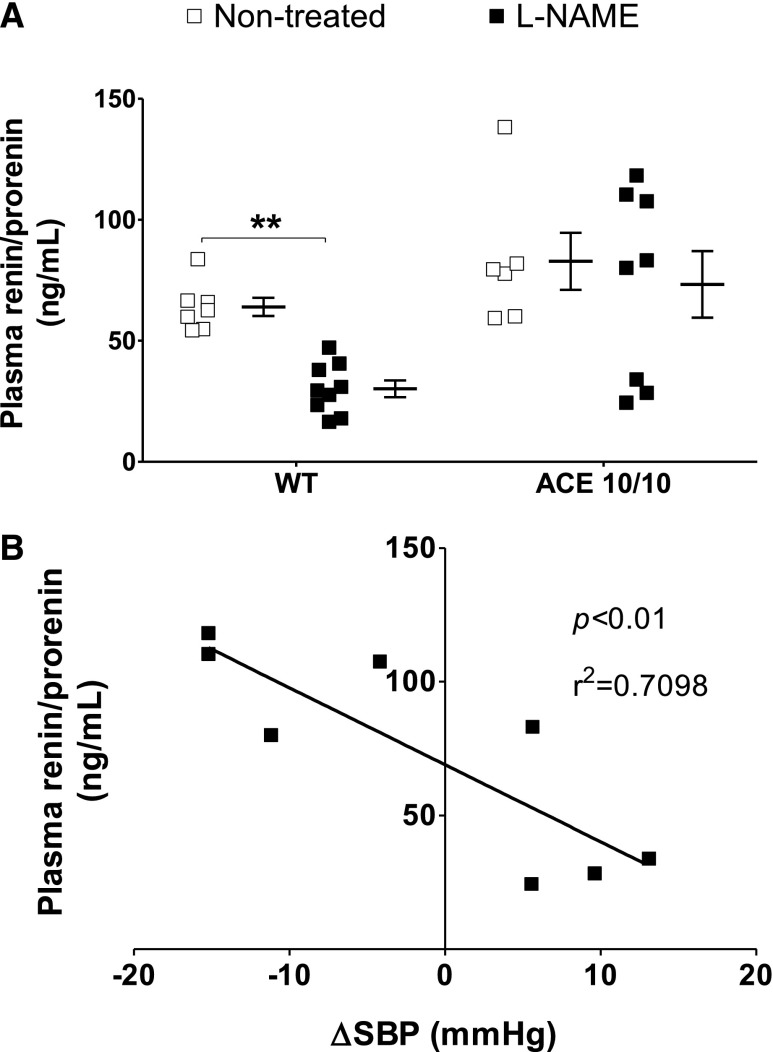
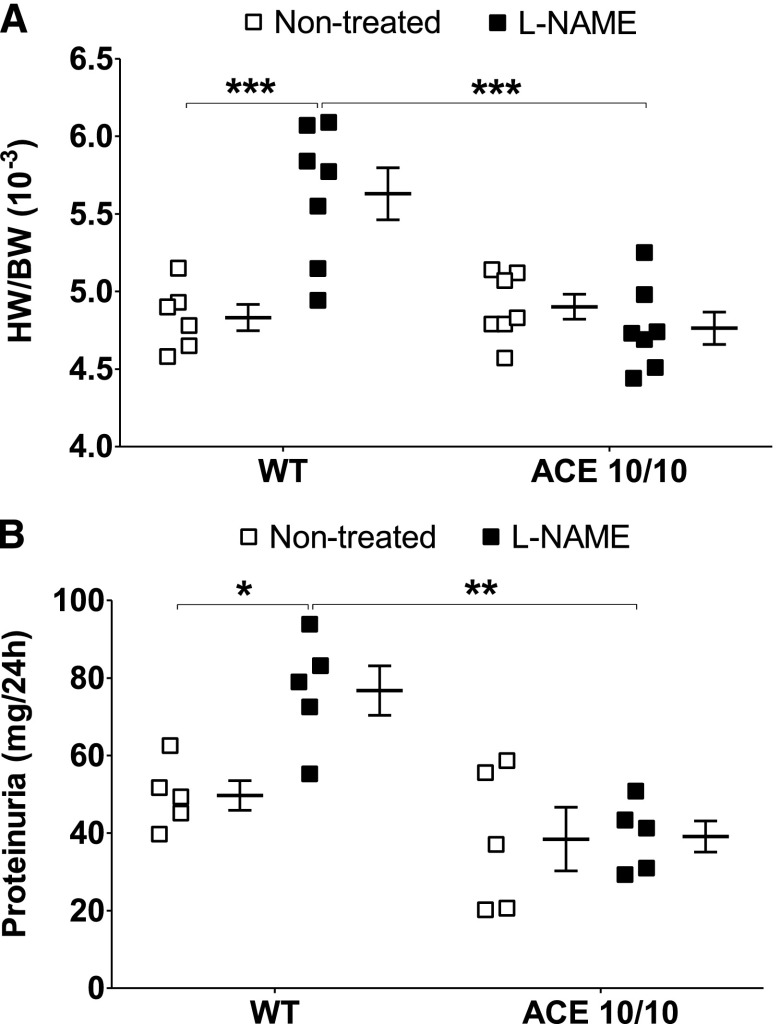
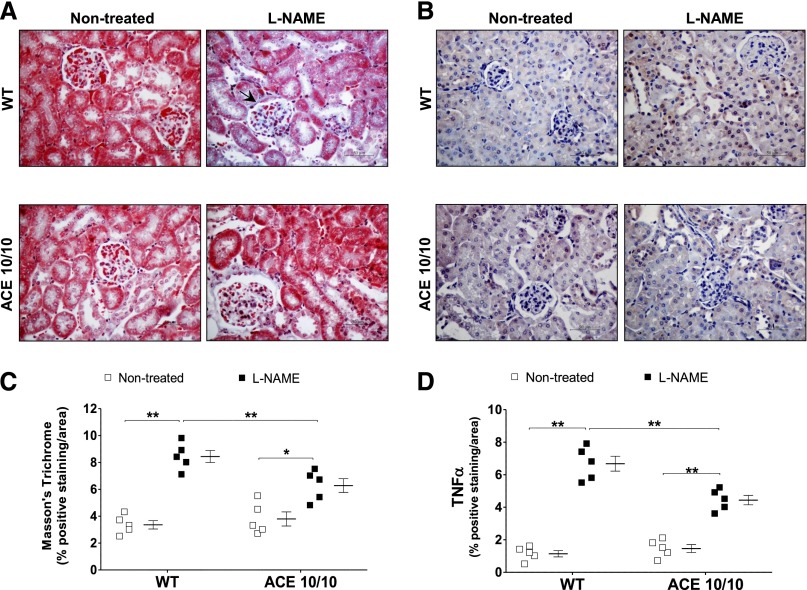
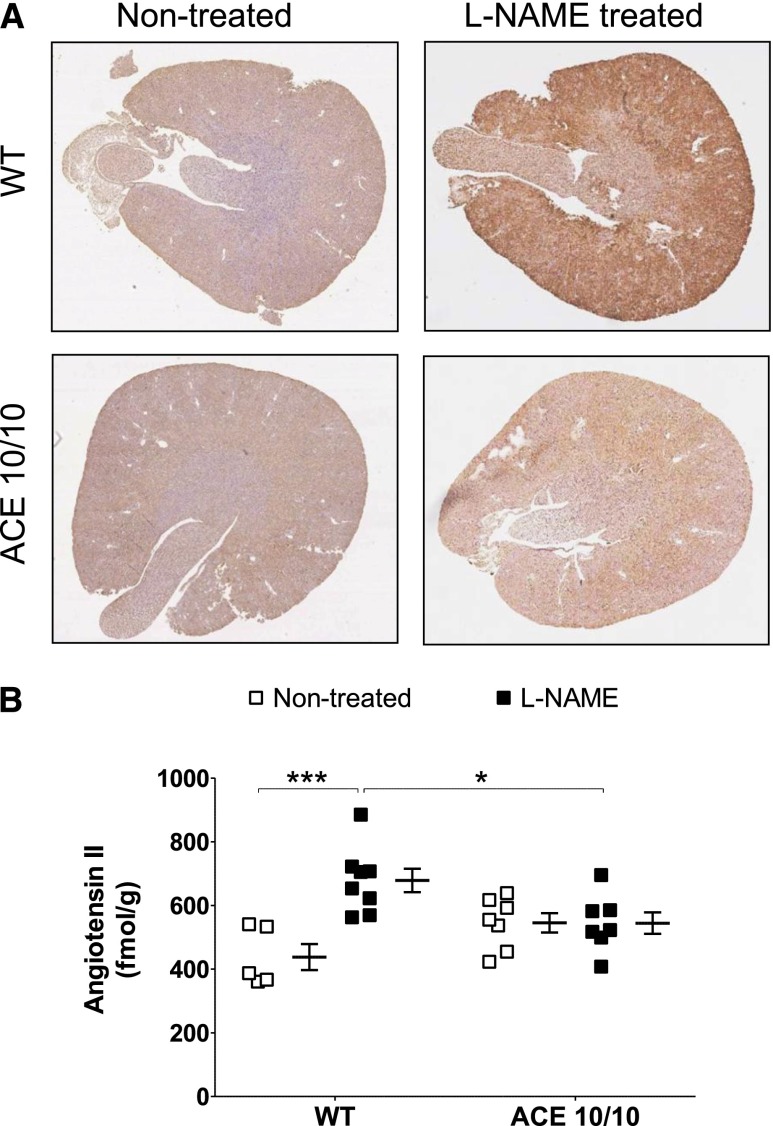
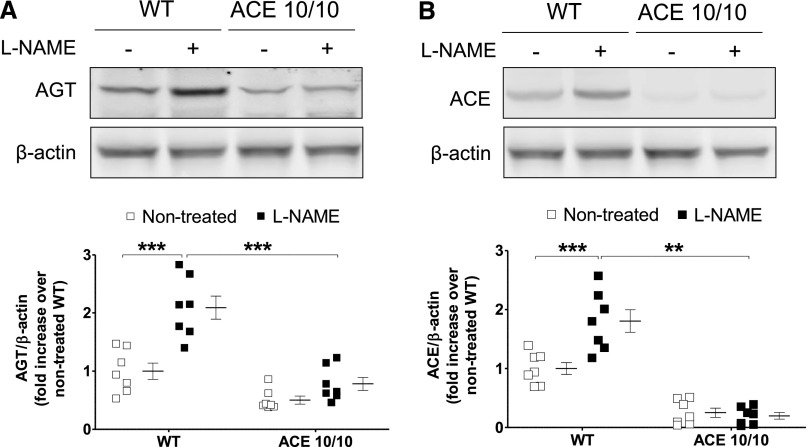
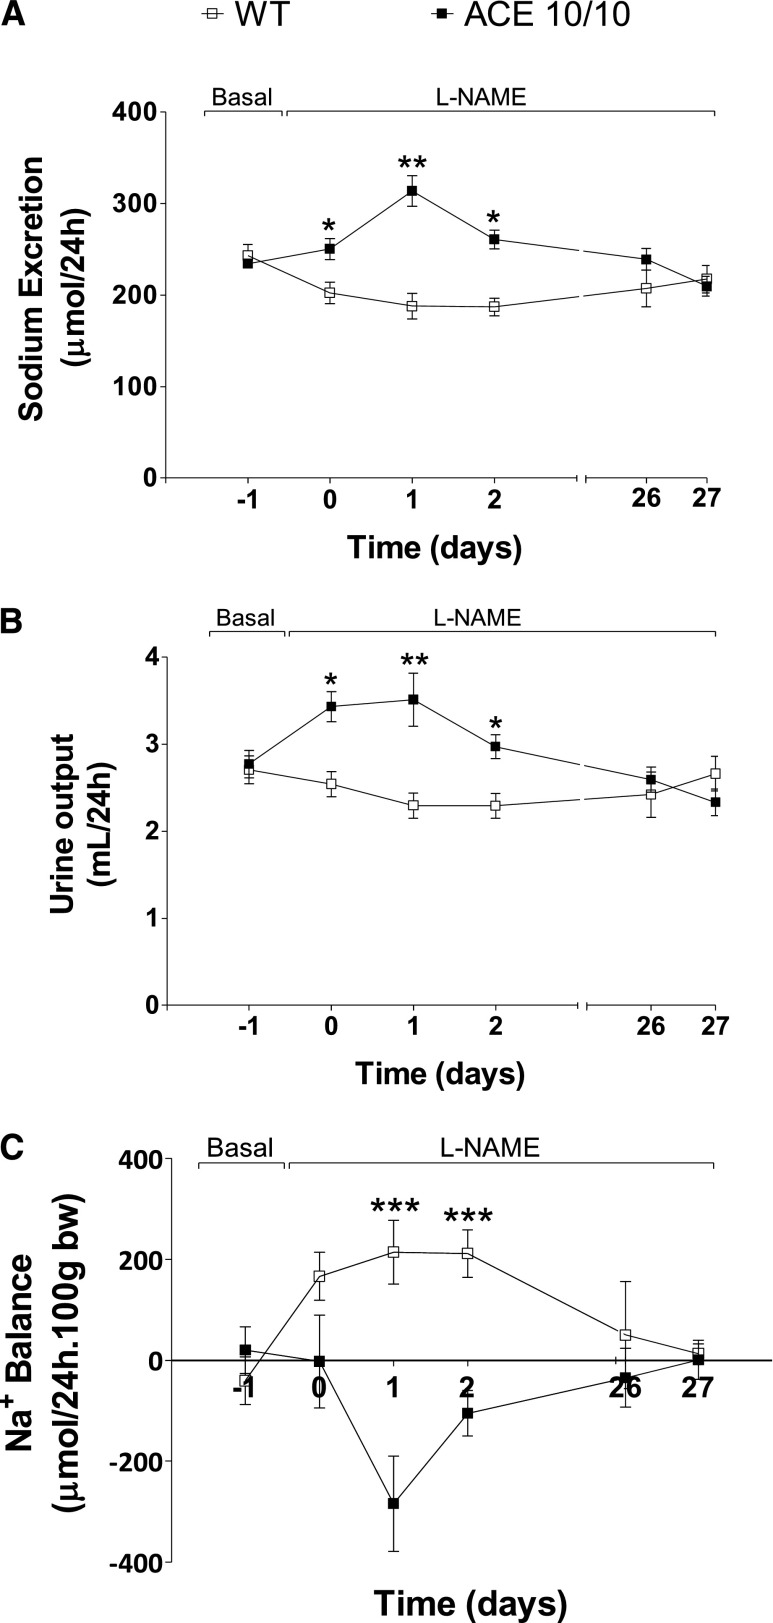
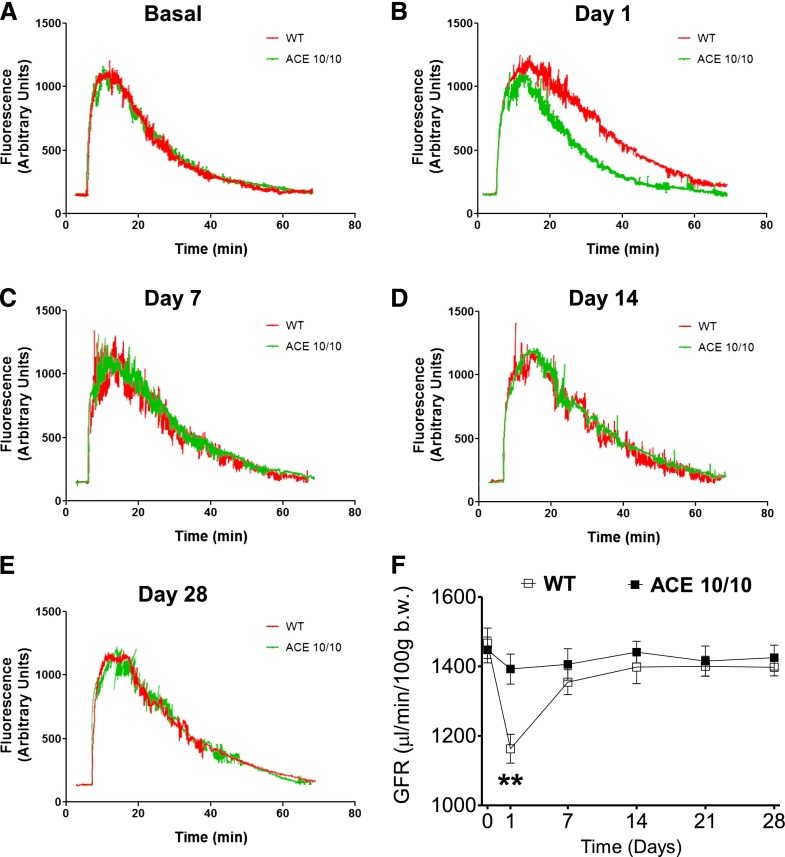
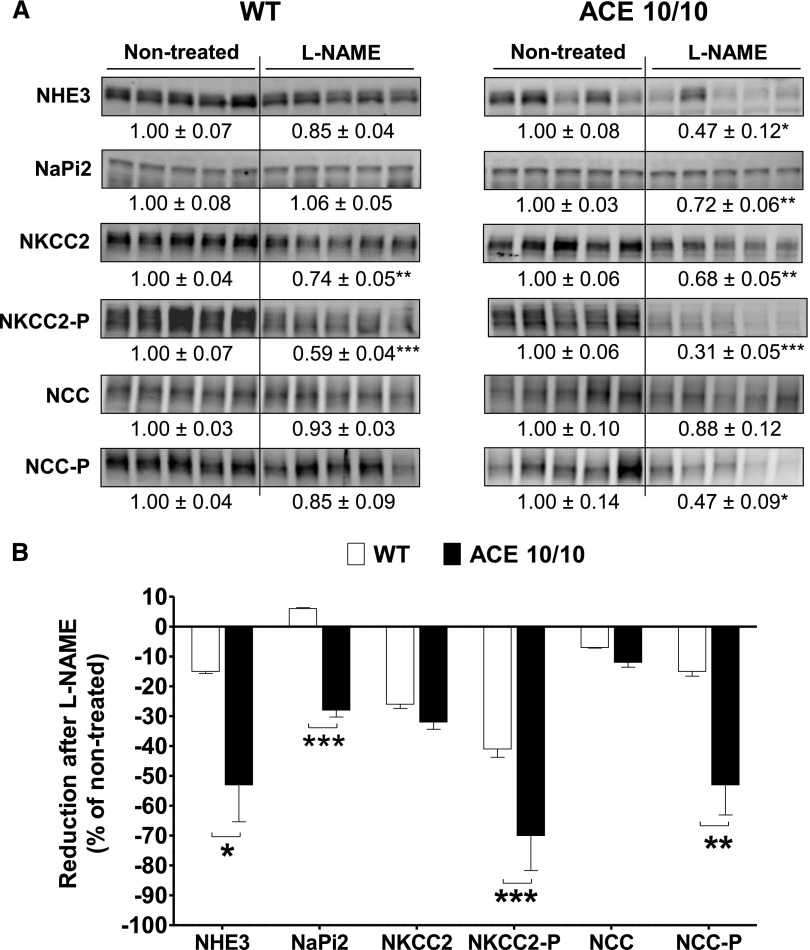
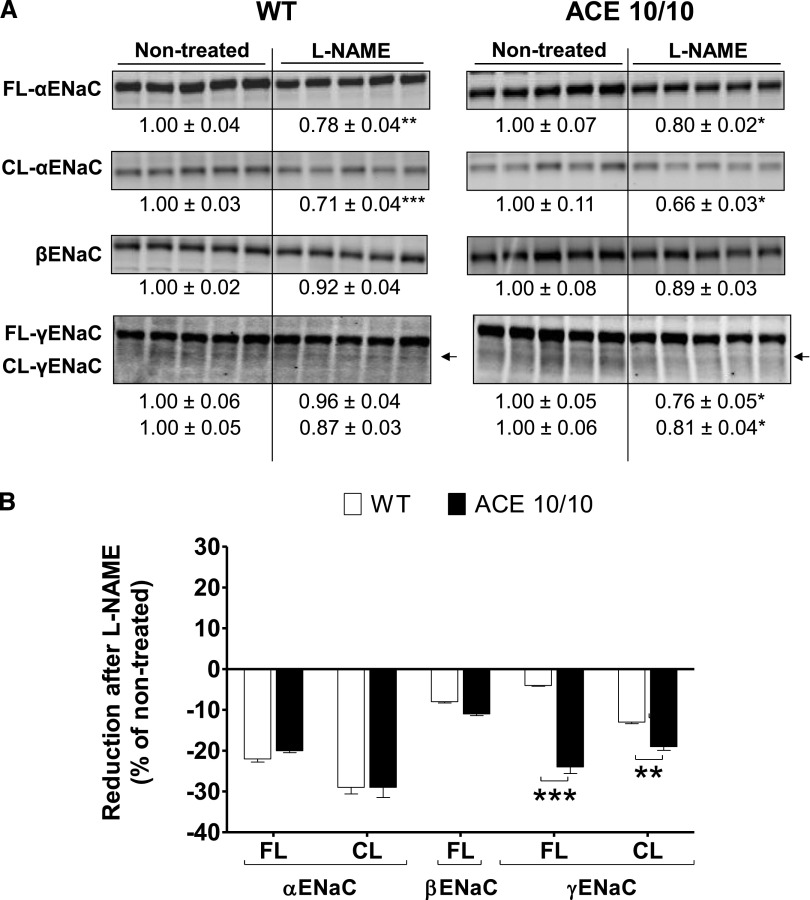
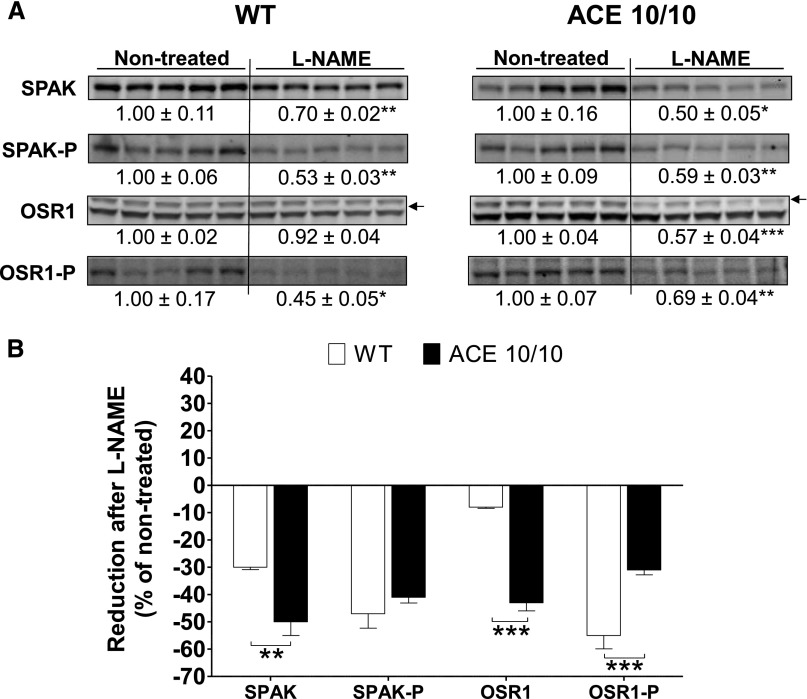
The kidney is an important source of angiotensin-converting enzyme (ACE) in many species, including humans. However, the specific effects of local ACE on renal function and, by extension, BP control are not completely understood. We previously showed that mice lacking renal ACE, are resistant to the hypertension induced by angiotensin II infusion. Here, we examined the responses of these mice to the low-systemic angiotensin II hypertensive model of nitric oxide synthesis inhibition with L-NAME. In contrast to wild-type mice, mice without renal ACE did not develop hypertension, had lower renal angiotensin II levels, and enhanced natriuresis in response to L-NAME. During L-NAME treatment, the absence of renal ACE was associated with blunted GFR responses; greater reductions in abundance of proximal tubule Na(+)/H(+) exchanger 3, Na(+)/Pi co-transporter 2, phosphorylated Na(+)/K(+)/Cl(-) cotransporter, and phosphorylated Na(+)/Cl(-) cotransporter; and greater reductions in abundance and processing of the γ isoform of the epithelial Na(+) channel. In summary, the presence of ACE in renal tissue facilitates angiotensin II accumulation, GFR reductions, and changes in the expression levels and post-translational modification of sodium transporters that are obligatory for sodium retention and hypertension in response to nitric oxide synthesis inhibition.

Keywords: ACE; L-NAME; hypertension; kidney; mice.


Figures

Figure 1.
Figure 1.
The absence of renal ACE blunts L-NAME–induced hypertension. The systolic BP (SBP) response to L-NAME (5 mg/10 ml in the drinking water) of ACE 10/10 (A), ACE 3/3 (B), and corresponding wild-type (WT) mice was determined by tail-cuff plethysmography. n=6–17. ***P<0.001 versus wild-type mice by two-way ANOVA. Values represent mean±SEM.
Figure 2.
Figure 2.
L-NAME reduces plasma renin/prorenin concentration in wild-type (WT) but not in ACE 10/10 mice. (A) Circulating renin/prorenin levels were measured after L-NAME treatment (5 mg/10 ml in the drinking water for 4 weeks) by ELISA. Data are presented as individual values and mean±SEM. (B) Negative correlation between systolic BP increase (ΔSBP) and plasma prorenin/renin in ACE 10/10 mice. n=6–9. **P<0.01.
Figure 3.
Figure 3.
L-NAME induces heart enlargement (A) and proteinuria (B) in wild-type (WT) mice but not in ACE 10/10 mice. Heart weight/body weight (HW/BW) was calculated after L-NAME treatment (5 mg/10 ml in the drinking water for 4 weeks). Urinary protein excretion was assessed in the same group of mice before and after L-NAME. n=5–7. *P<0.05; **P<0.01; *** P<0.001. Values represent individual values and mean±SEM.
Figure 4.
Figure 4.
L-NAME induces more renal fibrosis and TNF-α accumulation in wild-type (WT) than in ACE 10/10 mice. Renal sections from nontreated and L-NAME–treated (5 mg/10 ml in the drinking water for 4 weeks) WT and ACE 10/10 mice were stained for collagen accumulation (A, with Masson's trichrome) and TNF-α content (B). Original magnification, X400 in A and B. (C and D) Semiquantification. n=5. *P<0.05; **P<0.01. Data are presented as individual values and mean±SEM.
Figure 5.
Figure 5.
The absence of renal ACE prevents renal angiotensin II accumulation during L-NAME–induced hypertension. (A) Representative whole-kidney sections from nontreated and L-NAME–treated (5 mg/10 ml in the drinking water for 4 weeks) wild-type (WT) and ACE 10/10 mice were stained for angiotensin II. Brown staining indicates angiotensin II–positive areas. Original magnification, X30 in A. (B) Angiotensin II quantification by radioimmunoassay in kidney homogenates. n=6–8. *P<0.05; ***P<0.001. Data are presented as individual values and mean±SEM. Both assays were performed with the same antibody.
Figure 6.
Figure 6.
Renal angiotensinogen (A) and ACE (B) abundances increase during L-NAME–induced hypertension in wild-type (WT) mice but not in ACE 10/10 mice. Target proteins were analyzed by Western blot in total kidney homogenates of nontreated and L-NAME–treated (5 mg/10 ml in the drinking water for 4 weeks) WT and ACE 10/10 mice. AGT, angiotensinogen. n=5–7. **P<0.01; ***P<0.001. Data are presented as individual values and mean±SEM.
Figure 7.
Figure 7.
The absence of renal ACE is associated with enhanced 24-hour sodium (A) and urine output (B) and negative sodium balance (C) in response to L-NAME. Wild-type (WT) and ACE 10/10 mice were housed individually in metabolic cages with free access to food and water before and during L-NAME treatment (5 mg/10 ml in the drinking water for 4 weeks). n=8–10. *P<0.05; **P<0.01; ***P<0.001. Values represent mean±SEM of daily averages.
Figure 8.
Figure 8.
L-NAME treatment induces acute GFR reductions in wild-type mice (WT) but not in the ACE 10/10 mice. (A–E) Excretion kinetics of FITC-sinistrin of WT and ACE 10/10 mice before and during L-NAME–induced hypertension (5 mg/10 ml in the drinking water for 4 weeks). Only one representative curve per group is presented. (F) Group GFR estimations based on elimination half-life of a single intravenous bolus of FITC-sinistrin. Fluorescent signal was detected with a miniaturized device attached to the back of conscious mice. n=8. **P<0.01 versus ACE 10/10 mice. Values represent mean±SEM.
Figure 9.
Figure 9.
The absence of renal ACE amplifies reductions in abundance and/or phosphorylation of NHE3, NaPi2, NKCC2, and NCC observed during L-NAME–induced hypertension. (A) Transporter expression was analyzed in whole renal homogenates from nontreated and L-NAME–treated (5 mg/10 ml in the drinking water for 4 weeks) wild-type (WT) and ACE 10/10 mice. Immunoblots were performed with a constant amount of protein per lane. Relative abundance from each group is displayed below corresponding blot as mean±SEM. n=6–8 per group. *P<0.05; **P<0.01; ***P<0.001 versus corresponding nontreated mice. (B) Bars represent the relative reduction versus nontreated mice (set as 0). *P<0.05; **P<0.01; ***P<0.001.
Figure 10.
Figure 10.
The absence of renal ACE amplifies reductions in abundance and processing of γ-ENaC during L-NAME–induced hypertension. (A) The expression of α, β and γ-subunits of ENaC were analyzed in whole renal homogenates from nontreated and L-NAME–treated (5 mg/10 ml in the drinking water for 4 weeks) wild-type (WT) and ACE 10/10 mice. Immunoblots were performed with a constant amount of protein per lane. Relative abundance from each group is displayed below corresponding blot as mean±SEM. n=5 per group. *P<0.05; **P<0.01; ***P<0.001 versus corresponding nontreated mice. (B) Bars represent the relative reduction versus nontreated mice (set as 0) of full-length (FL), cleaved (CL) ENaC subunits. **P<0.01; ***P<0.001.
Figure 11.
Figure 11.
The absence of renal ACE amplifies reductions in SPAK and OSR1 protein abundance during L-NAME–induced hypertension. (A) Renal sodium transporter profiling: transporter expression was analyzed in whole renal homogenates from nontreated and L-NAME–treated (5 mg/10 ml in the drinking water for 4 weeks) wild-type (WT) and ACE 10/10 mice. Immunoblots were performed with a constant amount of protein per lane. Relative abundance from each group is displayed below corresponding blot as mean±SEM. n=5 per group. *P<0.05; **P<0.01; ***P<0.001 versus corresponding nontreated mice. (B) Bars represent the relative reduction versus nontreated mice (set as 0). **P<0.01; ***P<0.001.

Comment in

Similar articles

Cited by

References

    1. Ng KK, Vane JR: Conversion of angiotensin I to angiotensin II. Nature 216: 762–766, 1967 - PubMed
    1. Atlas SA: The renin-angiotensin aldosterone system: pathophysiological role and pharmacologic inhibition. J Manag Care Pharm 13[Suppl B]: 9–20, 2007 - PMC - PubMed
    1. Alderman MH, Cohen HW, Sealey JE, Laragh JH: Plasma renin activity levels in hypertensive persons: Their wide range and lack of suppression in diabetic and in most elderly patients. Am J Hypertens 17: 1–7, 2004 - PubMed
    1. van den Meiracker AH, Man in ’t Veld AJ, Admiraal PJ, Ritsema van Eck HJ, Boomsma F, Derkx FH, Schalekamp MA: Partial escape of angiotensin converting enzyme (ACE) inhibition during prolonged ACE inhibitor treatment: Does it exist and does it affect the antihypertensive response? J Hypertens 10: 803–812, 1992 - PubMed
    1. Nussberger J, Brunner DB, Waeber B, Brunner HR: Plasma angiotensins under sustained converting enzyme inhibition with enalapril in normal humans. J Hypertens Suppl 3: S269–S270, 1985 - PubMed

Publication types

MeSH terms