. 2015 Feb;26(2):364-78.
doi: 10.1681/ASN.2013070703. Epub 2014 Jul 10.

Stanniocalcin-1 inhibits renal ischemia/reperfusion injury via an AMP-activated protein kinase-dependent pathway

Affiliations

Stanniocalcin-1 inhibits renal ischemia/reperfusion injury via an AMP-activated protein kinase-dependent pathway

Jenny Szu-Chin Pan et al. J Am Soc Nephrol. 2015 Feb.

Abstract

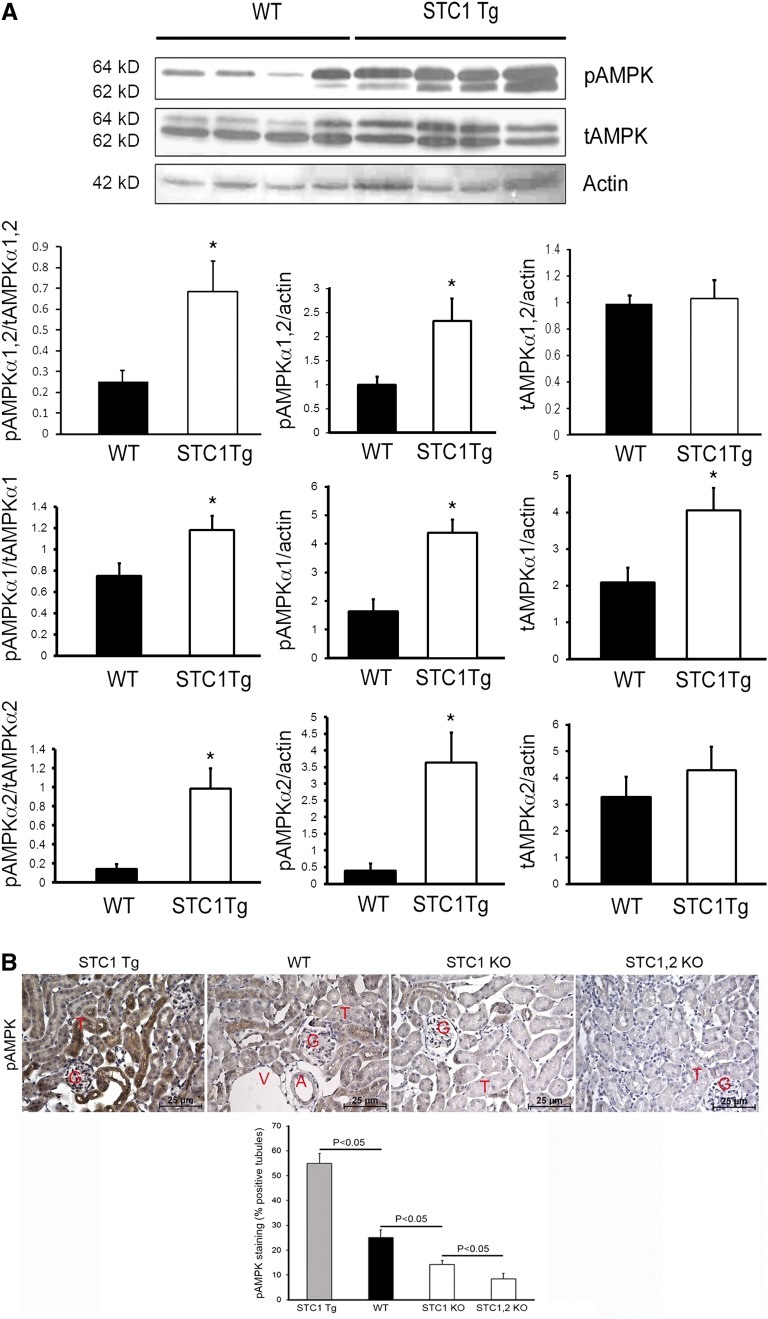
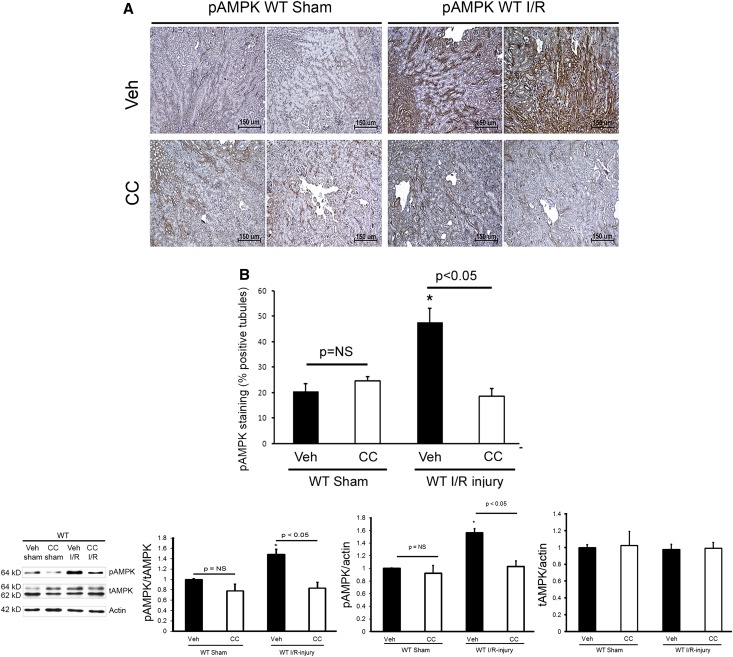
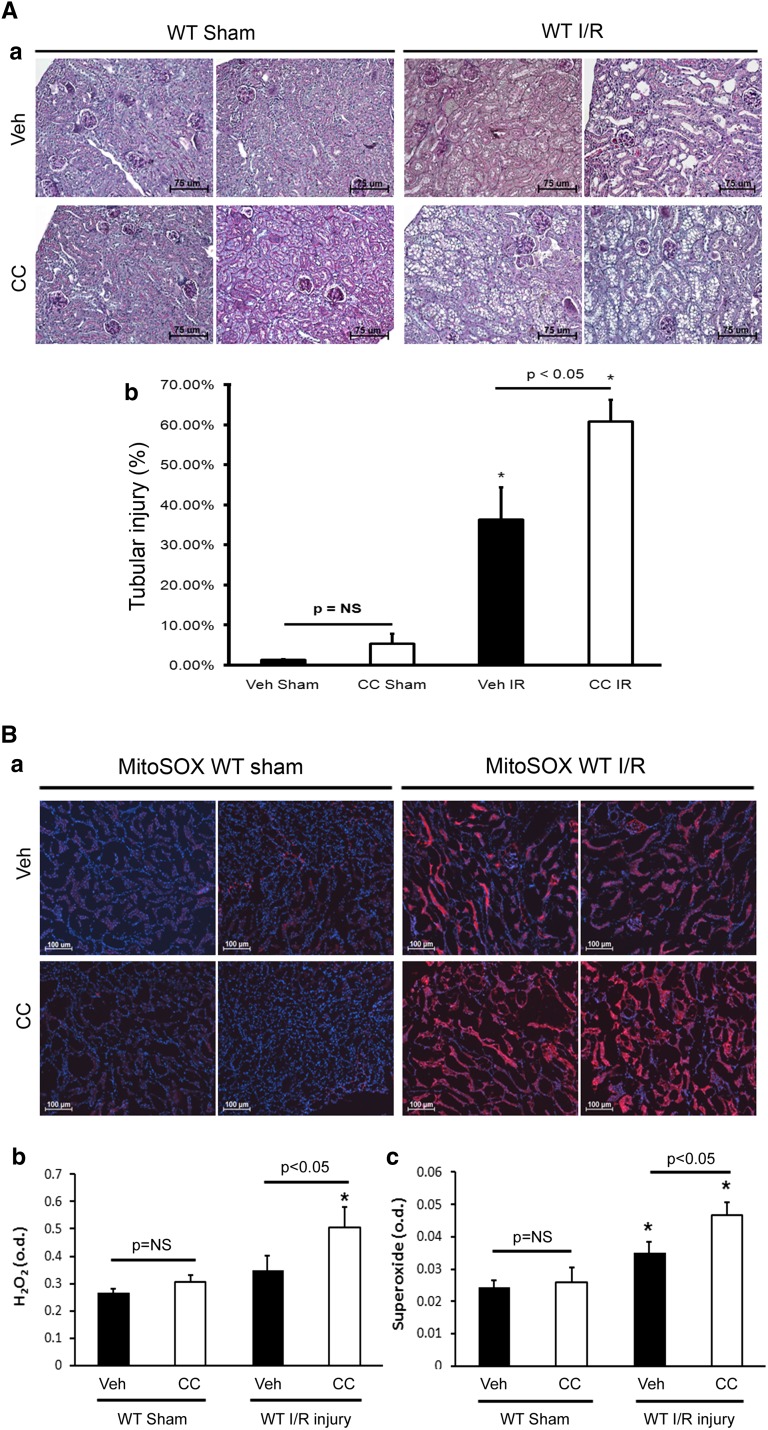
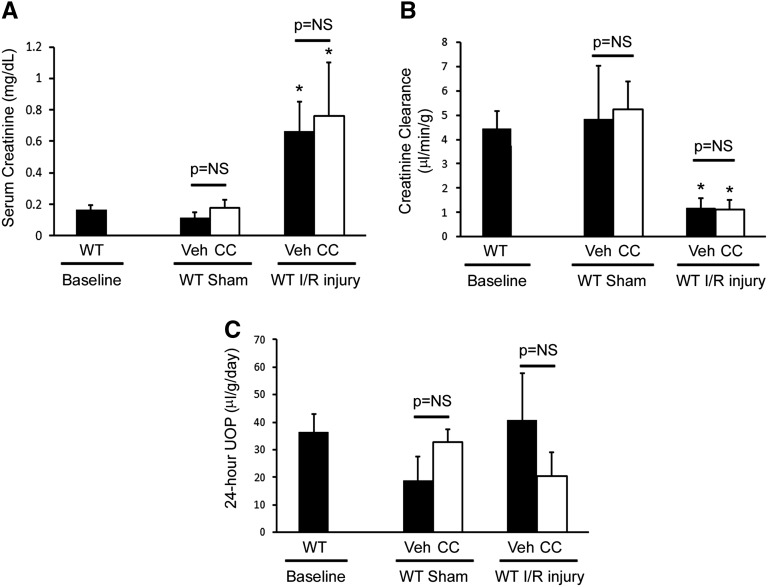
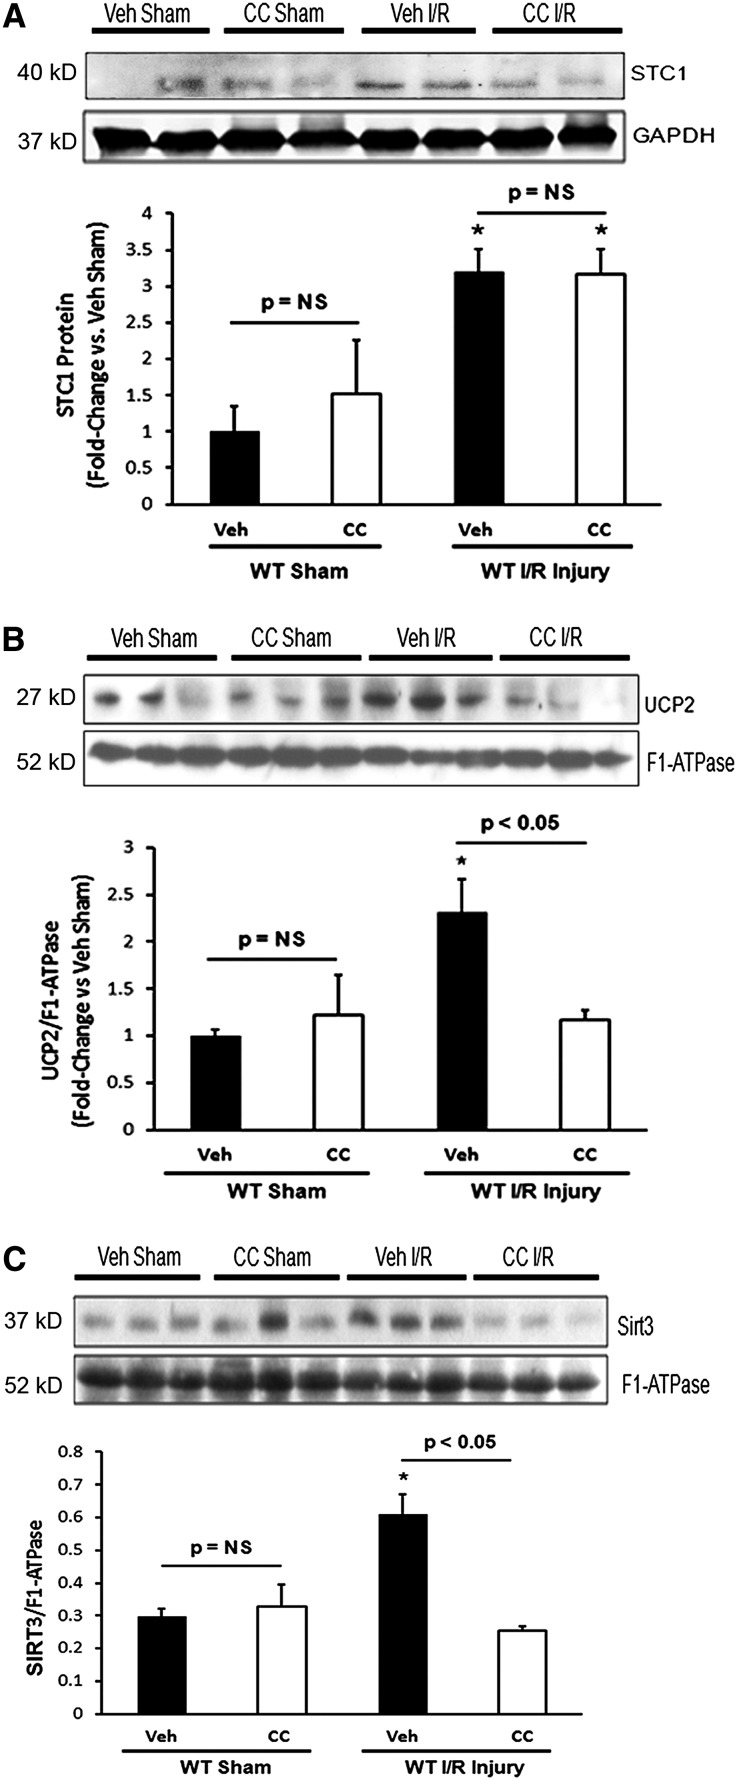
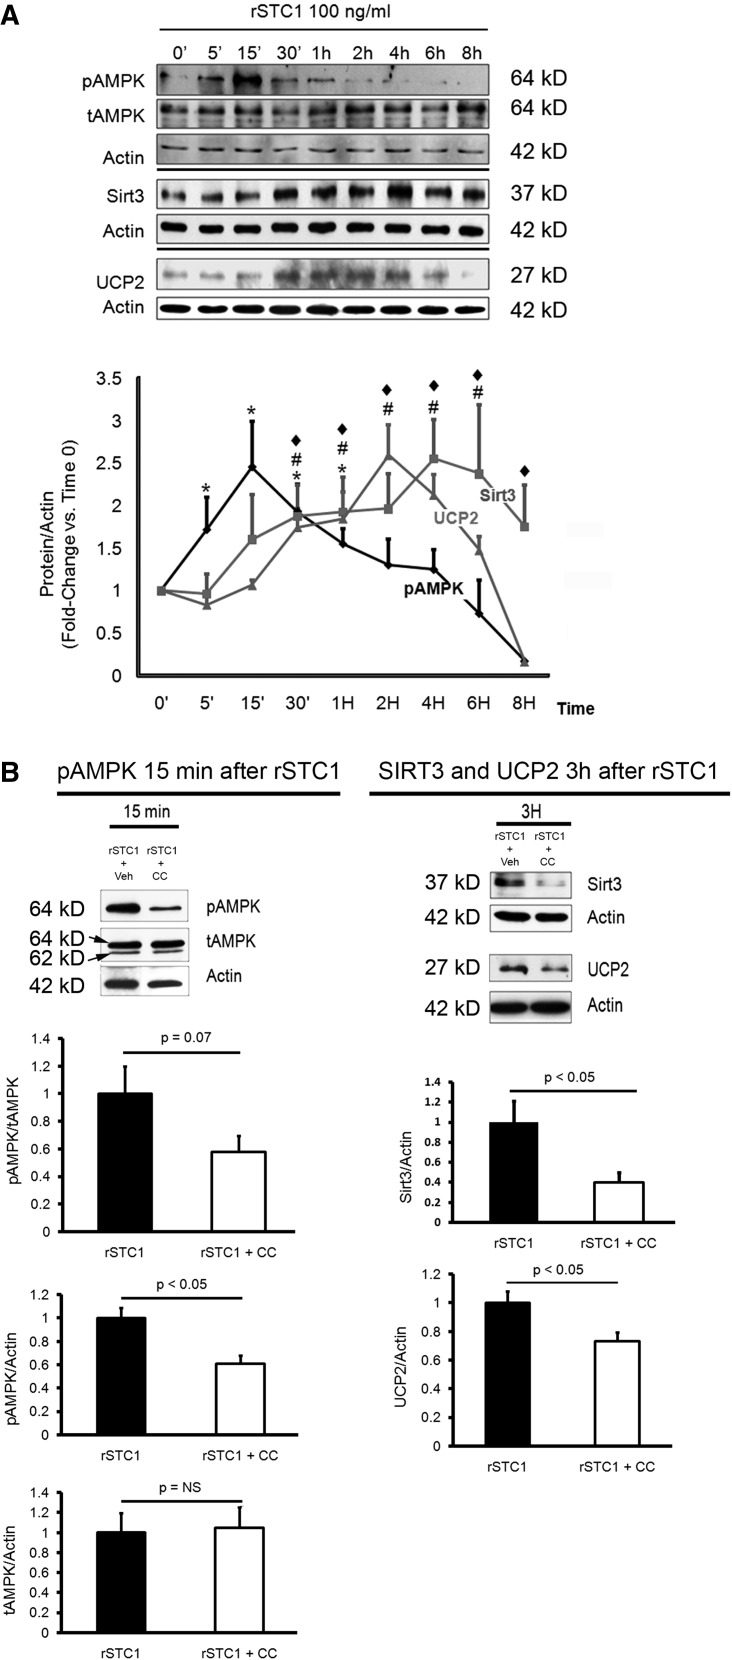
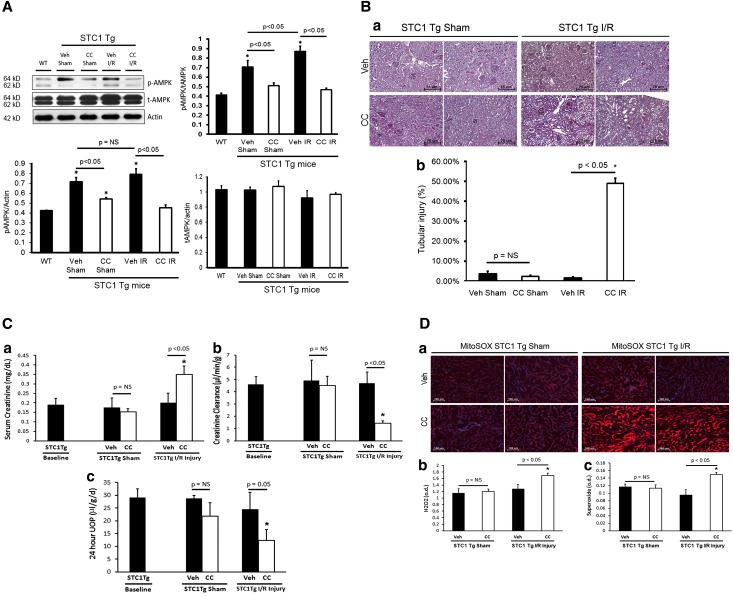
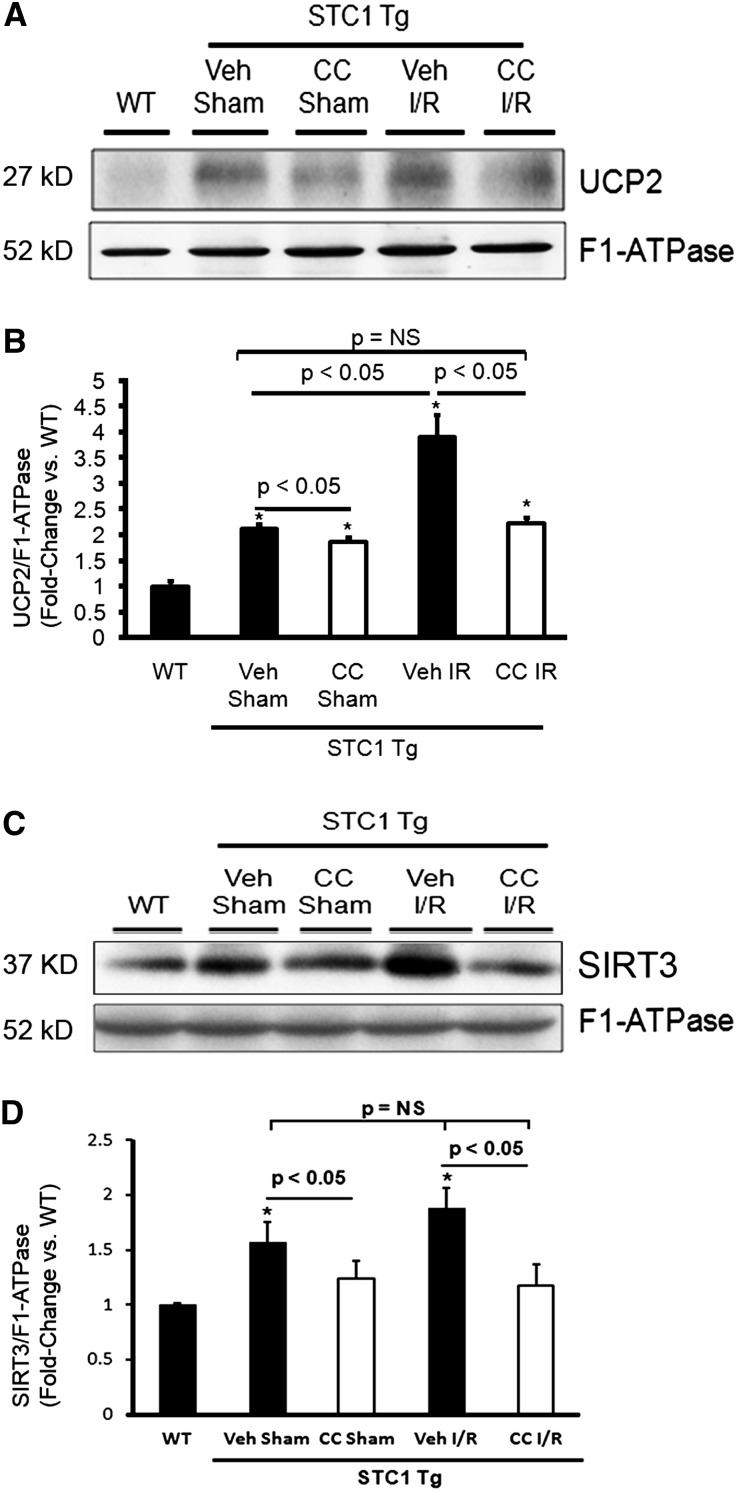
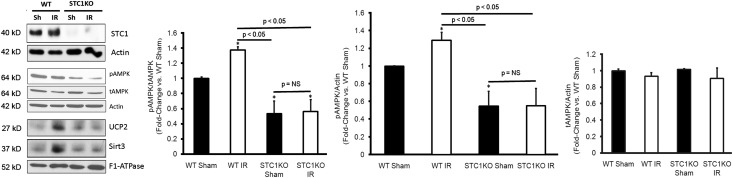
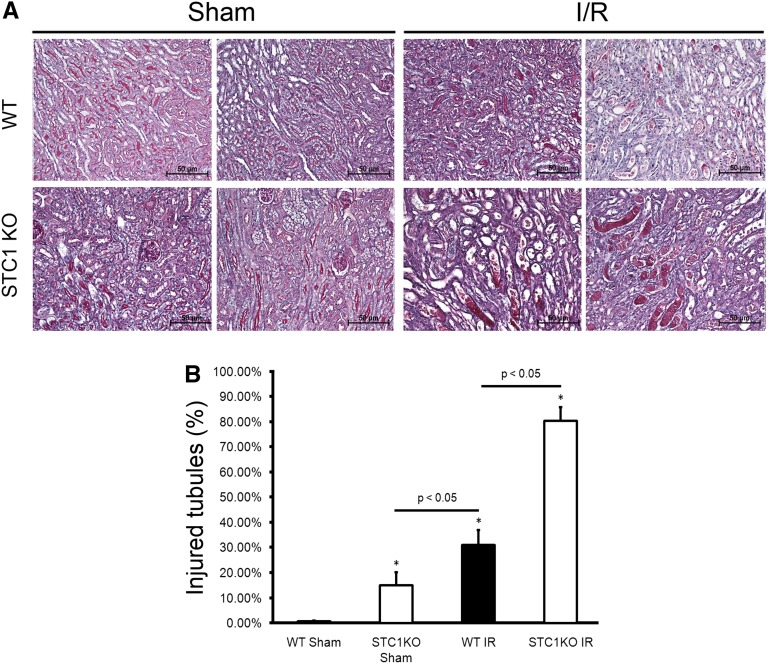
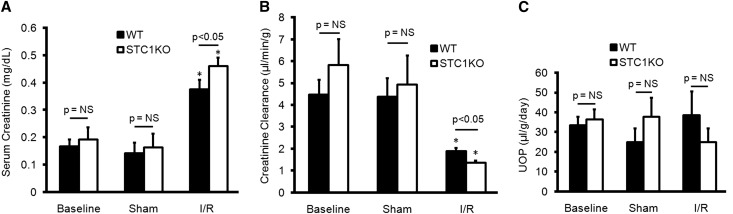
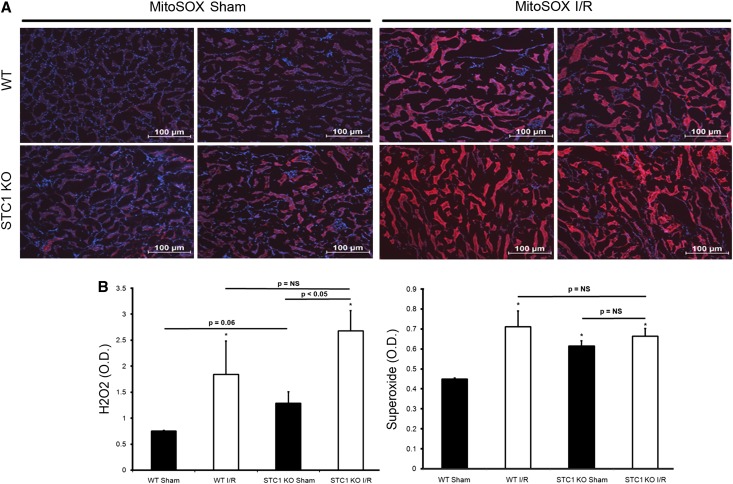
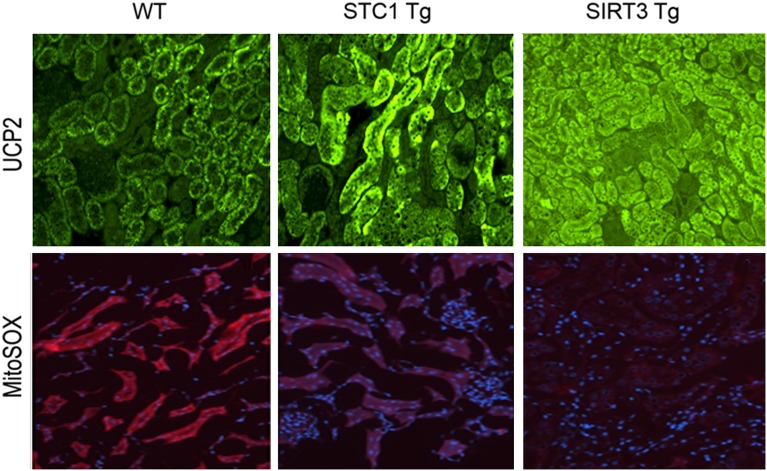
AKI is associated with increased morbidity, mortality, and cost of care, and therapeutic options remain limited. Reactive oxygen species are critical for the genesis of ischemic AKI. Stanniocalcin-1 (STC1) suppresses superoxide generation through induction of uncoupling proteins (UCPs), and transgenic overexpression of STC1 inhibits reactive oxygen species and protects from ischemia/reperfusion (I/R) kidney injury. Our observations revealed high AMP-activated protein kinase (AMPK) activity in STC1 transgenic kidneys relative to wild-type (WT) kidneys; thus, we hypothesized that STC1 protects from I/R kidney injury through activation of AMPK. Baseline activity of AMPK in the kidney correlated with the expression of STCs, such that the highest activity was observed in STC1 transgenic mice followed (in decreasing order) by WT, STC1 knockout, and STC1/STC2 double-knockout mice. I/R in WT kidneys increased AMPK activity and the expression of STC1, UCP2, and sirtuin 3. Inhibition of AMPK by administration of compound C before I/R abolished the activation of AMPK, diminished the expression of UCP2 and sirtuin 3, and aggravated kidney injury but did not affect STC1 expression. Treatment of cultured HEK cells with recombinant STC1 activated AMPK and increased the expression of UCP2 and sirtuin 3, and concomitant treatment with compound C abolished these responses. STC1 knockout mice displayed high susceptibility to I/R, whereas pretreatment of STC1 transgenic mice with compound C restored the susceptibility to I/R kidney injury. These data suggest that STC1 is important for activation of AMPK in the kidney, which mediates STC1-induced expression of UCP2 and sirtuin 3 and protection from I/R.

Keywords: ischemia-reperfusion; mitochondria; protection; reactive oxygen species; renal; renal injury; renal morphology.


Figures

Figure 1.
Figure 1.
STC1 regulates AMPK activity in the kidney. (A) Increased AMPK activity in STC1 Tg kidneys. Lysates from WT and STC1 Tg kidneys were resolved on SDS-PAGE, and blots reacted consecutively with antibodies that recognize pAMPKα1,α2, AMPKα1,α2, or actin. Representative Western blot is shown; bar graphs represent the mean±SEM of n=7 mice/group and depict the ratio of indicated proteins in WT and STC1 Tg mice. *P<0.05 versus WT. tAMPK, total AMPK. (B) Baseline activity of AMPK in the kidney correlates with STCs. Representative immunohistochemistry staining of kidney sections is shown from STC1 Tg, WT, STC1 KO, and STC1/STC2 double-KO mice using anti-pAMPKα1,α2. Bar graph represents quantification of pAMPKα1,α2 staining from four mice for each group, and data are presented as mean±SEM. A, arterioles; G, glomeruli; T, tubules; V, venules.
Figure 2.
Figure 2.
Treatment with CC blocks I/R injury-induced activation of AMPK in WT mice. (A) Immunohistochemistry of kidney sections using anti-pAMPKα1,α2. Representative images from two mice per group are shown. (B) Bar graph represents quantification of pAMPKα1,α2 staining. Data represent the mean±SEM from four mice for each group. (C) Total kidney lysates from vehicle sham, CC sham, vehicle I/R, or CC I/R mice were resolved on SDS-PAGE, and Western blots were reacted with anti-pAMPKα1,α2, anti-AMPKα1,α2, and anti-actin; representative Western blots are shown. Bar graphs depict the ratio of pAMPKα1,α2/total AMPKα1,α2, pAMPKα1,α2/actin, and total AMPKα1,α2/actin. Data represent the mean±SEM from four mice for each group. tAMPK, total AMPK; Veh, vehicle. *P<0.05 versus vehicle sham.
Figure 3.
Figure 3.
Inhibition of AMPK exacerbates I/R kidney injury in WT mice. (A, a) Periodic acid–Schiff staining of kidney sections for morphology showed severe cellular vacuolization (predominantly in the cortex) 72 hours after I/R in WT mice pretreated with CC. Representative images from two mice per group are shown. (A, b) Bar graph represents quantification of tubular injury and depicts the mean±SEM of the percentage of tubules with cellular vacuolization, dilation, and/or cast formation (n=4 mice/group). (B) AMPK inhibition in WT mice subjected to I/R kidney injury increases H2O2 and superoxide production. (B, a) WT mice were treated with CC or vehicle before I/R or sham surgery, and superoxide (MitoSOX red fluorescence) was measured in tubular epithelial cells 72 hours after I/R or sham surgery. Representative images from two mice per group are shown; blue fluorescence corresponds to 4′,6-diamidino-2-phenylindole. Bar graphs show (B, b) H2O2 and (B, c) superoxide 72 hours after I/R or sham surgery; data represent mean±SEM from four mice per group. Veh, vehicle. *P<0.05 versus vehicle sham.
Figure 4.
Figure 4.
AMPK inhibition in WT mice exacerbates kidney injury post-I/R. (A) Serum creatinine, (B) CrCl normalized to weight, and (C) timed urine output were carried out as detailed in Concise Methods. Bar graphs depict the mean±SEM (n=9 mice for WT baseline; n=3 mice for CC sham; n=4 mice/group for Veh sham, Veh I/R, or CC I/R). UOP, urine output; Veh, vehicle. *P<0.05 versus WT baseline.
Figure 5.
Figure 5.
Inhibition of AMPK in WT mice blocks I/R-induced expression of SIRT3 and UCP2. (A) Total kidney lysates were obtained 72 hours after I/R. Western blots were reacted with anti-STC1 and anti-GAPDH; bar graph shows mean±SEM of n=3 mice for vehicle sham and n=4 mice for all other groups. Kidney mitochondrial lysates were obtained 72 hours after I/R; Western blots were reacted with (B) anti-UCP2, (C) anti-SIRT3, and (B and C) anti–F1-ATPase. Bar graphs show the mean±SEM from four mice per group. GAPDH, glyceraldehyde-3-phosphate dehydrogenase; Veh, vehicle. *P<0.05 versus vehicle sham.
Figure 6.
Figure 6.
STC1 increases SIRT3 and UCP2 expression in vitro via AMPK. (A) STC1 activates AMPK and increases the expression of SIRT3 and UCP2 in vitro. Cultured HEK cells were treated with rSTC1 for different time points. Western blots were reacted with anti-pAMPKα1,α2, anti-AMPKα1,α2, anti-actin, anti-SIRT3, and anti-UCP2. The graph represents the mean±SEM of three independent experiments depicting densitometry values of pAMPKα1,α2, SIRT3, or UCP2 normalized to actin. P<0.05 versus time 0 minutes (0’) for #SIRT3, UCP2, and *pAMPK. (B) STC1-induced increase in SIRT3 and UCP2 expression is AMPK-dependent. On the basis of the time courses for activation of AMPK and induction of SIRT3 and UCP2 (shown in A), cultured HEK cells were treated with rSTC1 plus vehicle or rSTC1 and CC for the specified time points. Western blots were reacted with anti-pAMPKα1,α2, anti-AMPKα1,α2, anti-actin, anti-SIRT3, and anti-UCP2. AMPK activity (pAMPK) was sampled 15 minutes after treatment with rSTC1, whereas the expressions of SIRT3 and UCP2 were sampled 3 hours after treatment with rSTC1. Graphs represent the mean±SEM of three independent experiments. tAMPK, total AMPK; Veh, vehicle.
Figure 7.
Figure 7.
AMPK inhibition in STC1 Tg mice restores susceptibility to I/R kidney injury. (A) Treatment with CC blocks activation of AMPK in STC1 Tg mice. Total kidney lysates of WT (control) and STC1 Tg mice treated with vehicle sham, CC sham, vehicle I/R, or CC I/R were resolved on SDS-PAGE, and Western blots were reacted with anti-pAMPKα1,α2, anti-AMPKα1,α2, and anti-actin. Bar graphs represent the mean±SEM of data obtained from four mice per group. *P<0.05 versus WT. (B) STC1 Tg mice were pretreated with CC or vehicle, subjected to I/R or sham, and euthanized 72 hours later. (B, a) In CC-pretreated STC1 Tg mice, periodic acid–Schiff staining of kidney sections for morphology showed severe kidney injury after I/R characterized by cellular vacuolization, tubular dilation, and cast formation (predominantly in the cortex). Representative images from two mice per group are shown. (B, b) Bar graph represents quantification of tubular injury and depicts the mean±SEM of the percentage of tubules with cellular vacuolization, dilation, and/or cast formation; n=4 mice/group for vehicle or CC sham, and n=5 mice/group for vehicle or CC I/R. *P<0.05 versus vehicle sham. (C) Inhibition of AMPK in STC1 Tg results in severe kidney injury after I/R. STC1 Tg mice were pretreated with CC or vehicle and subjected to I/R or sham surgery and serum creatinine (C, a), CrCl was normalized to weight (C, b), and timed urine output (C, c) were carried out as detailed in Concise Methods. Bar graphs depict the mean±SEM (n=9 mice for baseline in STC1 Tg; n=4 mice/group for vehicle or CC sham; n=5 mice/group for vehicle or CC I/R). *P<0.05 versus STC1 Tg baseline. (D) Inhibition of AMPK in STC1 Tg mice increases H2O2 and superoxide after I/R. (D, a) STC1 Tg mice were treated with CC or vehicle before I/R or sham surgery, and superoxide (MitoSOX red fluorescence) was measured in tubular epithelial cells 72 hours after I/R or sham surgery. Representative images from two mice per group are shown; blue fluorescence corresponds to 4′,6-diamidino-2-phenylindole. Bar graphs show (D, b) H2O2 and (D, c) superoxide 72 hours post-I/R or sham surgery; data represent mean±SEM (n=4 mice/group for vehicle or CC sham; n=5 mice/group for vehicle or CC I/R). UOP, urine output; tAMPK, total AMPK; Veh, vehicle. *P<0.05 versus vehicle sham.
Figure 8.
Figure 8.
Inhibition of AMPK in STC1 Tg mice attenuates UCP2 and SIRT3 expression. Kidney mitochondrial lysates were obtained 72 hours after I/R or sham surgery; Western blots were reacted with (A) anti-UCP2, (C) anti-SIRT3, or (A and C) anti–F1-ATPase. Bar graphs depict the ratios of (B) UCP2/F1-ATPase and (D) SIRT3/F1-ATPase normalized to WT control. Data represent the mean±SEM from four mice per group. Veh, vehicle.*P<0.05 versus WT.
Figure 9.
Figure 9.
Low AMPK activity and diminished expression of UCP2 and SIRT3 in STC1 KO kidneys. Total kidney lysates were obtained 72 hours after I/R or sham surgery; Western blots were reacted with anti-STC1, anti-pAMPKα1,α2, anti-AMPKα1,α2, and anti-actin. Kidney mitochondrial lysates were obtained 72 hours after I/R or sham surgery; Western blots were reacted with anti-UCP2, anti-SIRT3, and anti–F1-ATPase. Bar graphs represent the mean±SEM of data obtained from three mice per group. Sh, sham; tAMPK, total AMPK. *P<0.05 versus WT sham.
Figure 10.
Figure 10.
STC1 KO mice display severe histologic injury post-I/R. STC1 KO and WT mice were subjected to I/R or sham surgery and euthanized 72 hours later. (A) Periodic acid–Schiff staining of kidney sections for morphology showed greater injury in sham-treated STC1 KO mice compared with WT mice, and after I/R, STC1 KO mice displayed severe kidney injury characterized by diffuse cellular vacuolization, marked tubular dilation, and cast formation involving the cortex and corticomedullary junction. Representative images from two mice per group are shown. (B) Bar graph represents quantification of tubular injury and depicts the mean±SEM of the percentage of tubules with cellular vacuolization, dilation, and/or cast formation (n=3 mice/group). *P<0.05 versus WT sham.
Figure 11.
Figure 11.
STC1 KO mice display increased susceptibility to I/R kidney injury. (A) STC1 KO or WT mice were subjected to I/R or sham surgery and serum creatinine, (B) CrCl was normalized to weight, and (C) timed urine output was carried out as detailed in Concise Methods. UOP, urine output. Bar graphs depict the mean±SEM from three mice per group. *P<0.05 versus WT baseline.
Figure 12.
Figure 12.
STC1 KO mice display increased H2O2 and superoxide levels after I/R. (A) WT or STC1 KO mice were subjected to I/R or sham surgery, and superoxide (MitoSOX red fluorescence) was measured in tubular epithelial cells 72 hours after I/R or sham surgery. Representative images from two mice per group are shown; blue fluorescence corresponds to 4′,6-diamidino-2-phenylindole. (B) Bar graphs show H2O2 and superoxide 72 hours post-I/R or sham surgery; data represent mean±SEM from three mice per group. *P<0.05 versus WT sham.
Figure 13.
Figure 13.
Increased expression of UCP2 in tubular epithelium of STC1 Tg or SIRT3 Tg kidneys correlates with decreased superoxide generation. (Upper panel) Kidney sections from WT, STC1 Tg, and SIRT3 Tg mice were reacted with anti-UCP2 followed by FITC-labeled secondary antibody. Representative immunofluorescence images show higher-level UCP2 in tubular epithelial cells of STC1 Tg and SIRT3 Tg kidneys. (Lower panel) Decreased superoxide (MitoSOX red fluorescence) in tubular epithelial cells of STC1 Tg and SIRT3 Tg kidneys corresponding to higher levels of UCP2 expression; blue fluorescence corresponds to 4′,6-diamidino-2-phenylindole.

References

    1. Chertow GM, Burdick E, Honour M, Bonventre JV, Bates DW: Acute kidney injury, mortality, length of stay, and costs in hospitalized patients. J Am Soc Nephrol 16: 3365–3370, 2005 - PubMed
    1. Carpenter CB: Long-term failure of renal transplants: Adding insult to injury. Kidney Int Suppl 50: S40–S44, 1995 - PubMed
    1. Park KM, Byun JY, Kramers C, Kim JI, Huang PL, Bonventre JV: Inducible nitric-oxide synthase is an important contributor to prolonged protective effects of ischemic preconditioning in the mouse kidney. J Biol Chem 278: 27256–27266, 2003 - PubMed
    1. Gueler F, Gwinner W, Schwarz A, Haller H: Long-term effects of acute ischemia and reperfusion injury. Kidney Int 66: 523–527, 2004 - PubMed
    1. Halloran PF, Homik J, Goes N, Lui SL, Urmson J, Ramassar V, Cockfield SM: The “injury response”: A concept linking nonspecific injury, acute rejection, and long-term transplant outcomes. Transplant Proc 29: 79–81, 1997 - PubMed

Publication types

MeSH terms