

Plasma metabonomics study on Chinese medicine syndrome evolution of heart failure rats caused by LAD ligation
- PMID: 25012233
- PMCID: PMC4227006
- DOI: 10.1186/1472-6882-14-232
Plasma metabonomics study on Chinese medicine syndrome evolution of heart failure rats caused by LAD ligation
Abstract
Background: Chinese medicine syndromes (Zheng) in many disease models are not clearly characterized or validated, and the concepts of Chinese medicine syndromes are confounding and controversial. Metabonomics has been applied to the evaluation and classification of the Chinese medicine syndromes both in clinical and nonclinical studies. In this study, we aim to investigate the evolution of the Chinese medicine syndrome in myocardial infarction induced heart failure and to confirm the feasibility of the Zheng classification by plasma metabonomics in a syndrome and disease combination animal model.
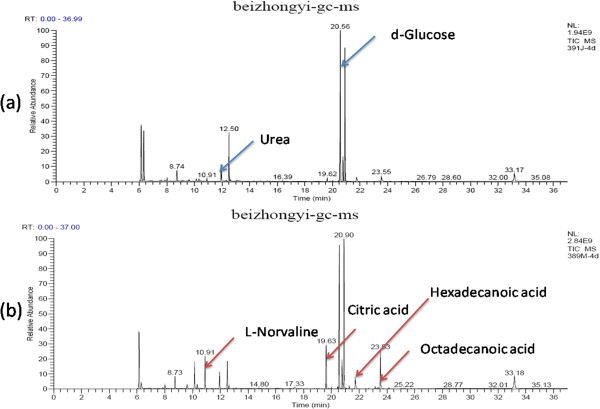
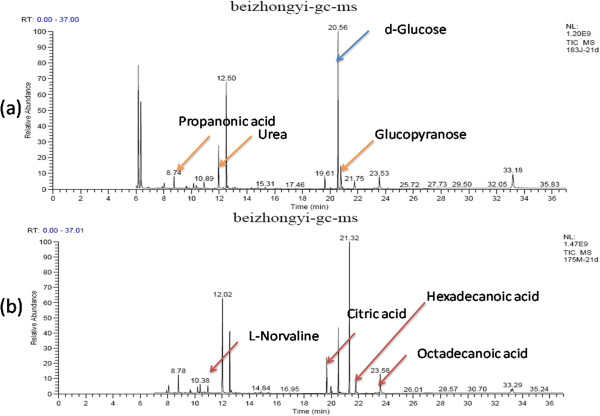
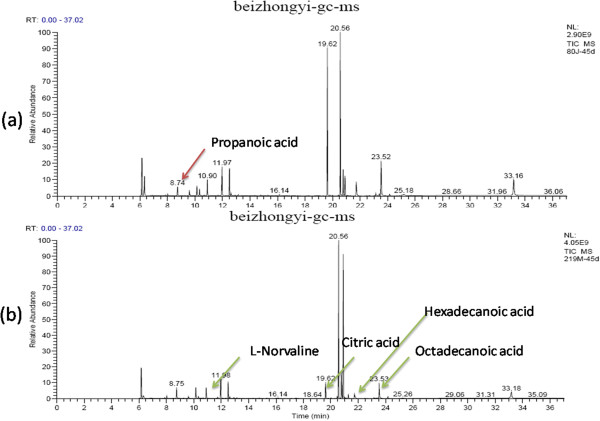
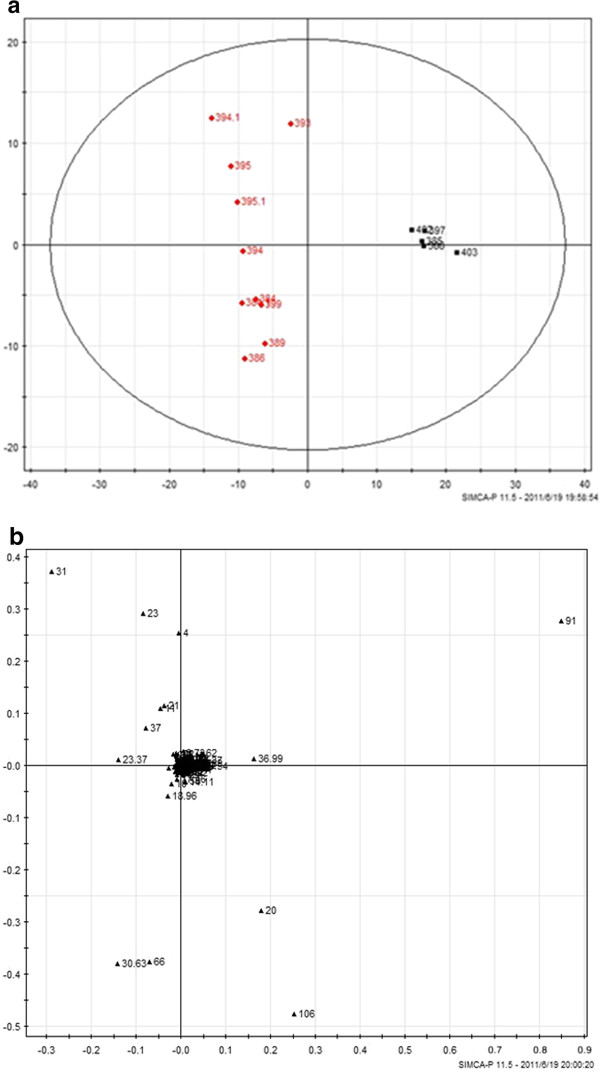
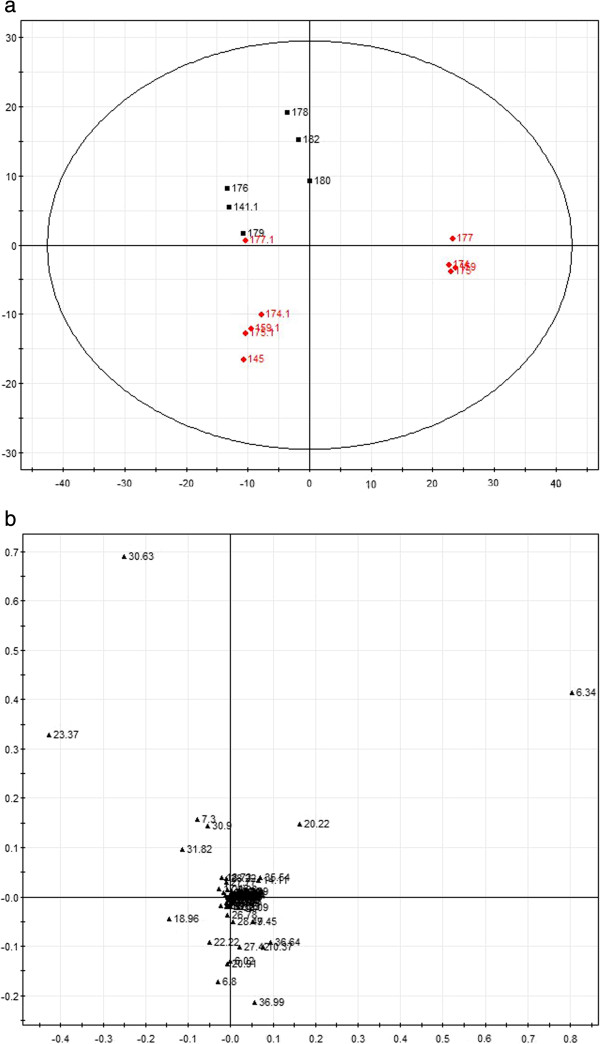
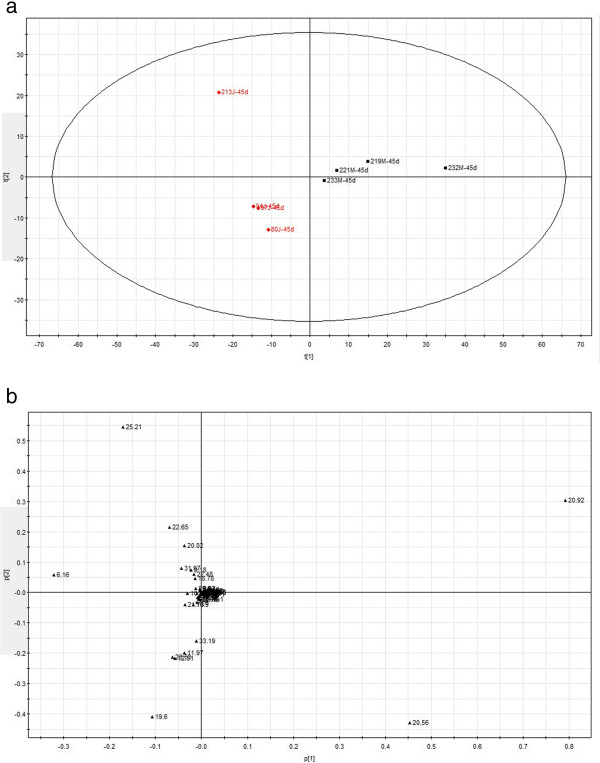
Methods: The heart failure (HF) model was induced by ligation of the left anterior descending coronary artery (LAD) in Sprague-Dawley rats. The rats were divided into the following two groups: the HF model group (LAD ligation) and the sham operated group. GC-MS was used with pattern recognition technology and principal component analysis (PCA) to analyze the plasma samples at 4, 21 and 45 day after operation.
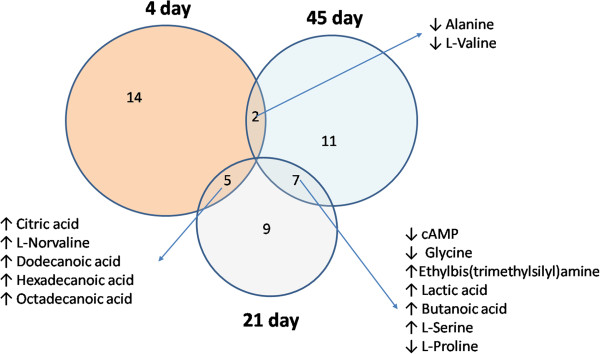
Results: It was determined that the period from 7 to 28 days was the stable time window of ischemic heart failure with qi deficiency and blood stasis syndrome (QDBS), and the qi deficiency syndrome occurred at 1 to 4 days and 45 to 60 days after operation. The results exhibited 5 plasma metabolite changes in the same trend at 4 and 21 day after the LAD operation, 7 at 21 and 45 day, and 2 at 4 and 45 day. No metabolite showed the same change at all of the 3 time points. At day 21 (the QDBS syndrome time point) after operation, 4 plasma metabolites showed the same trends with the results of our previous study on patients with the blood stasis syndrome.
Conclusions: The syndrome diagnosis is reliable in the HF rat model in this study. Plasma metabolites can provide a basis for the evaluation of Chinese medicine syndrome animal models.
Figures
References
-
- Wang X, Sun H, Zhang A, Sun W, Wang P, Wang Z. Potential role of metabolomics apporoaches in the area of traditional Chinese medicine: as pillars of the bridge between Chinese and Western medicine. J Pharm Biomed Anal. 2011;55:859–868. - PubMed
-
- Sun H, Zhang A, Wang X. Potential role of metabolomic approaches for Chinese medicine syndromes and herbal medicine. Phytother Res. 2012;26:1466–1471. - PubMed
-
- Rasmiena AA, Ng TW, Meikle PJ. Metabolomics and ischaemic heart disease. Clin Sci (Lond) 2013;124:289–306. - PubMed
-
- Luo HG, Ding J, Yue GX, Chen JX. Metabonomic study of syndrome of liver qi stagnation and spleen deficiency in rats. Zhong Xi Yi Jie He Xue Bao. 2007;5:307–313. - PubMed
Publication types
MeSH terms
LinkOut - more resources
Full Text Sources
Other Literature Sources
Medical
Research Materials
Miscellaneous
