. 2014 Sep 5;289(36):24995-5009.
doi: 10.1074/jbc.M114.564997. Epub 2014 Jul 10.

Class I and IIa histone deacetylases have opposite effects on sclerostin gene regulation

Affiliations

Class I and IIa histone deacetylases have opposite effects on sclerostin gene regulation

Stefan Baertschi et al. J Biol Chem. .

Abstract

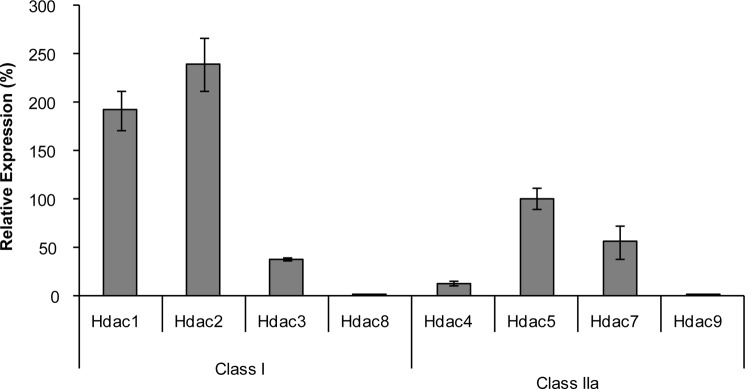
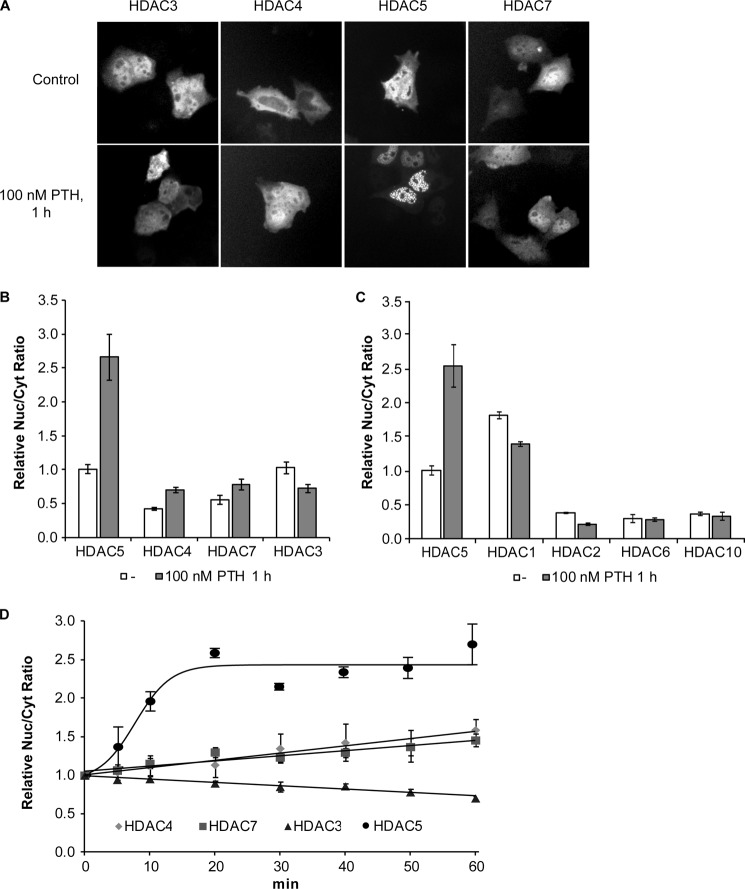
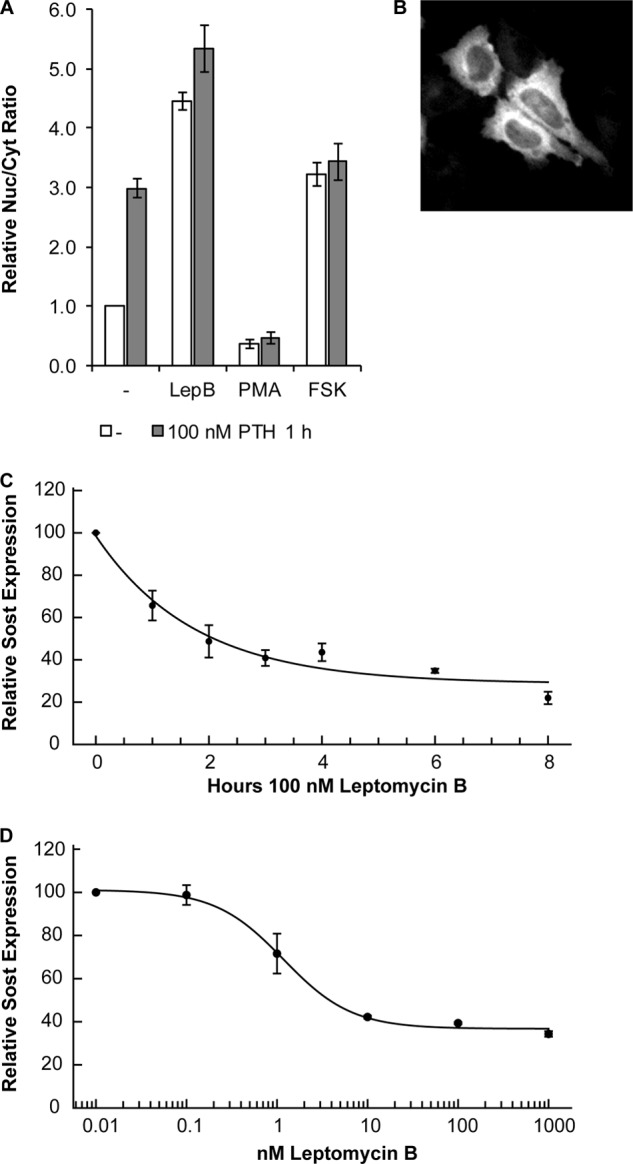
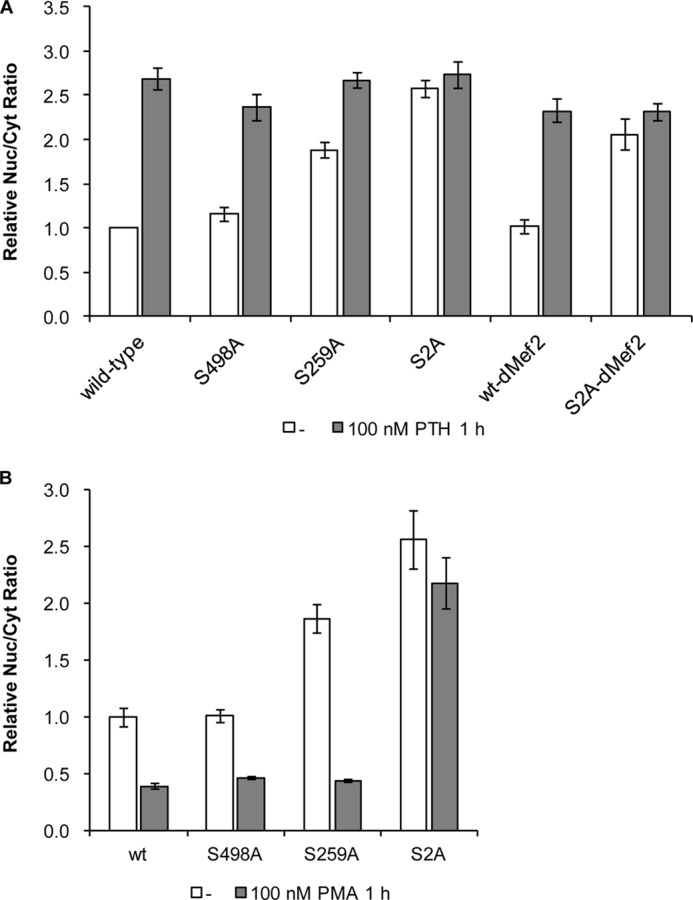
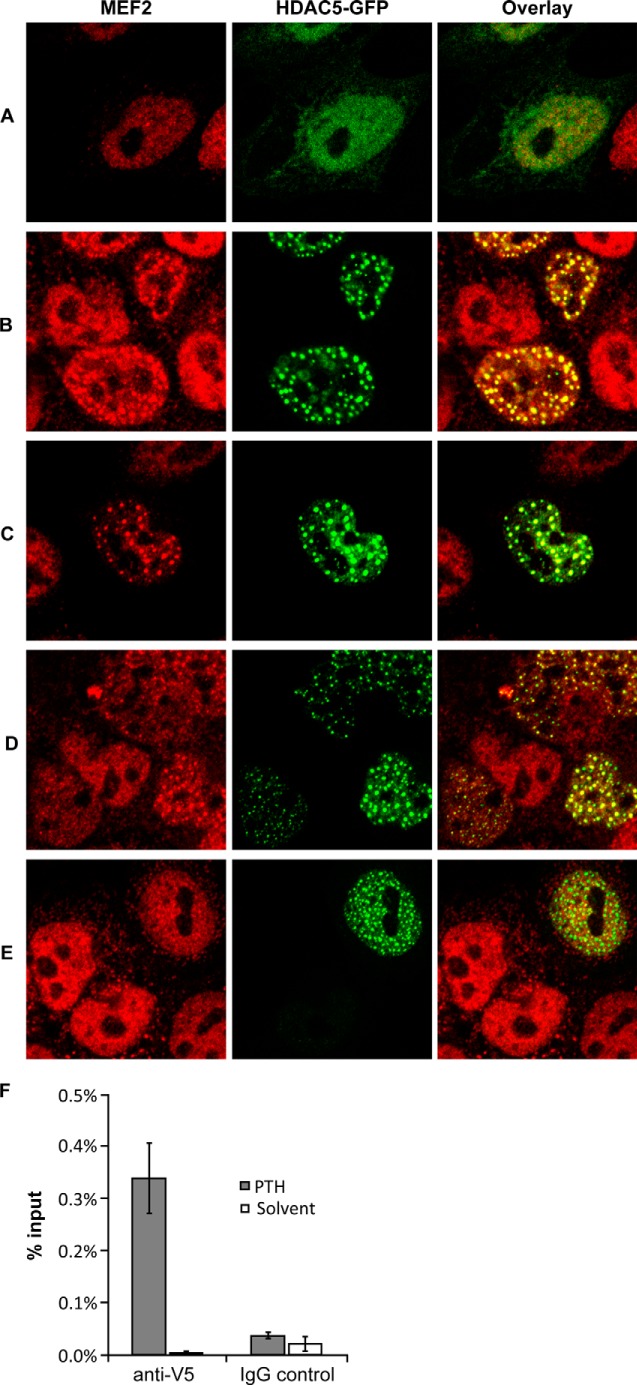
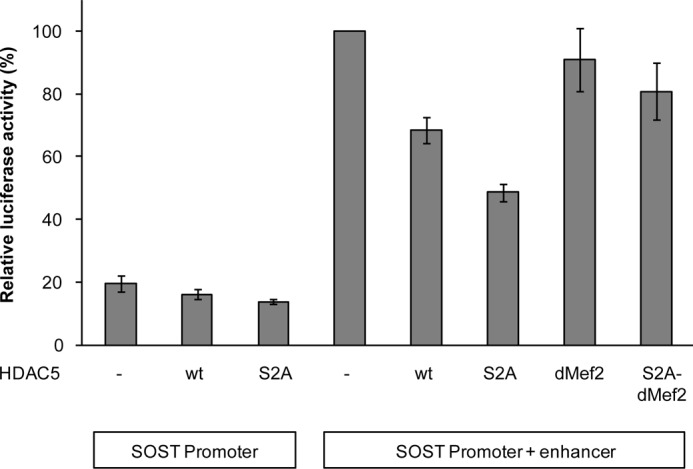
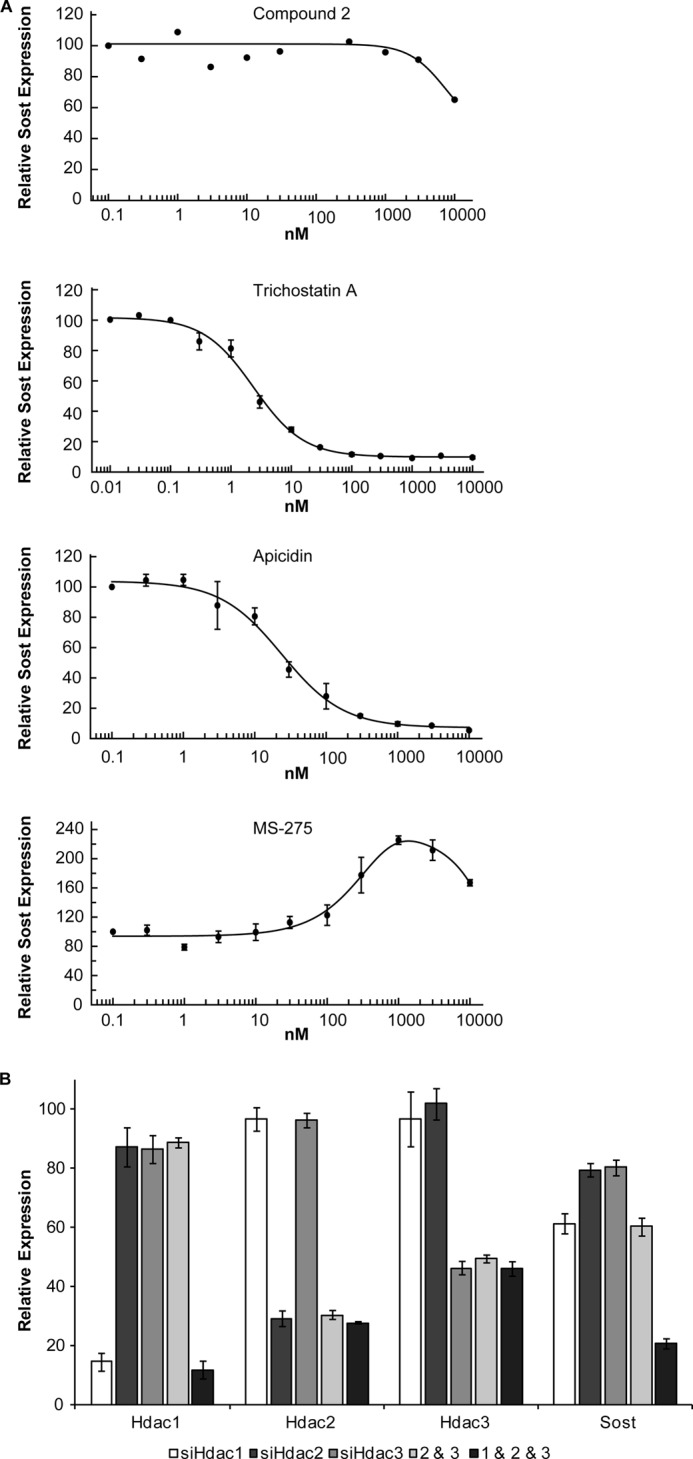
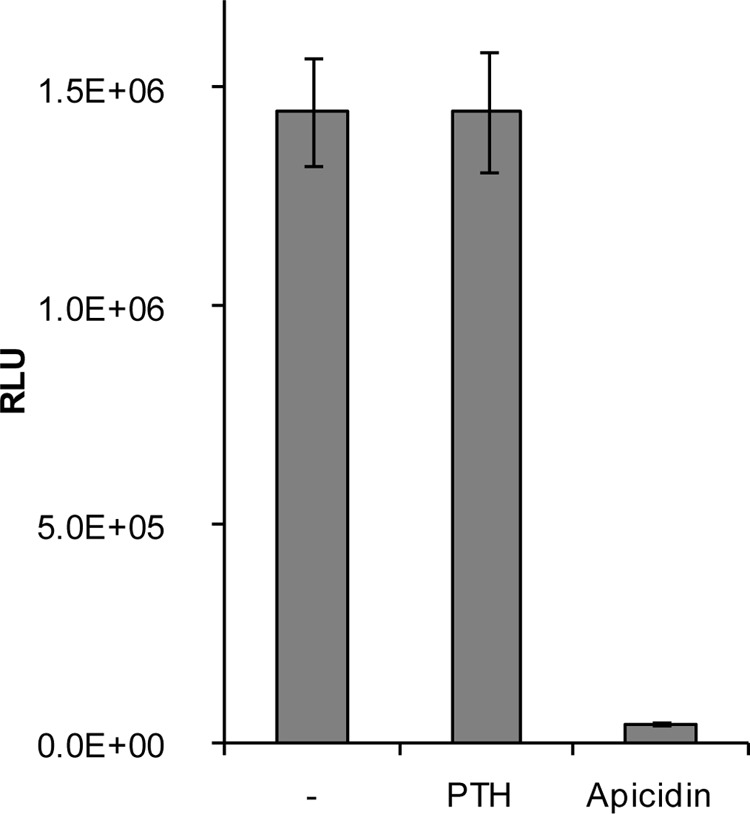
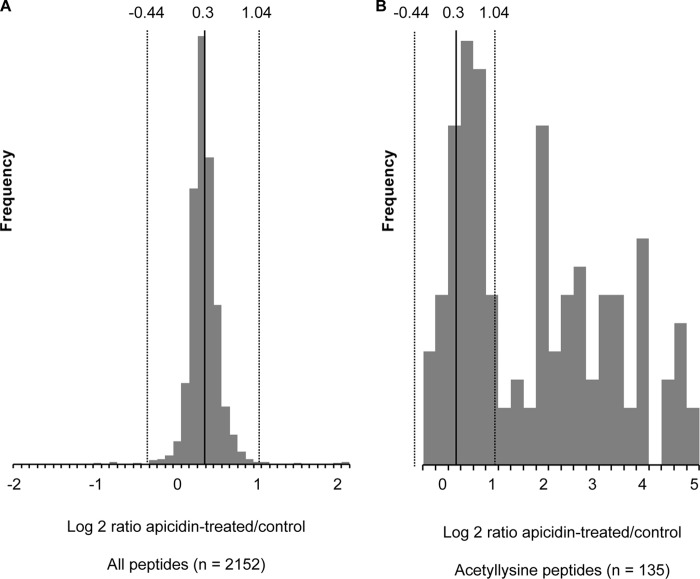
Adult bone mass is controlled by the bone formation repressor sclerostin (SOST). Previously, we have shown that intermittent parathyroid hormone (PTH) bone anabolic therapy involves SOST expression reduction by inhibiting myocyte enhancer factor 2 (MEF2), which activates a distant bone enhancer. Here, we extended our SOST gene regulation studies by analyzing a role of class I and IIa histone deacetylases (HDACs), which are known regulators of MEF2s. Expression analysis using quantitative PCR (qPCR) showed high expression of HDACs 1 and 2, lower amounts of HDACs 3, 5, and 7, low amounts of HDAC4, and no expression of HDACs 8 and 9 in constitutively SOST-expressing UMR106 osteocytic cells. PTH-induced Sost suppression was associated with specific rapid nuclear accumulation of HDAC5 and co-localization with MEF2s in nuclear speckles requiring serine residues 259 and 498, whose phosphorylations control nucleocytoplasmic shuttling. Increasing nuclear levels of HDAC5 in UMR106 by blocking nuclear export with leptomycin B (LepB) or overexpression in transient transfection assays inhibited endogenous Sost transcription and reporter gene expression, respectively. This repressor effect of HDAC5 did not require catalytic activity using specific HDAC inhibitors. In contrast, inhibition of class I HDAC activities and expression using RNA interference suppressed constitutive Sost expression in UMR106 cells. An unbiased comprehensive search for involved HDAC targets using an acetylome analysis revealed several non-histone proteins as candidates. These findings suggest that PTH-mediated Sost repression involves nuclear accumulation of HDAC inhibiting the MEF2-dependent Sost bone enhancer, and class I HDACs are required for constitutive Sost expression in osteocytes.

Keywords: Gene Regulation; Histone Deacetylase (HDAC); Parathyroid Hormone; Sclerostin; Transcription Corepressor; Transcriptional Coactivator.


Figures

FIGURE 1.
FIGURE 1.
Expression of class I and IIa Hdacs in UMR106 cells. RNA expressions of class I and IIa Hdacs were determined by qPCR. Relative expression levels are expressed as the mean ± S.E. of two independent experiments. Expression of Hdac5 was arbitrarily taken as 100%.
FIGURE 2.
FIGURE 2.
PTH specifically induces a rapid and strong nuclear localization of HDAC5. A, UMR106 cells were transfected with HDAC-GFP expression vectors for HDAC3, -4, -5, and -7 and their subcellular distributions were analyzed using fluorescence microscopy and HCA. Representative green fluorescence images are shown of transfected non-treated cells (upper panel) and transfected cells stimulated with 100 nm PTH for 1 h (lower panel). B, the ratio between nuclear and cytoplasmic localization (Nuc/Cyt ratio) was individually determined for transfected cell. Shown are the mean ± S.E. of at least four independent experiments relative to HDAC5, which was taken as 1. C, HCA of the subcellular distribution of FLAG-tagged HDAC1, -2, -5, -6, and -10 expressed in UMR106 cells in the absence or presence of 100 nm PTH. D, time courses of the effect of 100 nm PTH on HDACs nuclear to cytoplasmic localization. Shown are relative Nuc/Cyt ratios normalized to time 0. Each data point is the mean ± S.E. of at least three independent experiments.
FIGURE 3.
FIGURE 3.
The nuclear export inhibitor LepB inhibits Sost expression. A, regulation of HDAC5-cytoplasmic shuttling by LepB, PMA, and forskolin. UMR106 cells were preincubated for 30 min with 40 nm LepB, 100 nm PMA, 10 μm forskolin or solvent control (−) and then stimulated with 100 nm PTH or solvent control for 1 h followed by HCA of HDAC5 nucleocytoplasmic distribution. Shown are mean ± S.E. of three independent experiments normalized to control. B, representative image of PMA-induced HDAC5-GFP nuclear export. Time (C)- and dose (D)-dependent inhibition of Sost expression by LepB. UMR106 cells were incubated with LepB as indicated in the figure and subsequently Sost expression was analyzed by qPCR. Sost expression levels were normalized to β2-microglobulin expression. Shown are relative Sost expression level mean ± S.E. of two independent experiments.
FIGURE 4.
FIGURE 4.
Effect of PTH and PMA on HDAC5 shuttling mutants. A, intracellular localizations of wt HDAC5-GFP and the mutants serine 498 to alanine (S498A), serine 259 to alanine (S259A), both serine to alanine (S2A), lysine 184 and arginine 186 to alanine (dMEF2), and all four residues to alanines (S2A-dMEF2) were analyzed after transfection of the corresponding expression plasmids into UMR106 cells using HCA. Transfected cells were incubated with solvent control, 100 nm PTH (A), or 100 nm PMA (B) for 1 h. Shown are the relative mean ± S.E. of at least four experiments normalized to untreated wt HDAC5.
FIGURE 5.
FIGURE 5.
PTH-induced nuclear speckle formation of HDAC5 and association with MEF2 and Sost enhancer. UMR106 cells were transfected with wt HDAC5-GFP (A–C), S2A mutant (D), or dMEF2 mutant (E) expression plasmids. 24 h later, subnuclear localization of HDAC-GFP fusion proteins were analyzed by confocal microscopy (middle column) in control cells (A and D) or cells treated with 100 nm PTH (B and E) or 40 nm LepB (C) for 1 h. Localization of endogenous MEF2 transcription factors was done by immunostaining (red fluorescence, left column). Furthermore, an overlay of HDAC5-GFP and MEF2 fluorescence is shown in the right column. F, UMR106 cells were transfected with HDAC5-V5 expression plasmid and incubated with PTH (100 nm) or solvent control for 1 h followed by anti-V5 or control IgG ChIP and quantitative PCR for Sost enhancer. Results are shown as percentage bound relative to total input DNA.
FIGURE 6.
FIGURE 6.
Nuclear HDAC5 inhibits SOST bone enhancer activity by masking MEF2. UMR106 cells were transiently transfected with control expression vector (−), expression plasmids for wt or mutant HDAC5s, and luciferase reporter plasmids as indicated in the figure. After 48 h, cells were lysed and luciferase activities were determined. Shown are mean ± S.E. of relative luciferase activities from four independent experiments.
FIGURE 7.
FIGURE 7.
The class I HDACs 1, 2, and 3 are required for Sost expression. A, dose-response curves of HDIs compound 2, TSA, apicidin, and MS-275. UMR106 cells were incubated with increasing concentrations of HDIs for 4 h followed by Sost expression analysis using qPCR. Shown are mean ± S.E. of two independent experiments. B, siRNA-mediated knock-down of Hdacs 1, 2, and 3 and effect on Sost expression. UMR106 cells were transfected upon seeding with individual HDAC siRNAs or combinations thereof as indicated in the figure. After 72 h, gene expression levels of Hdac1, -2, -3, and Sost were determined using qPCR. Expressions were normalized to β2-microglobulin expression and non-targeting control siRNA, which was set at 100%. Shown are mean ± S.E. of at least 2 independent experiments.
FIGURE 8.
FIGURE 8.
Global cellular HDAC activity is suppressed by apicidin but not by PTH. Overall relative HDAC activities were determined in UMR106 cells. Cells were treated with solvent control (-), 1 μm PTH, or 10 μm apicidin for 1 h before measuring total HDAC activities using a luciferase reporter kit. Shown are mean ± S.E. of a representative experiment.
FIGURE 9.
FIGURE 9.
Analysis of whole cell protein acetylation in response to apicidin treatment of UMR106 cells. Protein acetylation was analyzed by SILAC-based quantitative mass spectrometry of immuno-enriched acetyllysine peptides. Shown are histogram distributions of the apicidin-treated/untreated ratios for all peptides in the acetyllysine-enriched sample (A) versus only acetyllysine-containing peptides (B). Vertical dotted lines indicate the 95% confidence interval determined for all peptides and applied to acetyllysine-containing peptides (average ± 2 S.D.).

References

    1. Moester M. J., Papapoulos S. E., Löwik C. W., van Bezooijen R. L. (2010) Sclerostin: current knowledge and future perspectives. Calcif. Tissue Int. 87, 99–107 - PMC - PubMed
    1. Li X., Ominsky M. S., Niu Q. T., Sun N., Daugherty B., D'Agostin D., Kurahara C., Gao Y., Cao J., Gong J., Asuncion F., Barrero M., Warmington K., Dwyer D., Stolina M., Morony S., Sarosi I., Kostenuik P. J., Lacey D. L., Simonet W. S., Ke H. Z., Paszty C. (2008) Targeted deletion of the sclerostin gene in mice results in increased bone formation and bone strength. J. Bone Miner. Res. 23, 860–869 - PubMed
    1. Kramer I., Loots G. G., Studer A., Keller H., Kneissel M. (2010) Parathyroid hormone (PTH)-induced bone gain is blunted in SOST overexpressing and deficient mice. J. Bone Miner. Res. 25, 178–189 - PMC - PubMed
    1. Loots G. G., Kneissel M., Keller H., Baptist M., Chang J., Collette N. M., Ovcharenko D., Plajzer-Frick I., Rubin E. M. (2005) Genomic deletion of a long-range bone enhancer misregulates sclerostin in Van Buchem disease. Genome Res. 15, 928–935 - PMC - PubMed
    1. Winkler D. G., Sutherland M. K., Geoghegan J. C., Yu C., Hayes T., Skonier J. E., Shpektor D., Jonas M., Kovacevich B. R., Staehling-Hampton K., Appleby M., Brunkow M. E., Latham J. A. (2003) Osteocyte control of bone formation via sclerostin, a novel BMP antagonist. EMBO J. 22, 6267–6276 - PMC - PubMed

MeSH terms

LinkOut - more resources