. 2014 Jul 10:7:440.
doi: 10.1186/1756-0500-7-440.

Evolutionary and sequence-based relationships in bacterial AdoMet-dependent non-coding RNA methyltransferases

Affiliations

Evolutionary and sequence-based relationships in bacterial AdoMet-dependent non-coding RNA methyltransferases

Jeanneth Mosquera-Rendón et al. BMC Res Notes. .

Abstract

Background: RNA post-transcriptional modification is an exciting field of research that has evidenced this editing process as a sophisticated epigenetic mechanism to fine tune the ribosome function and to control gene expression. Although tRNA modifications seem to be more relevant for the ribosome function and cell physiology as a whole, some rRNA modifications have also been seen to play pivotal roles, essentially those located in central ribosome regions. RNA methylation at nucleobases and ribose moieties of nucleotides appear to frequently modulate its chemistry and structure. RNA methyltransferases comprise a superfamily of highly specialized enzymes that accomplish a wide variety of modifications. These enzymes exhibit a poor degree of sequence similarity in spite of using a common reaction cofactor and modifying the same substrate type.

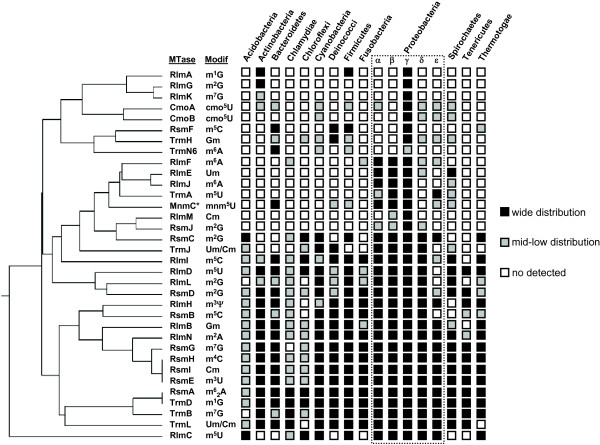
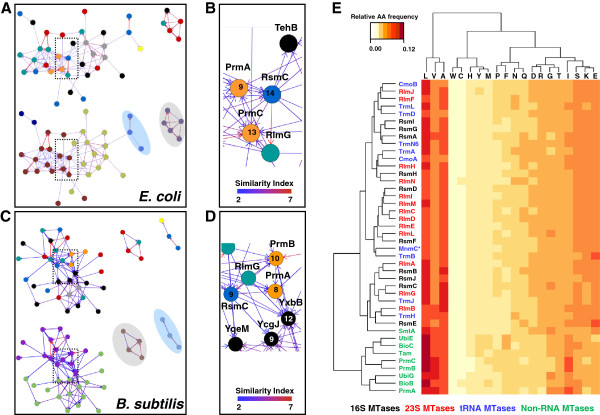
Results: Relationships and lineages of RNA methyltransferases have been extensively discussed, but no consensus has been reached. To shed light on this topic, we performed amino acid and codon-based sequence analyses to determine phylogenetic relationships and molecular evolution. We found that most Class I RNA MTases are evolutionarily related to protein and cofactor/vitamin biosynthesis methyltransferases. Additionally, we found that at least nine lineages explain the diversity of RNA MTases. We evidenced that RNA methyltransferases have high content of polar and positively charged amino acid, which coincides with the electrochemistry of their substrates.

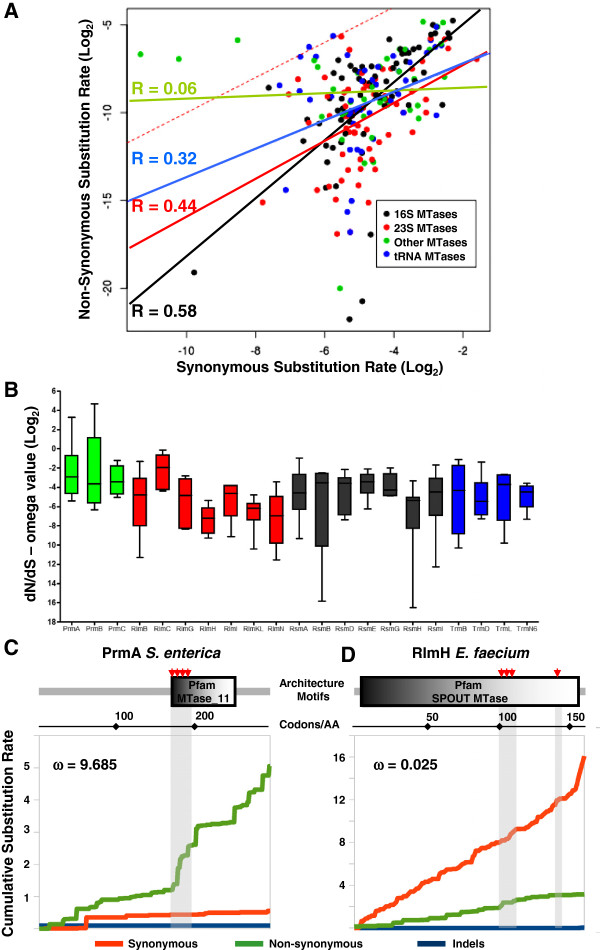
Conclusions: After studying almost 12,000 bacterial genomes and 2,000 patho-pangenomes, we revealed that molecular evolution of Class I methyltransferases matches the different rates of synonymous and non-synonymous substitutions along the coding region. Consequently, evolution on Class I methyltransferases selects against amino acid changes affecting the structure conformation.


Figures

Figure 1
Figure 1
Phylogenetic distribution of the RNA MTases across bacteria phyla. The UPGMA dendrogram of the RNA MTases (Table 1) is shown according to their distribution in major bacterial phyla. A presence/absence pattern was categorized as follows: wide distribution (black-filled squares), where the respective gene is present in almost all the phyla species; mid-low distribution (gray-filled squares), where the respective gene is present in ~50% of the phyla species; and undetected (white-filled squares), where the respective gene showed no clear homologs.
Figure 2
Figure 2
Distribution of the RNA MTase sequence motifs across bacterial genomes. Using the amino acid profiles inferred from the probabilistic methods, a search for the proteins matching the RNA MTase sequences was done. Information on query and alignment length, and on the score for amino acid replacements was used to draw the density violin plots per family and class of RNA MTases. Orthology was considered for those hits (with few exceptions) with a Similarity Index higher than 7.5, whereas paralogy was considered for hits with a Similarity Index 5.0 to 7.5. *Refers to the N-terminal domain of the bi-functional MnmC enzyme.
Figure 3
Figure 3
Sequence motifs and amino acid content-based MTase clustering. A similarity network approach to distinguish the sequence relationships among the RNA MTases. Edges are represented by Similarity Index scores (see Amino acid profiles at Methods) and Nodes are denoted by a function assigned to each MTase as follows: 16S rRNA MTases (blue), 23S RNA MTases (green), tRNA MTases (red), ribosome protein MTase (orange), cofactor/vitamin biosynthesis MTase (gray), unknown function (black). The numbers located inside the nodes in B and D panels indicate connectivity (number of interactions). The A and B panels show the Similarity Network for E. coli K12, whereas the C and D panels indicate that for B. subtilis 168. E – Heatmap built from information on the relative amino acid distributions among all the MTase families detected in the Similarity Networks. *Refers to the N-terminal domain of the bi-functional MnmC enzyme.
Figure 4
Figure 4
Short-term molecular evolution of the RNA and non-RNA MTases. A – Scatter plot showing the dN and dS Log2 values for each MTase studied in eight different patho-pangenomes. The MTases were classified according to subtract. The correlation coefficients for each type of MTases were calculated and plotted together with tendency lines. The red dashed line shows the neutrality boundary where the upper values are considered to be under positive selection and the lower one is considered to be under purifying (or stabilizing) selection. B – Boxplot showing the distribution of the (ω) omega values (Log2). Categorization of the MTases in agreement with the plot in panel A. Deep view of the synonymous and non-synonymous substitutions on prmA from S. enterica(C), showing one of the highest omega values, and rlmH from E. faecium(D), showing a pattern purifying selection. These plots indicate the exact sites on proteins where the synonymous and non-synonymous substitutions predominantly lie. The critical sites for protein function are highlighted in gray.
Figure 5
Figure 5
Sequence similarity characterization among the Class I MTases. Using the entire amino acid profiles from the set of MTases comprising the “Multifunction Cluster” in the Similarity Networks, a multiple sequence alignment was built based on the algorithms specialized in the detection of distant homologs. A - From the multiple sequence alignment, three different Similarity Regions, Regions I-III, with a high degree of conservation, were clearly retrieved. B - The three-dimensional structures depicted in the bottom panels, and regarding the different MTases families of the Multifunction Cluster, show the consensus localization of these Similarity Regions in the respective protein structures.

References

    1. Agris PF. Bringing order to translation: the contributions of transfer RNA anticodon-domain modifications. EMBO Rep. 2008;9(7):629–635. - PMC - PubMed
    1. Helm M. Post-transcriptional nucleotide modification and alternative folding of RNA. Nucleic Acids Res. 2006;34(2):721–733. - PMC - PubMed
    1. Grosjean H. In: Topics in Current Genetics. 12. Hohmann S, editor. New York: Springer Verlag; 2005. Fine tuning of RNA functions by modification and editing.
    1. Decatur WA, Fournier MJ. rRNA modifications and ribosome function. Trends Biochem Sci. 2002;27(7):344–351. - PubMed
    1. Björk GR, Hagervall TG. In: EcoSal—Escherichia coli and Salmonella: cellular and molecular biology. Böck RCI, Kaper JB, Neidhardt FC, Nyström T, Rudd KE, Squires CL, editor. Washington, D.C: ASM Press; 2005. Transfer RNA modification.

Publication types

LinkOut - more resources