. 2014 Jul 11;345(6193):216-20.
doi: 10.1126/science.1253533.

Cancer therapy. Ex vivo culture of circulating breast tumor cells for individualized testing of drug susceptibility

Affiliations

Cancer therapy. Ex vivo culture of circulating breast tumor cells for individualized testing of drug susceptibility

Min Yu et al. Science. .

Abstract

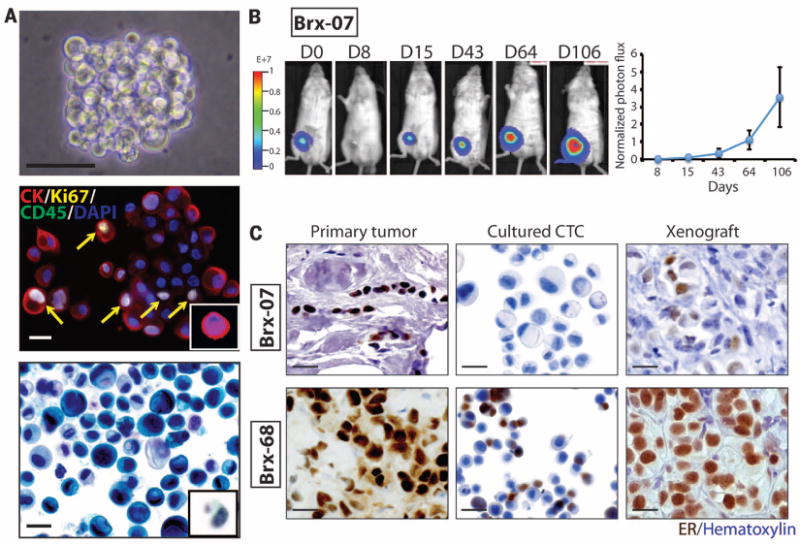
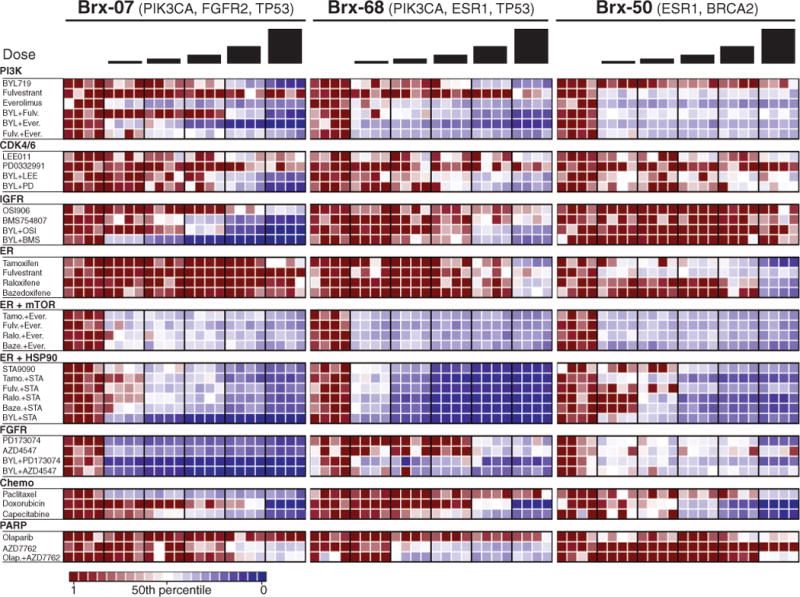
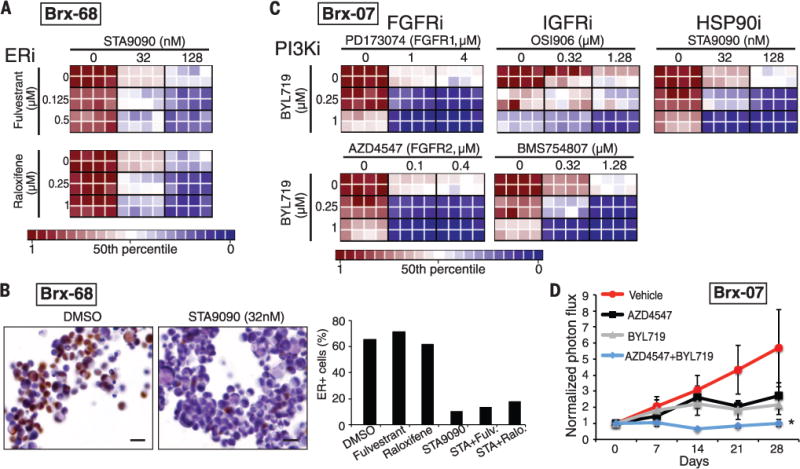
Circulating tumor cells (CTCs) are present at low concentrations in the peripheral blood of patients with solid tumors. It has been proposed that the isolation, ex vivo culture, and characterization of CTCs may provide an opportunity to noninvasively monitor the changing patterns of drug susceptibility in individual patients as their tumors acquire new mutations. In a proof-of-concept study, we established CTC cultures from six patients with estrogen receptor-positive breast cancer. Three of five CTC lines tested were tumorigenic in mice. Genome sequencing of the CTC lines revealed preexisting mutations in the PIK3CA gene and newly acquired mutations in the estrogen receptor gene (ESR1), PIK3CA gene, and fibroblast growth factor receptor gene (FGFR2), among others. Drug sensitivity testing of CTC lines with multiple mutations revealed potential new therapeutic targets. With optimization of CTC culture conditions, this strategy may help identify the best therapies for individual cancer patients over the course of their disease.


Figures

Fig. 1
Fig. 1. Ex vivo expansion of breast cancer CTCs
(A) Representative images of nonadherent CTC culture (BRx-07). Top: Phase contrast. Scale bar, 100 μm. Middle: immunofluorescent staining for cytokeratin (CK, red), Ki67 (yellow), CD45 (green), nuclei [4′,6-diamidino-2-phenylindole (DAPI), blue]. Scale bar, 20 μm. Bottom: Light microscopic imaging with Papanicolaou staining. Comparable images for uncultured primary CTCs are shown in the insets. Scale bar, 20 μm. (B) (Left) Bioluminescent images showing growth of NSG mouse xenografts, after implantation of 20,000 cultured CTCs (BRx-07) into the mammary fat pad. (Right) Quantification of bioluminescent signals for BRx-07–derived mouse xenografts (mean ± SD, n = 6). (C) Histology of matched primary breast tumors, cultured CTCs, and CTC-derived mouse xenografts for two CTC lines. All panels show cellular staining with hematoxylin (blue) and immunohistochemical staining for ER expression (brown). Scale bar, 20 μm.
Fig. 2
Fig. 2. Drug sensitivity of cultured CTCs
Heatmaps representing cell viability after treatment of BRx-07, BRx-68, and BRx-50 CTC lines with selected anticancer drugs, either alone or in combination. The presumed driving mutation for each CTC line is noted, and drugs are grouped according to therapeutic class and targeted pathway. For each drug, the range of concentrations tested is centered around the IC50 derived from large-scale breast cancer cell line screens (17), and each concentration represents a twofold increase from the previous dose, with each concentration tested in quadruplicate. Drug concentrations are listed in table S3. Signal from viable cells remaining after drug treatment is normalized to corresponding vehicle [dimethyl sulfoxide (DMSO)]–treated controls, with ratios plotted ranging from red (more viable) to blue (less viable). Drug abbreviations: BYL, BYL719; Fulv, fulvestrant; Ever, everolimus; LEE, LEE011; PD, PD0332991; OSI, OSI906; BMS, BMS754807; Tamo, tamoxifen; Ralo, raloxifene; Baze, bazedoxifene; STA, STA9090; Olap, Olaparib.
Fig. 3
Fig. 3. Combinatorial drug targeting of mutant ESR1 and PIK3CA in CTC lines
(A) Heatmaps representing cell viability in the BRx-68 CTC line, carrying an ESR1 mutation (allele frequency 47%), treated with HSP90 inhibitor (STA9090) together with the selective estrogen receptor modulator (SERM) tamoxifen or degrader (SERD) fulvestrant. For these drug-combination studies, the concentrations of each drug was varied independently, and results are shown in eight replicates. Cooperative drug interactions are represented by a diagonal gradient, showing increasing cell killing as both drug concentrations increase independently. (B) Down-regulation of ER protein expression measured by immunohistochemical staining (brown) of BRx-68 CTC cultures treated for 24 hours with an HSP90 inhibitor (STA9090) versus vehicle (DMSO). Nuclei are stained with hematoxylin. Scale bar, 20 μm. Bar graph shows quantification of percent ER-positive cells. More than 200 cells were quantified in each condition. (C) Heatmaps representing cell viability in the BRx-07 line harboring mutations in PIK3CA (99% allele frequency) and FGFR2 (46% allele frequency). Drugs targeting the products of these mutated oncogenic drivers were tested, along with compounds inhibiting nonmutated targets (IGFR and HSP90). Drug combinations shown are PI3Ki + FGFRi; PIK3Ki + IGFRi; PIK3Ki + HSP90i. (D) Response of BRx-07 CTC-derived mouse xenografts to the PI3K inhibitor BYL719 (n = 4), the FGFR2 inhibitor AZD4547 (n = 3), the combination of the two inhibitors (BYL719+AZD4547) (n = 4), or diluent control (n = 4). Mean ± SD. In vivo drug administration was initiated after mammary fat pad inoculation with genotyped CTC cultures and establishment of an expanding tumor xenograft, and tumor-derived bioluminescent measurements were normalized to pretreatment levels.

Comment in

References

    1. Haber DA, Gray NS, Baselga J. Cell. 2011;145:19–24. - PubMed
    1. Yu M, Stott S, Toner M, Maheswaran S, Haber DA. J Cell Biol. 2011;192:373–382. - PMC - PubMed
    1. Ozkumur E, et al. Sci Transl Med. 2013;5:179ra47. - PMC - PubMed
    1. Liu X, et al. Am J Pathol. 2012;180:599–607. - PMC - PubMed
    1. Sato T, Clevers H. Methods Mol Biol. 2013;945:319–328. - PubMed

Publication types

MeSH terms

Substances

Associated data