. 2014 Jul;42(13):8678-91.
doi: 10.1093/nar/gku582. Epub 2014 Jul 10.

Free mRNA in excess upon polysome dissociation is a scaffold for protein multimerization to form stress granules

Affiliations

Free mRNA in excess upon polysome dissociation is a scaffold for protein multimerization to form stress granules

Ouissame Bounedjah et al. Nucleic Acids Res. 2014 Jul.

Abstract

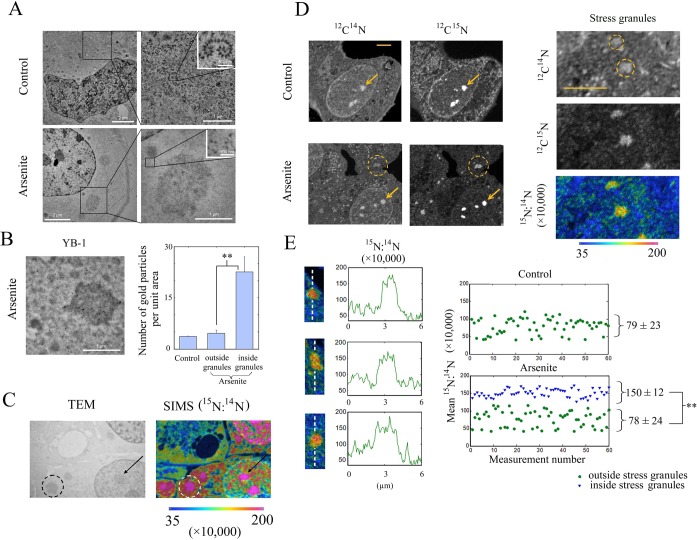
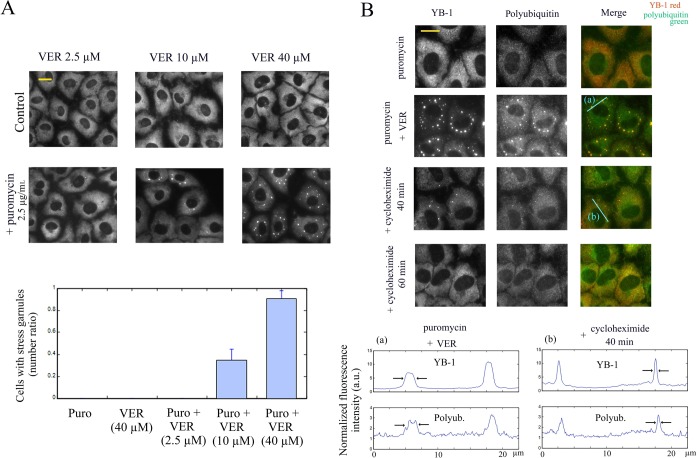
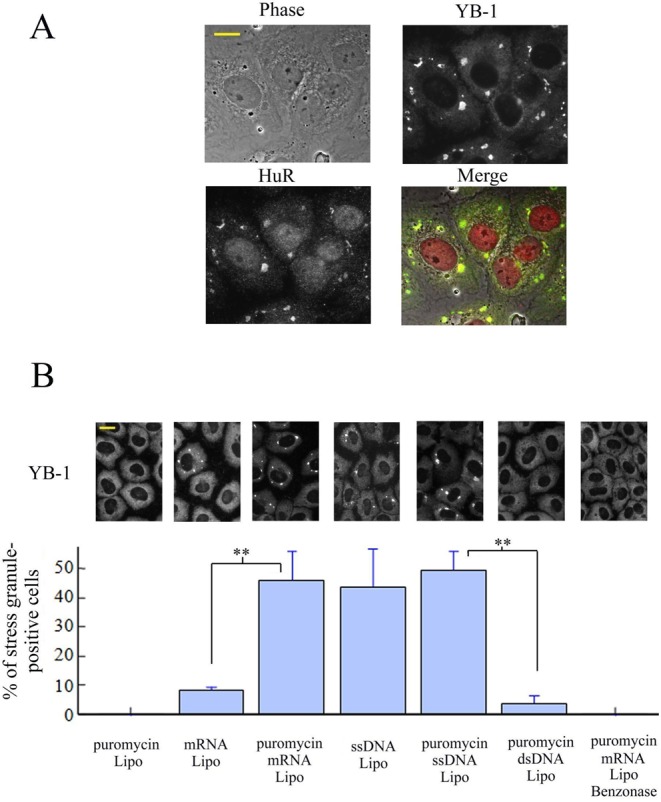
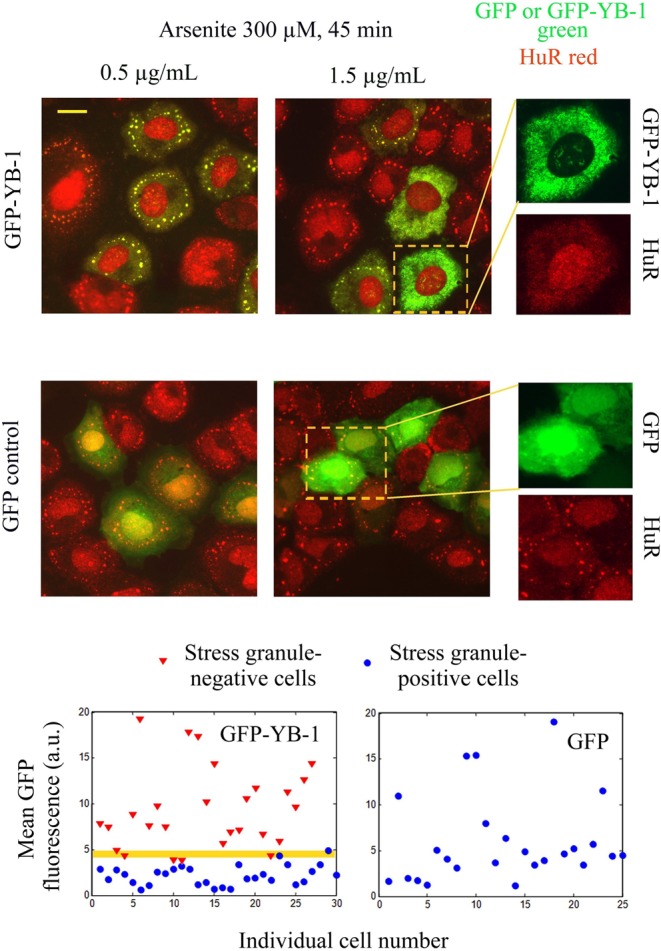
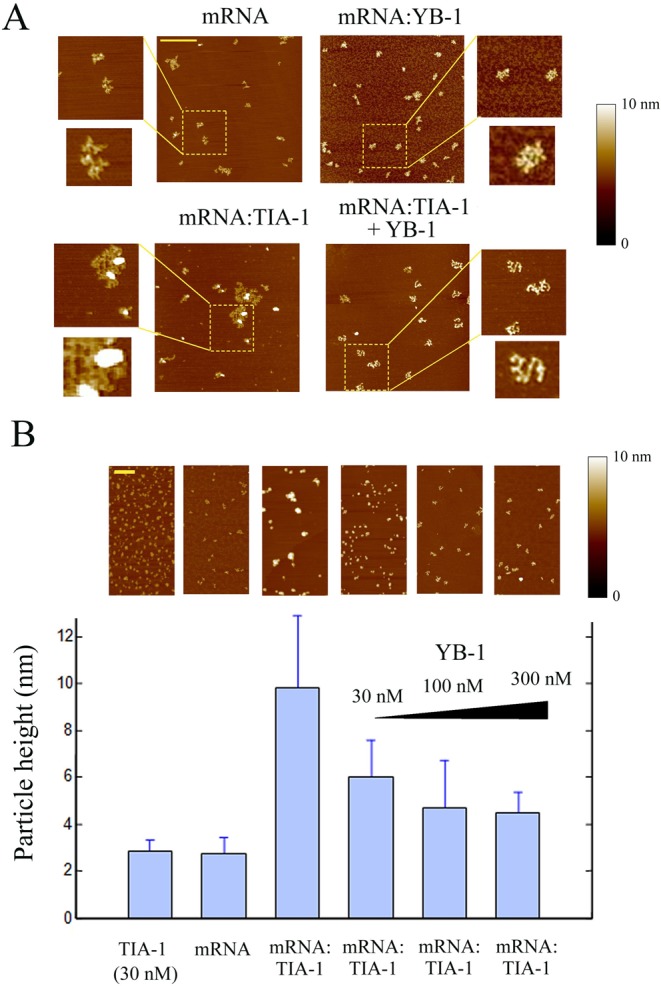
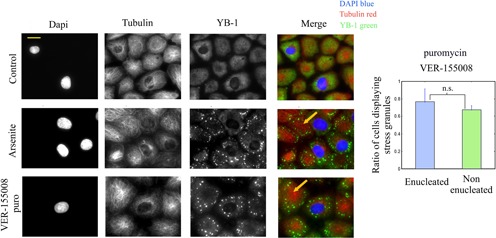
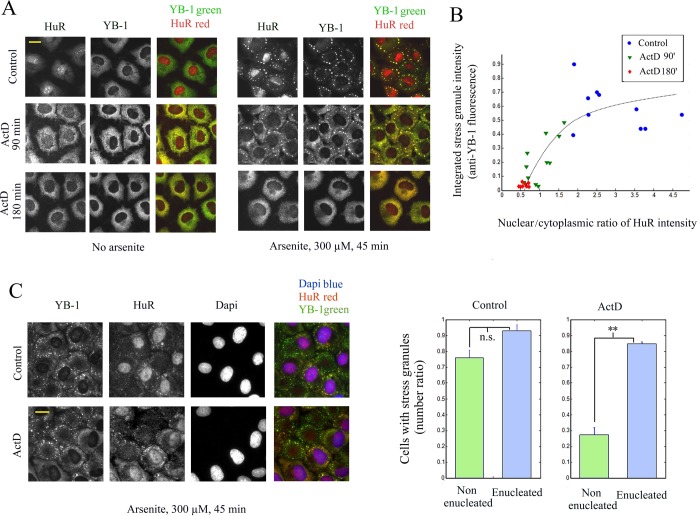
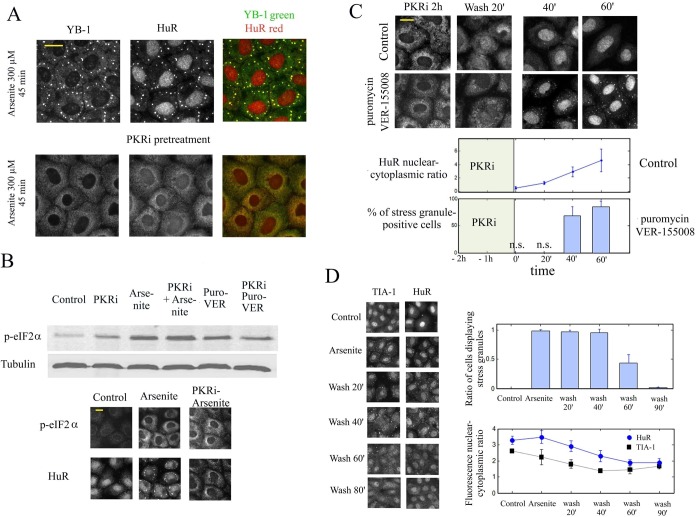
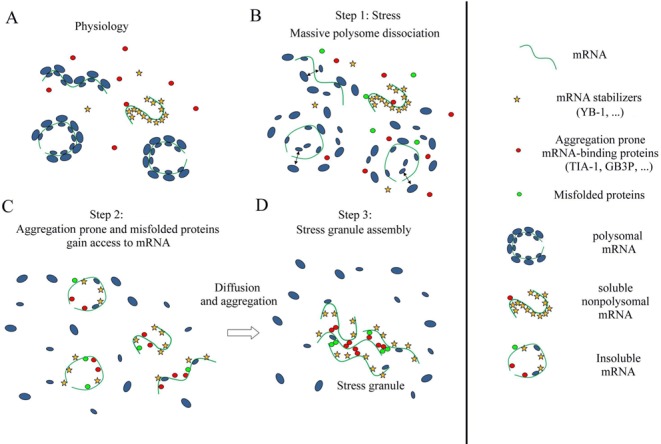
The sequence of events leading to stress granule assembly in stressed cells remains elusive. We show here, using isotope labeling and ion microprobe, that proportionally more RNA than proteins are present in stress granules than in surrounding cytoplasm. We further demonstrate that the delivery of single strand polynucleotides, mRNA and ssDNA, to the cytoplasm can trigger stress granule assembly. On the other hand, increasing the cytoplasmic level of mRNA-binding proteins like YB-1 can directly prevent the aggregation of mRNA by forming isolated mRNPs, as evidenced by atomic force microscopy. Interestingly, we also discovered that enucleated cells do form stress granules, demonstrating that the translocation to the cytoplasm of nuclear prion-like RNA-binding proteins like TIA-1 is dispensable for stress granule assembly. The results lead to an alternative view on stress granule formation based on the following sequence of events: after the massive dissociation of polysomes during stress, mRNA-stabilizing proteins like YB-1 are outnumbered by the burst of nonpolysomal mRNA. mRNA freed of ribosomes thus becomes accessible to mRNA-binding aggregation-prone proteins or misfolded proteins, which induces stress granule formation. Within the frame of this model, the shuttling of nuclear mRNA-stabilizing proteins to the cytoplasm could dissociate stress granules or prevent their assembly.


Figures

Figure 1.
Figure 1.
Stress granules in arsenite-treated cells are enriched in RNA compared to proteins. (A) NRK cells were untreated or exposed to 300 μM arsenite for 45 min. Transmission electron microscopy shows the presence of polysomes in control condition (higher magnification), which were not present after arsenite treatment. Instead, large and unstructured aggregates presumed to be stress granules appear in the cytoplasm. (B) Transmission electron microscopy imaging of immunogold anti-YB-1 labeled NRK cells shows a concentration of gold nanoparticles in the granules that appeared with arsenite. Statistical analysis of the quantification of the gold particle location in the cytoplasm of control and arsenite-treated cells and in the granules indicates an about 4-times enrichment of gold nanoparticles in the granules. Results are mean ± SD (n = 30). **P < 0.01 by t-test. (C) Correlative TEM/nanoSIMS microscopy of NRK cells treated with arsenite. The15N:14N ratio highlights the15N-enriched uridine-labeled RNA. Dashed circles and arrows point out a RNA-rich stress granule and a nucleolus, respectively. (D) nanoSIMS mapping of the 12C14N and 12C15N ion species and of the 15N:14N ratio in control and arsenite-treated cells (see ‘Materials and Methods’ section). In arsenite-treated cells, we observed the formation of stress granules (dashed circles) which can be distinguished both in the 12C14N (proteins and RNA) and the 12C15N (15N-uridine-labeled RNA) cartographies. As a control, arrows indicate the presence of RNA-rich nucleolus in both control and arsenite-treated cells. High magnification images of cytoplasmic stress granules show their enrichment in RNA compared to proteins as evidenced in the 15N:14N cartography. Scale bars: 5 μm. (E) Image gallery of stress granules and their respective line profile illustrating the increase of the15N:14N ratio in stress granules (mean value obtained over the 230 nm-thick dashed line). The scatter plots represent the mean 15N:14N ratio values measured in the cytoplasm of control and arsenite-treated cells (outside and inside stress granules in the latter case). The means were obtained by averaging the ratio over 0.5 μm2 areas. Statistical results are mean ± SD (n = 50). **P < 0.01 by t-test.
Figure 2.
Figure 2.
Nonpolysomal mRNA is required for the maintenance of polyubiquitin-rich protein aggregates that co-localize with stress granules after HSP70 inhibition and puromycin treatment. (A) NRK cells were treated for 3 h, as indicated, and labeled with anti-YB1 antibody. Puromycin leads to the appearance of cytoplasmic stress granules in cells treated with VER-155008 (VER). Statistical results are mean ± SD obtained on three different samples. Puro, puromycin (2.5 μg/ml). (B) NRK cells were exposed to 10 μM VER-155008 in combination with 2.5 μg/ml puromycin for 3 h and then to 20 μg/ml cycloheximide in the continuous presence of VER-155008 and puromycin, as indicated. Anti-polyubiquitin labeling was used to reveal the presence of polyubiquitinated proteins in stress granules. Line profiles of the anti-YB-1 and anti-polyubiquitin fluorescence intensities show the co-localization of stress granules and polyubiquitinated-protein aggregates and their progressive dissociation upon cycloheximide exposure. No polyubiquitinated protein aggregates were observed in the absence of stress granules after cycloheximide treatment for 1 h. Scale bar: 15 μm.
Figure 3.
Figure 3.
mRNA or ssDNA but not dsDNA transfections lead to stress granule assembly in puromycin-treated cells. (A) 1 μg of 2Luc mRNA synthesized in vitro was transfected in NRK cells using lipofectamine in the presence of 2.5 μg/ml puromycin (see ‘Materials and Methods’ section). Anti-HuR and anti-YB-1 labeling show the formation of stress granules 3 h after transfection. (B) NRK cells were transfected using lipofectamine (Lipo) with 1 μg of α-globin mRNA, M13 ssDNA, or linearized pUC19 dsDNA in the presence or absence of puromycin for 3 h. Benzonase treatment was performed before the formation of lipoplexes. The statistical analysis was obtained on three different samples. Results are mean ± SD (n = 3). Both mRNA and ssDNA lead to a significant formation of stress granules in puromycin-treated cells. Anti-YB-1 labeling shows the formation of stress granules 3 h after transfection.
Figure 4.
Figure 4.
YB-1 inhibits stress granule assembly above a critical expression level. GFP-YB-1 or GFP-transfected NRK cells were exposed to 300 μM arsenite for 45 min. The amount of plasmid used is indicated above the pictures. Higher magnification images show that high expression levels of GFP-YB-1 (but not of GFP) inhibit stress granule assembly. Scatter plots of the mean GFP-YB-1 or GFP cytoplasmic fluorescence show that, above a critical expression level of GFP-YB-1, stress granule assembly is impaired. Such a pattern is not observed for GFP expression alone. The null hypothesis that the GFP-YB-1 fluorescence intensities of stress granule positive and negative cells are similar for the two populations displayed in the scatter plot is rejected at the 5% significance level (t-test).
Figure 5.
Figure 5.
YB-1 dissociates RNA granules in vitro as revealed by atomic force microscopy. (A) As control, naked 2Luc mRNA (2 μg/ml) deposited on a mica surface was clearly detected by AFM. In the presence of 100 nM YB-1, single isolated mRNPs were detected. On the other hand, in the presence of 15 nM TIA-1, mRNA:TIA-1 complexes form aggregates. Interestingly, when 100 nM YB-1 was added to preformed mRNA:TIA-1 aggregates for 5 min, a clear dissociation of RNA granules into isolated mRNP was observed. Scale bar: 0.5 μm. (B) Statistical analyses of the particle height on the mica surface. TIA-1 (30 nM) in the absence of RNA is attracted on the negatively-charged surface and tends to form small TIA-1 aggregates (2.8 ± 0.5 nm), as expected from its self-attracting domain. In the presence of 2Luc mRNA (2 μg/ml), we noticed the appearance of large mRNA:TIA-1 aggregates (9.8 ± 3.1 nm). These large aggregates consequently contained both mRNA and TIA-1. Addition of increasing concentration of YB-1 progressively dislocates the mRNA:TIA-1 aggregates and leads to the appearance of isolated mRNPs after 5 min. Scale bar: 0.5 μm. The ‘particle analysis’ application of the nanoscope IIIa software (version 5) over at least 200 particles was used to provide mean heights and standard deviations.
Figure 6.
Figure 6.
Enucleated NRK cells do form stress granules. Mix populations of enucleated and non-enucleated NRK cells were exposed to 300 μM arsenite for 45 min or 10 μM VER-155008 plus 2.5 μg/ml puromycin for 90 min. Cells were then stained to observe the nuclei (DAPI), microtubules (anti-tubulin) and stress granules (anti-YB-1). As indicated by arrows, enucleated cells clearly display stress granules. The statistical analysis shows that the percentage of stress-granule positive cells is similar in both enucleated and non-enucleated cells after VER-155008 plus puromycin exposure. Results are mean ± SD obtained on three different samples. n.s., not significant by t-test.
Figure 7.
Figure 7.
Actinomycin D prevents stress granule assembly and induces the translocation of nuclear HuR to the cytoplasm. (A) HuR translocation to the cytoplasm depends on the length of ActD treatment (5 μg/ml) and impacts stress granule formation under arsenite exposure (300 μM, 45 min). (B) Scatter plot of the integrated intensity of stress granules per cell (anti-YB1 staining) versus the nuclear–cytoplasmic ratio of HuR (mean anti-HuR fluorescence). The plot reveals a negative correlation between the formation of stress granules and the effectiveness of the HuR translocation to the cytoplasm. (C) Enucleated and non-enucleated cells were exposed to ActD prior to and during arsenite exposure (300 μM, 45 min). The graph shows the statistical measurement of the ratio of NRK cells displaying stress granules after arsenite exposure for both enucleated and non-enucleated cells with or without ActD. ActD leads to the inhibition of stress granule assembly only in non-enucleated cells. n.s., not significant; **P < 0.01 by t-test (three samples).
Figure 8.
Figure 8.
PKRi induces the translocation of nuclear HuR and reversibly inhibits stress granule assembly independently of the eIF2α phosphorylation level. (A) NRK cells were treated or not with 5 μM PKRi for 1 h prior to and during arsenite exposure (300 μM, 45 min). PKRi-pretreated cells failed to form stress granules and display a pronounced cytoplasmic HuR labeling compared to non-pretreated cells. (B) Representative western blot showing that a PKRi pretreatment as performed in (A) does not reduces the eIF2α phosphorylation level after both arsenite (300 μM, 45 min) or puromycin (2.5 μg/mL)/VER-155008 (10 μM) exposure. As a control, NRK cells were pretreated or not with 5 μM PKRi, exposed to arsenite and immuno-stained with anti-HuR and anti-p-eIF2α (phosphorylated form). (C) NRK cells were exposed to 5 μM PKRi for 1 h prior to and during puromycin (2.5 μg/ml)/VER-155008 (10 μM) exposure. PKRi was then removed from the incubation buffer. Under the continuous exposure to puromycin/VER-155008, YB-1 labeling reveals the progressive formation of stress granules with time. Statistical analyzes illustrate that the mean nuclear–cytoplasmic ratio of HuR intensities (anti-HUR staining) increases with time along with the percentage of stress-granule positive cells upon PKRi removal. Results are mean ± SD (n = 3). n.s., no significant appearance of stress granules. (D) After arsenite exposure (200 μM for 45 min), cells were allowed to recover in the absence of arsenite and then immuno-stained (anti-HuR and anti-YB-1 or anti-TIA-1). Statistical analyzes show the mean nuclear–cytoplasmic ratios of HuR and TIA-1 fluorescence intensities. Arsenite-preconditioning leads to the translocation of nuclear HuR and TIA-1. Results are mean ± SD over five different samples. *P < 0.05; **P < 0.01; by t-test.
Figure 9.
Figure 9.
Schematic view of mRNA homeostasis and its deregulation during stress leading to stress granule assembly. (A) Polysomal mRNA coexists with soluble nonpolysomal RNA. Nonpolysomal mRNA is protected from aggregation via the binding of mRNA-binding stabilizers like YB-1. (B) Cell stress leads to the release of nonpolysomal mRNA and induces the appearance of misfolded proteins. (C) The sudden excess of nonpolysomal mRNA allows aggregation-prone mRNA-binding proteins and (or) misfolded proteins to gain access to mRNA. The nonpolysomal mRNA molecules are too numerous to be protected by mRNA-binding stabilizers. (D) Aggregation of nonpolysomal mRNA takes place in the cytoplasm owing to homo-and heteromultimeric aggregation among aggregation-prone mRNA-binding proteins and misfolded proteins which are bound to mRNA.

References

    1. Weber S.C., Brangwynne C.P. Getting RNA and protein in phase. Cell. 2012;149:1188–1191. - PubMed
    1. Ramaswami M., Taylor J.P., Parker R. Altered ribostasis: RNA-protein granules in degenerative disorders. Cell. 2013;154:727–736. - PMC - PubMed
    1. Updike D., Strome S. P granule assembly and function in Caenorhabditis elegans germ cells. J. Androl. 2010;31:53–60. - PMC - PubMed
    1. Liu-Yesucevitz L., Bassell G.J., Gitler A.D., Hart A.C., Klann E., Richter J.D., Warren S.T., Wolozin B. Local RNA translation at the synapse and in disease. J. Neurosci. 2011;31:16086–16093. - PMC - PubMed
    1. Parker R., Sheth U. P bodies and the control of mRNA translation and degradation. Mol. Cell. 2007;25:635–646. - PubMed

Publication types

MeSH terms