. 2014 Sep;42(15):e118.
doi: 10.1093/nar/gku556. Epub 2014 Jul 10.

Competitive binding-based optical DNA mapping for fast identification of bacteria--multi-ligand transfer matrix theory and experimental applications on Escherichia coli

Affiliations

Competitive binding-based optical DNA mapping for fast identification of bacteria--multi-ligand transfer matrix theory and experimental applications on Escherichia coli

Adam N Nilsson et al. Nucleic Acids Res. 2014 Sep.

Abstract

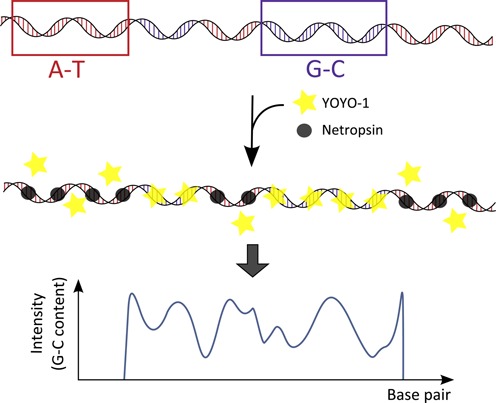
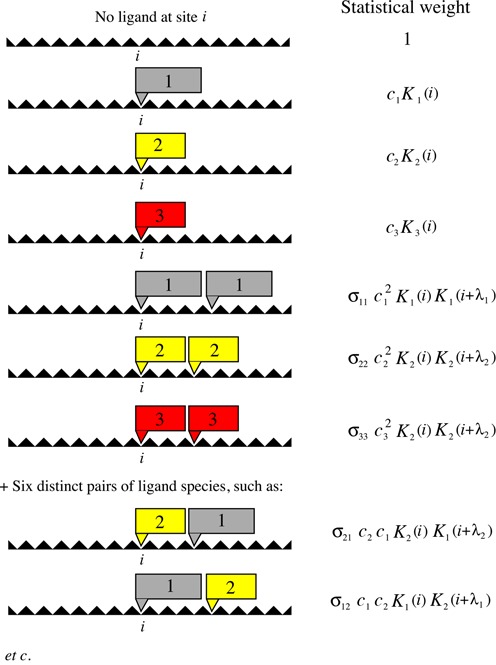
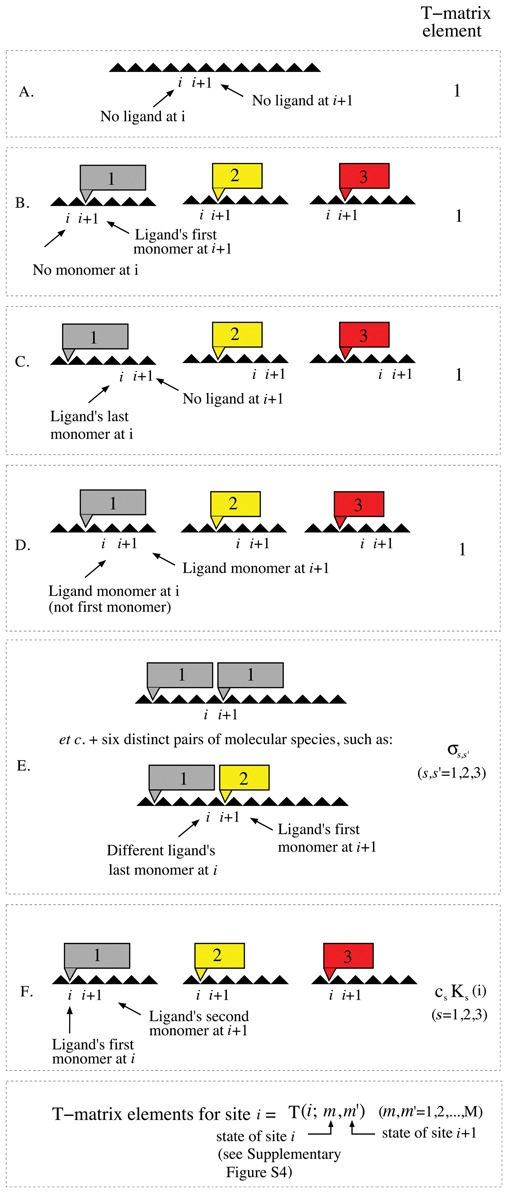
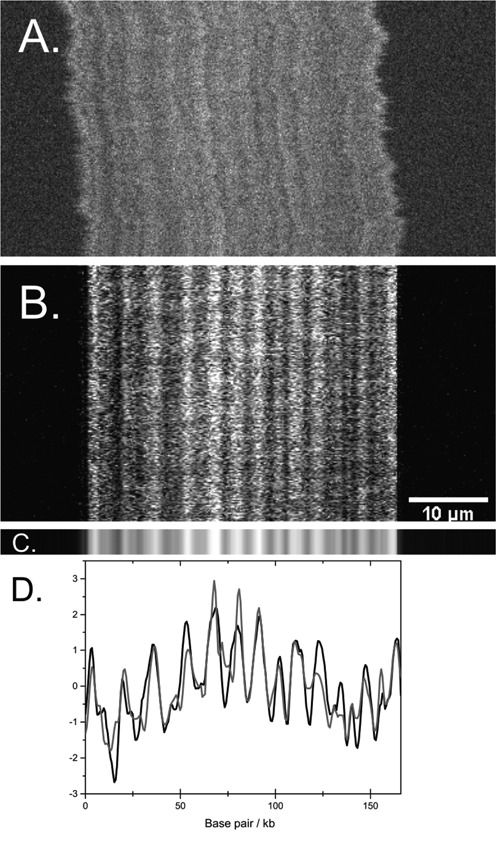
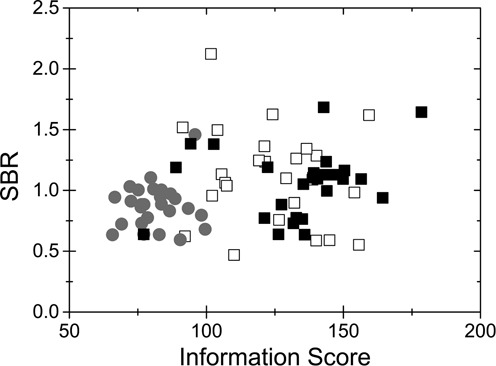
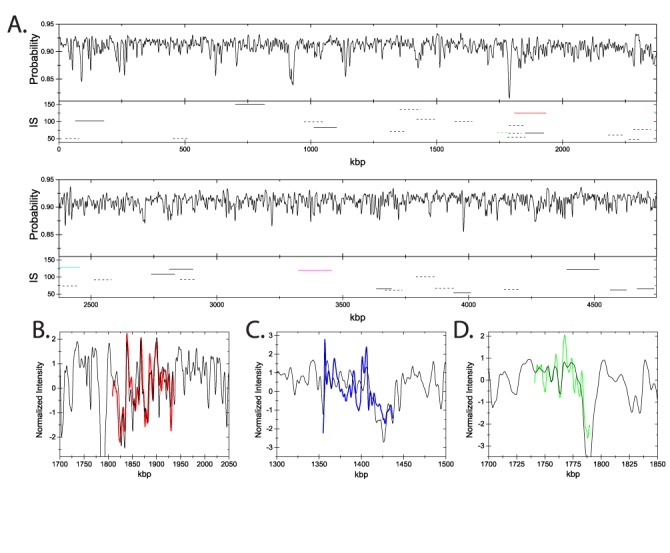
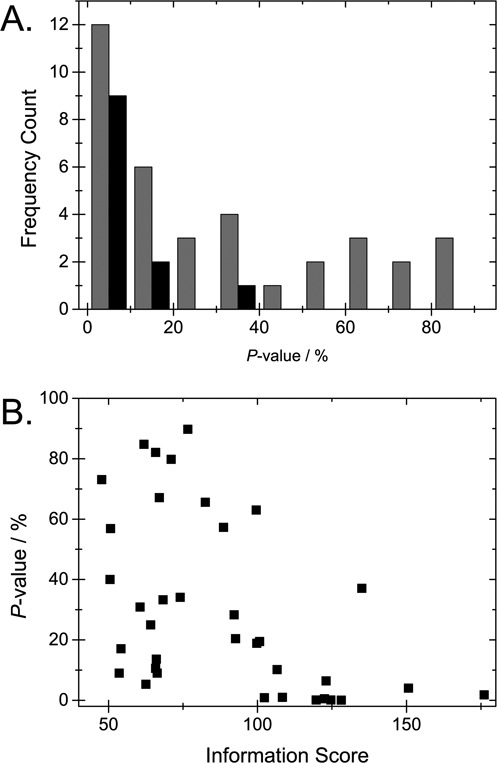
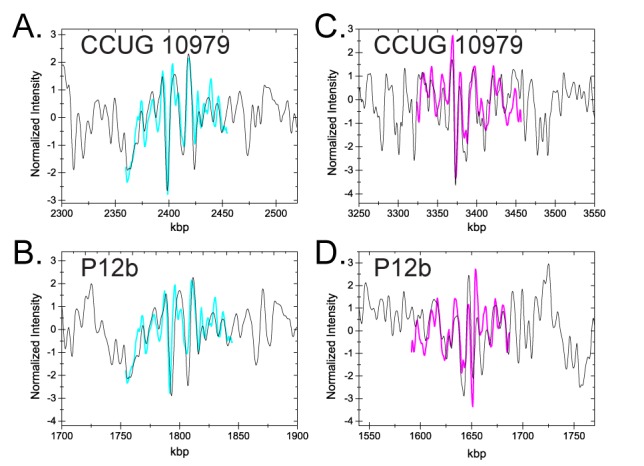
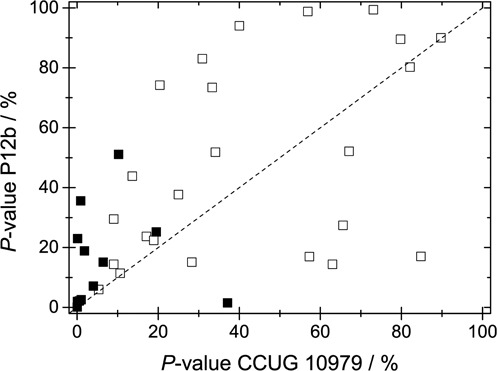
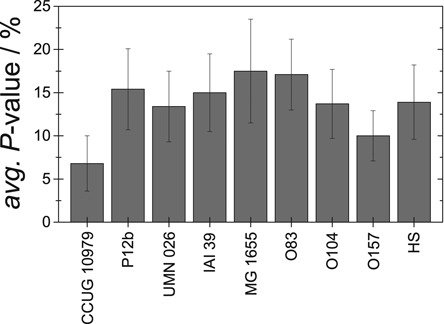
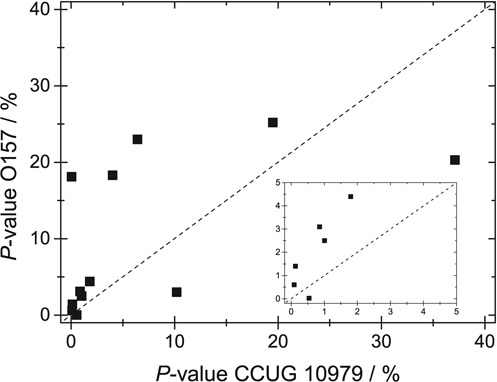
We demonstrate a single DNA molecule optical mapping assay able to resolve a specific Escherichia coli strain from other strains. The assay is based on competitive binding of the fluorescent dye YOYO-1 and the AT-specific antibiotic netropsin. The optical map is visualized by stretching the DNA molecules in nanofluidic channels. We optimize the experimental conditions to obtain reproducible barcodes containing as much information as possible. We implement a multi-ligand transfer matrix method for calculating theoretical barcodes from known DNA sequences. Our method extends previous theoretical approaches for competitive binding of two types of ligands to many types of ligands and introduces a recursive approach that allows long barcodes to be calculated with standard computer floating point formats. The identification of a specific E. coli strain (CCUG 10979) is based on mapping of 50-160 kilobasepair experimental DNA fragments onto the theoretical genome using the developed theory. Our identification protocol introduces two theoretical constructs: a P-value for a best experiment-theory match and an information score threshold. The developed methods provide a novel optical mapping toolbox for identification of bacterial species and strains. The protocol does not require cultivation of bacteria or DNA amplification, which allows for ultra-fast identification of bacterial pathogens.


Figures

Figure 1.
Figure 1.
Schematic illustration of the principle of the CB assay. YOYO-1 (yellow stars) and netropsin (gray circles) are simultaneously added to a DNA with AT- rich (red) and GC-rich (blue) regions. Netropsin binds preferentially to AT-rich regions preventing YOYO-1 to bind to these regions. When stretched in nanofluidic channels the DNA molecules show an emission intensity along the contour that reflects the underlying sequence with bright GC-rich and dark AT-rich regions.
Figure 2.
Figure 2.
List of the different statistical weights for a base-pair i when in contact with bulk consisting of S different ligand species (here, S = 3 for illustrative purposes). The quantity cs (s = 1, ..., S) is the bulk concentration of ligand type s, Ks is the associated binding constant and formula imageformula image are the different cooperativity parameters between the ligands species.
Figure 3.
Figure 3.
Explicit transfer matrix elements for site i in a multi-ligand setting. Conditioned that site i + 1 is in one of its allowed states (see Figure S4 in the Supplementary Information) site i can be in one of the states listed. Associated with each such pair of states (at sites i + 1 and site i) is a transfer matrix element value as given in the figure, and further detailed in Equations (2)–(7) in the Supplementary Information. These results are valid for arbitrary numbers of ligand types, even though we in this figure limit ourselves to three types of ligands (S = 3), for illustrative purposes.
Figure 4.
Figure 4.
(A) Experimental raw kymograph for T4 DNA at 1:150 YOYO:netropsin in 0.05× TBE. Fluorescent images of DNA molecules were recorded at different times (time along the vertical axis). The sample was mixed in 5× TBE and diluted. (B) Aligned kymograph. (C) DNA barcode consisting of 20 lines generated from the average of the experimental kymograph. (D) Comparing the experimental (black) and theoretical (gray) barcodes.
Figure 5.
Figure 5.
Comparing the SBR and IS under three experimental conditions. Gray circles: 0.5× TBE, open squares: 0.05× TBE and full squares: mixed at 5× TBE and diluted to 0.05× TBE. SBR and IS are defined in the Materials and Methods section.
Figure 6.
Figure 6.
(A) The theoretical probability ptheory(i) for YOYO binding to the full genome of E. coli strain CCUG 10979, calculated using the transfer matrix approach discussed in the Materials and Methods section. Horizontal lines represent the location of the best fits of 36 experimental E. coli fragments; the associated IS values are also displayed. Solid horizontal lines correspond to a P-value below 10% and dashed lines have a P-value above 10%. The five colored horizontal lines correspond to traces which are detailed in panels B–D, see also Figure 8. The best fit (colored curves) of three experimental fragments matched to the theoretical trace (black curves): (B) a representative fragment with a large best cross-correlation formula imageformula image value (0.771) and a small P-value (0.09 %); (C) a representative fragment with a small formula imageformula image (0.670) and a large P-value (37.1%); (D) a representative fragment with a large formula imageformula image (0.877) and a large P-value (33.3%). The colors of the fits correspond to the colors of the horizontal lines in (A).
Figure 7.
Figure 7.
(A) Histogram (gray) of P-values obtained when fitting 36 experimental fragments from the E. coli strain CCUG 10979 to its theoretical barcode, and the 12 fragments with an IS above 100 (black). (B) Plot of the IS versus the P-value for the 36 fragments.
Figure 8.
Figure 8.
Fragments fitted to the theoretical genomes of CCUG 10979 and P12b, respectively. (A and B) A fragment with a good fit to both the correct strain CCUG 10979 and the P12b strain. (A) Location of one fragment (cyan curve) on the genome of the correct strain CCUG 10979 (black curve) with a P-value of 0.04% and a best cross correlation value of formula imageformula image. (B) The same fragment as in (A) (cyan) located on strain P12b (black) with a P-value of 0.12% and formula imageformula image. (C and D) A fragment with a good fit to CCUG 10979 and a bad fit to P12b. (C) Location of one fragment (magenta) on the genome of the correct strain CCUG 10979 (black curve) with a P-value of 0.13% and formula imageformula image. (D) The same fragment as in (C) (magenta) located on strain P12b (black) with a P-value of 23% and formula imageformula image.
Figure 9.
Figure 9.
P-value for all 36 fragments (squares) fitted to the correct strain CCUG 10979 (x-axis) and the reference strain P12b (y-axis). The 12 fragments with an IS above 100 are shown as full symbols. The dashed line corresponds to equal values for both strains.
Figure 10.
Figure 10.
Average P-value and standard error for the correct strain (CCUG 10979) as well as the eight reference strains for the 12 fragments with an IS above 100.
Figure 11.
Figure 11.
P-value for the 12 fragments with an IS above 100 when fitted to the correct strain CCUG 10979 (x-axis) and the reference strain O157 (y-axis). The dashed line corresponds to equal values for both strains. The inset shows a zoom in of the data on the low P-value regime.

References

    1. Shendure J., Ji H. Next-generation DNA sequencing. Nat. Biotechnol. 2008;26:1135–1145. - PubMed
    1. Zhou X., Ren L., Meng Q., Li Y., Yu Y., Yu J. The next-generation sequencing technology and application. Protein Cell. 2010;1:520–536. - PMC - PubMed
    1. Schwartz D., Li X., Hernandez L., Ramnarain S., Huff E., Wang Y. Ordered restriction maps of Saccharomyces cerevisiae chromosomes constructed by optical mapping. Science. 1993;262:110–114. - PubMed
    1. Neely R.K., Deen J., Hofkens J. Optical mapping of DNA: Single-molecule-based methods for mapping genomes. Biopolymers. 2011;95:298–311. - PubMed
    1. Latreille P., Norton S., Goldman B.S., Henkhaus J., Miller N., Barbazuk B., Bode H.B., Darby C., Du Z., Forst S., et al. Optical mapping as a routine tool for bacterial genome sequence finishing. BMC Genomics. 2007;8:321. - PMC - PubMed

Publication types

Substances

LinkOut - more resources