

Dynamic conduction and repolarisation changes in early arrhythmogenic right ventricular cardiomyopathy versus benign outflow tract ectopy demonstrated by high density mapping & paced surface ECG analysis
- PMID: 25014132
- PMCID: PMC4094482
- DOI: 10.1371/journal.pone.0099125
Dynamic conduction and repolarisation changes in early arrhythmogenic right ventricular cardiomyopathy versus benign outflow tract ectopy demonstrated by high density mapping & paced surface ECG analysis
Erratum in
- PLoS One. 2014;9(8):e105457
Abstract
Aims: The concealed phase of arrhythmogenic right ventricular cardiomyopathy (ARVC) may initially manifest electrophysiologically. No studies have examined dynamic conduction/repolarization kinetics to distinguish benign right ventricular outflow tract ectopy (RVOT ectopy) from ARVC's early phase. We investigated dynamic endocardial electrophysiological changes that differentiate early ARVC disease expression from RVOT ectopy.
Methods: 22 ARVC (12 definite based upon family history and mutation carrier status, 10 probable) patients without right ventricular structural anomalies underwent high-density non-contact mapping of the right ventricle. These were compared to data from 14 RVOT ectopy and 12 patients with supraventricular tachycardias and normal hearts. Endocardial & surface ECG conduction and repolarization parameters were assessed during a standard S1-S2 restitution protocol.
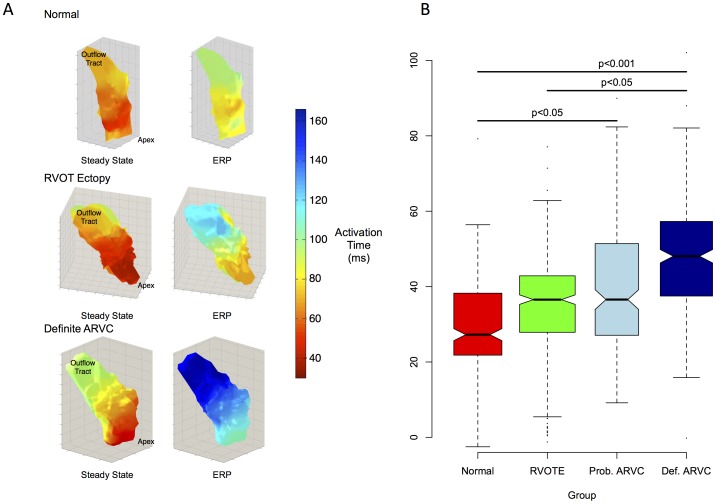
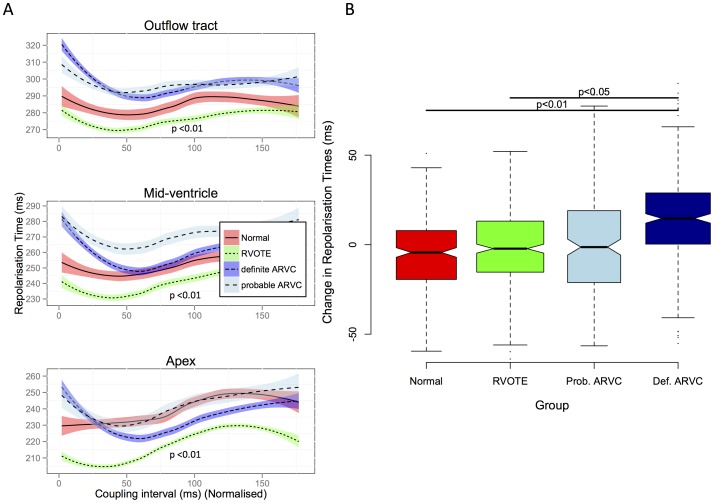
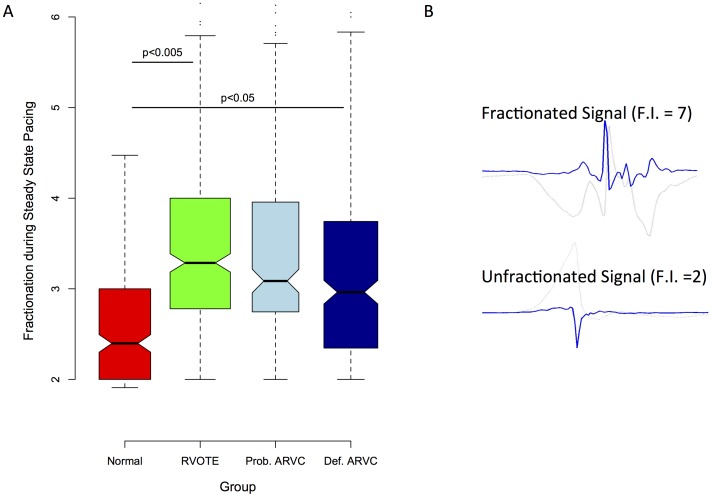
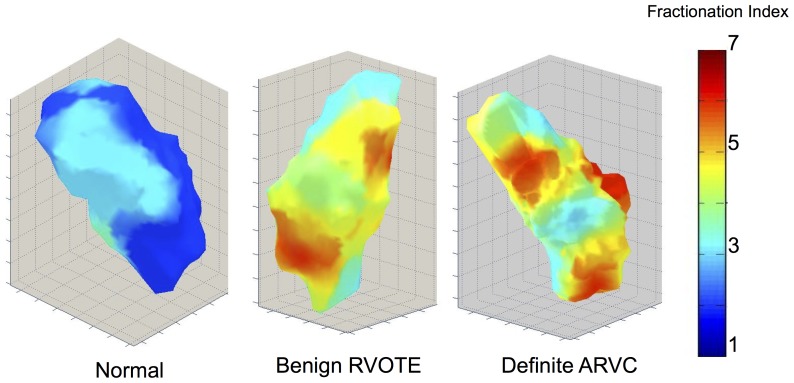
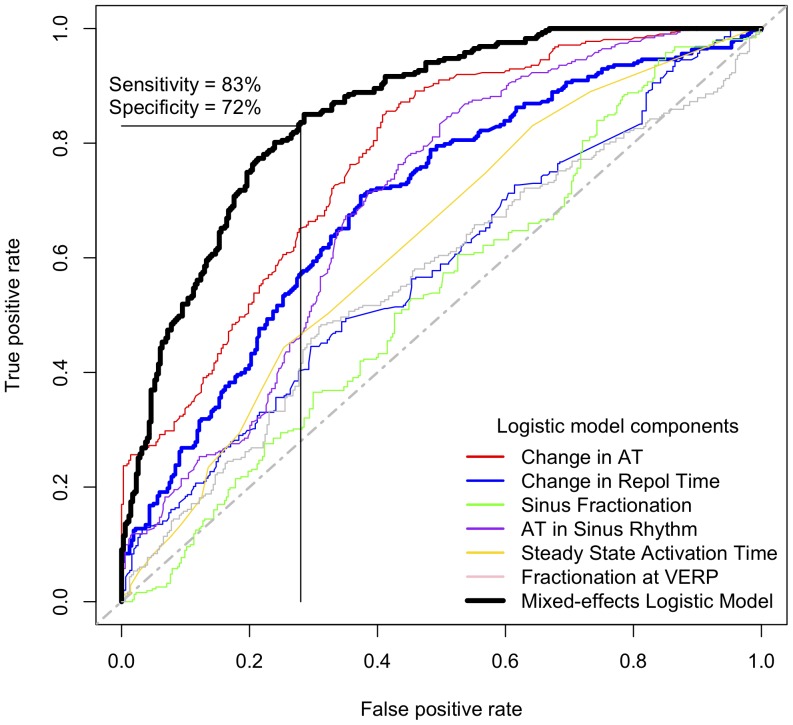
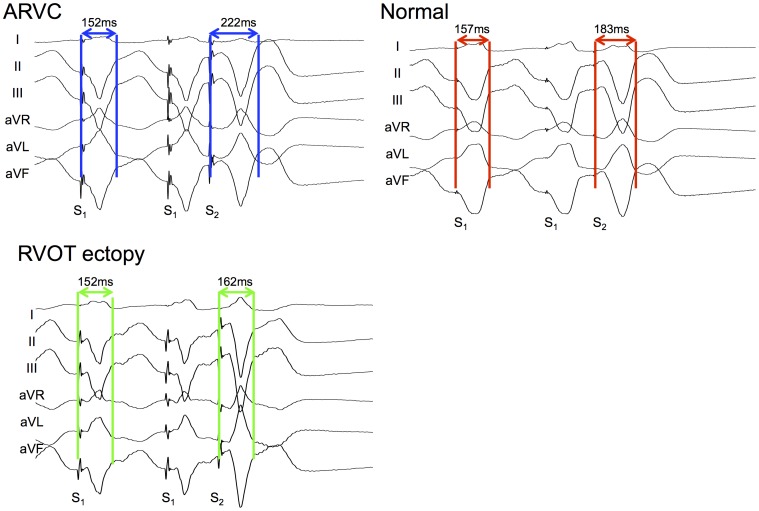
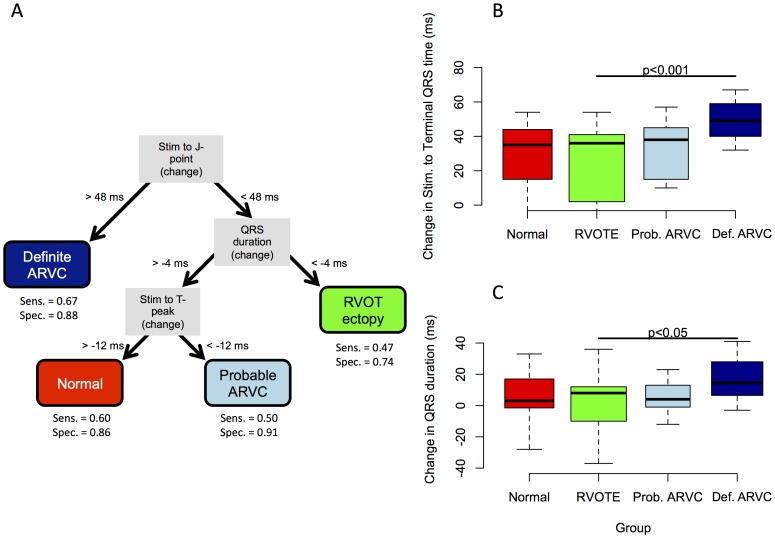
Results: Definite ARVC without RV structural disease could not be clearly distinguished from RVOT ectopy during sinus rhythm or during steady state pacing. Delay in Activation Times at coupling intervals just above the ventricular effective refractory period (VERP) increased in definite ARVC (43 ± 20 ms) more than RVOT ectopy patients (36 ± 14 ms, p = 0.03) or Normals (25 ± 16 ms, p = 0.008) and a progressive separation of the repolarisation time curves between groups existed. Repolarization time increases in the RVOT were also greatest in ARVC (definite ARVC: 18 ± 20 ms; RVOT ectopy: 5 ± 14, Normal: 1 ± 18, p<0.05). Surface ECG correlates of these intracardiac measurements demonstrated an increase of greater than 48 ms in stimulus to surface ECG J-point pre-ERP versus steady state, with an 88% specificity and 68% sensitivity in distinguishing definite ARVC from the other groups. This technique could not distinguish patients with genetic predisposition to ARVC only (probable ARVC) from controls.
Conclusions: Significant changes in dynamic conduction and repolarization are apparent in early ARVC before detectable RV structural abnormalities, and were present to a lesser degree in probable ARVC patients. Investigation of dynamic electrophysiological parameters may be useful to identify concealed ARVC in patients without disease pedigrees by using endocardial electrogram or paced ECG parameters.
Conflict of interest statement
Figures

Similar articles
-
The ventricular ectopic QRS interval (VEQSI): Diagnosis of arrhythmogenic right ventricular cardiomyopathy in patients with incomplete disease expression.Heart Rhythm. 2016 Jul;13(7):1504-12. doi: 10.1016/j.hrthm.2016.03.039. Epub 2016 Mar 22. Heart Rhythm. 2016. PMID: 27016477
-
The Different Substrate Characteristics of Arrhythmogenic Triggers in Idiopathic Right Ventricular Outflow Tract Tachycardia and Arrhythmogenic Right Ventricular Dysplasia: New Insight from Noncontact Mapping.PLoS One. 2015 Oct 21;10(10):e0140167. doi: 10.1371/journal.pone.0140167. eCollection 2015. PLoS One. 2015. PMID: 26488594 Free PMC article.
-
Usefulness of precordial T-wave inversion to distinguish arrhythmogenic right ventricular cardiomyopathy from idiopathic ventricular tachycardia arising from the right ventricular outflow tract.Am J Cardiol. 2010 Jun 15;105(12):1821-4. doi: 10.1016/j.amjcard.2010.01.365. Epub 2010 Apr 27. Am J Cardiol. 2010. PMID: 20538137 Free PMC article.
-
Arrhythmogenic right ventricular cardiomyopathy, clinical manifestations, and diagnosis.Europace. 2016 Jul;18(7):965-72. doi: 10.1093/europace/euv340. Epub 2015 Oct 25. Europace. 2016. PMID: 26498164 Review.
-
Arrhythmogenic Cardiomyopathy in 2018-2019: ARVC/ALVC or Both?Heart Lung Circ. 2019 Jan;28(1):164-177. doi: 10.1016/j.hlc.2018.10.013. Epub 2018 Oct 24. Heart Lung Circ. 2019. PMID: 30446243 Review.
Cited by
-
Hypoxia Promotes Atrial Tachyarrhythmias via Opening of ATP-Sensitive Potassium Channels.Circ Arrhythm Electrophysiol. 2023 Sep;16(9):e011870. doi: 10.1161/CIRCEP.123.011870. Epub 2023 Aug 30. Circ Arrhythm Electrophysiol. 2023. PMID: 37646176 Free PMC article.
-
Epicardial conduction abnormalities in patients with Arrhythmogenic Right Ventricular Cardiomyopathy (ARVC) and mutation positive healthy family members - A study using electrocardiographic imaging.PLoS One. 2023 Jan 5;18(1):e0280111. doi: 10.1371/journal.pone.0280111. eCollection 2023. PLoS One. 2023. PMID: 36603020 Free PMC article.
-
Electrical and Structural Substrate of Arrhythmogenic Right Ventricular Cardiomyopathy Determined Using Noninvasive Electrocardiographic Imaging and Late Gadolinium Magnetic Resonance Imaging.Circ Arrhythm Electrophysiol. 2017 Jul;10(7):e005105. doi: 10.1161/CIRCEP.116.005105. Circ Arrhythm Electrophysiol. 2017. PMID: 28705875 Free PMC article.
-
Differential Wnt-mediated programming and arrhythmogenesis in right versus left ventricles.J Mol Cell Cardiol. 2018 Oct;123:92-107. doi: 10.1016/j.yjmcc.2018.09.002. Epub 2018 Sep 5. J Mol Cell Cardiol. 2018. PMID: 30193957 Free PMC article.
References
-
- Saffitz JE (2009) Arrhythmogenic cardiomyopathy and abnormalities of cell-to-cell coupling. Heart Rhythm 6: S62–5. - PubMed
-
- Cox MG, van der Zwaag PA, van der Werf C, van der Smagt JJ, Noorman M, et al. (2011) Arrhythmogenic right ventricular dysplasia/cardiomyopathy: pathogenic desmosome mutations in index-patients predict outcome of family screening: Dutch arrhythmogenic right ventricular dysplasia/cardiomyopathy genotype-phenotype follow-up study. Circulation 123: 2690–2700. - PubMed
-
- Thiene G, Nava A, Corrado D, Rossi L, Pennelli N (1988) Right ventricular cardiomyopathy and sudden death in young people. N Engl J Med 318: 129–133. - PubMed
Publication types
MeSH terms
Grants and funding
LinkOut - more resources
Full Text Sources
Other Literature Sources
