Reactivation of latent HIV-1 by new semi-synthetic ingenol esters
- PMID: 25014309
- PMCID: PMC4383768
- DOI: 10.1016/j.virol.2014.05.033
Reactivation of latent HIV-1 by new semi-synthetic ingenol esters
Abstract
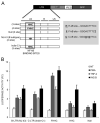
The ability of HIV to establish long-lived latent infection is mainly due to transcriptional silencing of viral genome in resting memory T lymphocytes. Here, we show that new semi-synthetic ingenol esters reactivate latent HIV reservoirs. Amongst the tested compounds, 3-caproyl-ingenol (ING B) was more potent in reactivating latent HIV than known activators such as SAHA, ingenol 3,20-dibenzoate, TNF-α, PMA and HMBA. ING B activated PKC isoforms followed by NF-κB nuclear translocation. As virus reactivation is dependent on intact NF-κB binding sites in the LTR promoter region ING B, we have shown that. ING B was able to reactivate virus transcription in primary HIV-infected resting cells up to 12 fold and up to 25 fold in combination with SAHA. Additionally, ING B promoted up-regulation of P-TEFb subunits CDK9/Cyclin T1. The role of ING B on promoting both transcription initiation and elongation makes this compound a strong candidate for an anti-HIV latency drug combined with suppressive HAART.
Keywords: HIV; Ingenol; Latency; NF-kB; P-TEFb; PKC; Resting cells.
Copyright © 2014 Elsevier Inc. All rights reserved.
Figures


Similar articles
-
Reactivation of HIV latency by a newly modified Ingenol derivative via protein kinase Cδ-NF-κB signaling.AIDS. 2014 Jul 17;28(11):1555-66. doi: 10.1097/QAD.0000000000000289. AIDS. 2014. PMID: 24804860 Free PMC article.
-
An In-Depth Comparison of Latency-Reversing Agent Combinations in Various In Vitro and Ex Vivo HIV-1 Latency Models Identified Bryostatin-1+JQ1 and Ingenol-B+JQ1 to Potently Reactivate Viral Gene Expression.PLoS Pathog. 2015 Jul 30;11(7):e1005063. doi: 10.1371/journal.ppat.1005063. eCollection 2015 Jul. PLoS Pathog. 2015. PMID: 26225566 Free PMC article.
-
Alternate NF-κB-Independent Signaling Reactivation of Latent HIV-1 Provirus.J Virol. 2019 Aug 28;93(18):e00495-19. doi: 10.1128/JVI.00495-19. Print 2019 Sep 15. J Virol. 2019. PMID: 31243131 Free PMC article.
-
Efficient Non-Epigenetic Activation of HIV Latency through the T-Cell Receptor Signalosome.Viruses. 2020 Aug 8;12(8):868. doi: 10.3390/v12080868. Viruses. 2020. PMID: 32784426 Free PMC article. Review.
-
Reactivation of latent HIV by histone deacetylase inhibitors.Trends Microbiol. 2013 Jun;21(6):277-85. doi: 10.1016/j.tim.2013.02.005. Epub 2013 Mar 18. Trends Microbiol. 2013. PMID: 23517573 Free PMC article. Review.
Cited by
-
Current Strategies for Elimination of HIV-1 Latent Reservoirs Using Chemical Compounds Targeting Host and Viral Factors.AIDS Res Hum Retroviruses. 2019 Jan;35(1):1-24. doi: 10.1089/AID.2018.0153. Epub 2018 Dec 12. AIDS Res Hum Retroviruses. 2019. PMID: 30351168 Free PMC article. Review.
-
Latency-Reversing Agents Induce Differential Responses in Distinct Memory CD4 T Cell Subsets in Individuals on Antiretroviral Therapy.Cell Rep. 2019 Nov 26;29(9):2783-2795.e5. doi: 10.1016/j.celrep.2019.10.101. Cell Rep. 2019. PMID: 31775045 Free PMC article.
-
Peering into the HIV reservoir.Rev Med Virol. 2018 Jul;28(4):e1981. doi: 10.1002/rmv.1981. Epub 2018 May 9. Rev Med Virol. 2018. PMID: 29744964 Free PMC article. Review.
-
Small Molecule Inhibitors of BAF; A Promising Family of Compounds in HIV-1 Latency Reversal.EBioMedicine. 2015 Nov 27;3:108-121. doi: 10.1016/j.ebiom.2015.11.047. eCollection 2016 Jan. EBioMedicine. 2015. PMID: 26870822 Free PMC article.
-
Promising Role of Toll-Like Receptor 8 Agonist in Concert with Prostratin for Activation of Silent HIV.J Virol. 2017 Jan 31;91(4):e02084-16. doi: 10.1128/JVI.02084-16. Print 2017 Feb 15. J Virol. 2017. PMID: 27928016 Free PMC article.
References
-
- Aditya S, Gupta S. Ingenol mebutate: a novel topical drug for actinic keratosis. Indian Dermatol. Online J. 2013;4:246–249. http://dx.doi.org/10.4103/2229-5178.115538 - DOI - PMC - PubMed
-
- Archin NM, Espeseth A, Parker D, Cheema M, Hazuda D, Margolis DM. Expression of latent HIV induced by the potent HDAC inhibitor suberoylanilide hydroxamic acid. AIDS Res. Hum. Retrovir. 2009;25:207–212. http://dx.doi.org/10.1089/aid.2008.0191 - DOI - PMC - PubMed
-
- Archin NM, Liberty a L., Kashuba a D., Choudhary SK, Kuruc JD, Crooks a M., Parker DC, Anderson EM, Kearney MF, Strain MC, Richman DD, Hudgens MG, Bosch RJ, Coffin JM, Eron JJ, Hazuda DJ, Margolis DM. Administration of vorinostat disrupts HIV-1 latency in patients on antiretroviral therapy. Nature. 2012;487:482–485. http://dx.doi.org/10.1038/nature11286 - DOI - PMC - PubMed
-
- Bachu M, Yalla S, Asokan M, Verma A, Neogi U, Sharma S, Murali RV, Mukthey AB, Bhatt R, Chatterjee S, Rajan RE, Cheedarla N, Yadavalli VS, Mahadevan A, Shankar SK, Rajagopalan N, Shet A, Saravanan S, Balakrishnan P, Solomon S, Vajpayee M, Satish KS, Kundu TK, Jeang K-T, Ranga U. Multiple NF-κB sites in HIV-1 subtype C long terminal repeat confer superior magnitude of transcription and thereby the enhanced viral predominance. J. Biol. Chem. 2012;287:44714–44735. http://dx.doi.org/10.1074/jbc.M112.397158 - DOI - PMC - PubMed
-
- Bartholomeeusen K, Fujinaga K, Xiang Y, Peterlin BM. Histone deacetylase inhibitors (HDACis) that release the positive transcription elongation factor b (P-TEFb) from its inhibitory complex also activate HIV transcription. J. Biol. Chem. 2013;288:14400–14407. http://dx.doi.org/10.1074/jbc.M113.464834 - DOI - PMC - PubMed
Publication types
MeSH terms
Substances
Grants and funding
LinkOut - more resources
Full Text Sources
Other Literature Sources
Research Materials
Miscellaneous

