Comparative Study
. 2014 Sep;20(9):1386-97.
doi: 10.1261/rna.041954.113. Epub 2014 Jul 11.

Genome-wide analysis of trans-splicing in the nematode Pristionchus pacificus unravels conserved gene functions for germline and dauer development in divergent operons

Affiliations
Comparative Study

Genome-wide analysis of trans-splicing in the nematode Pristionchus pacificus unravels conserved gene functions for germline and dauer development in divergent operons

Amit Sinha et al. RNA. 2014 Sep.

Abstract

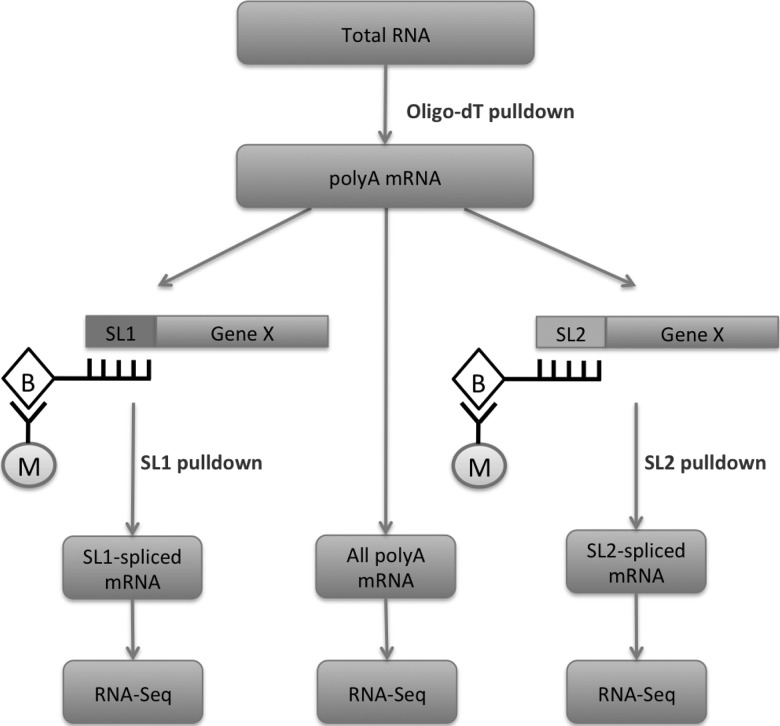
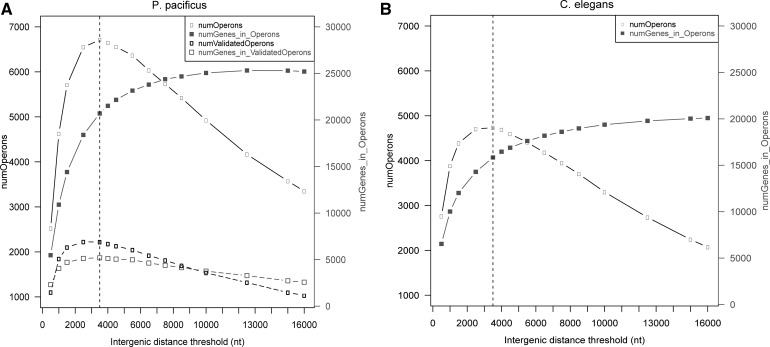
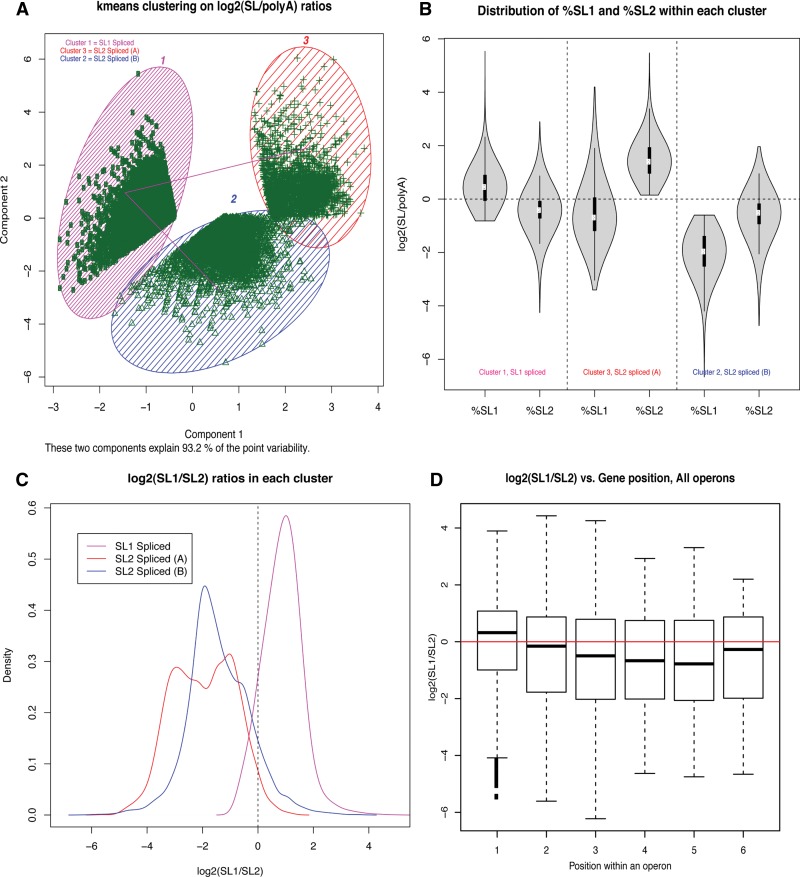
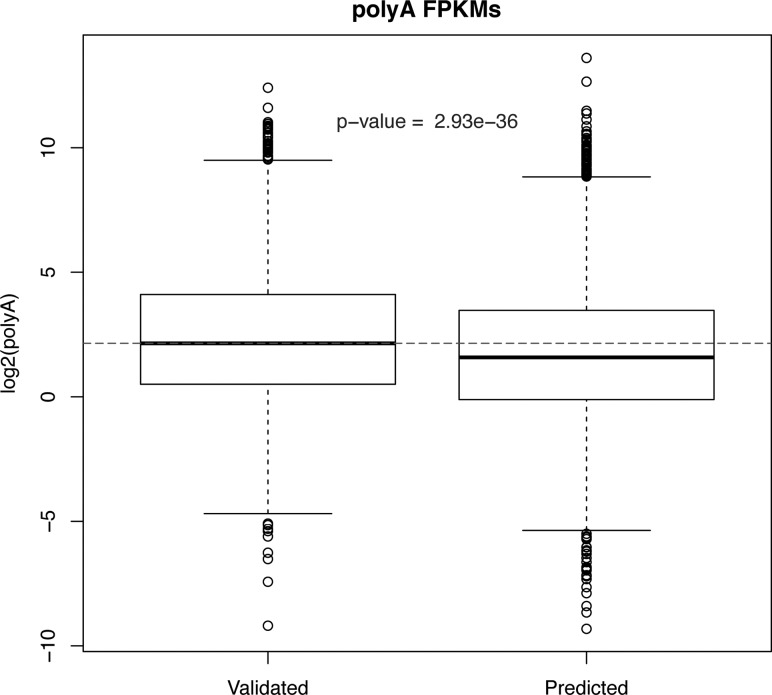
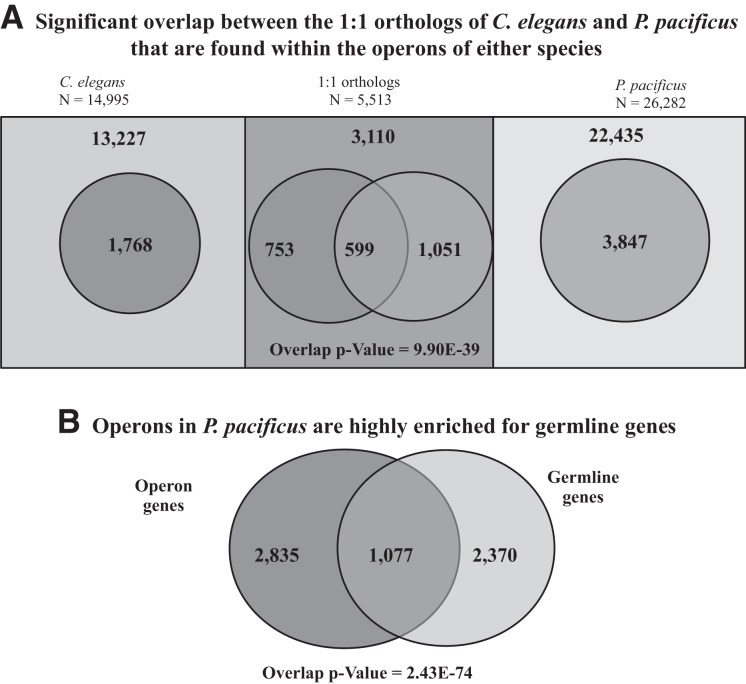
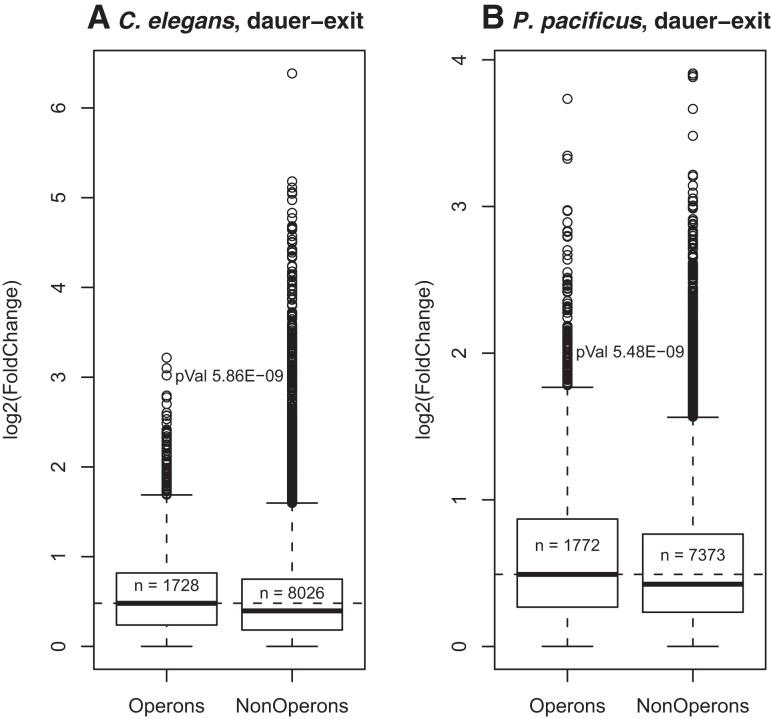
Discovery of trans-splicing in multiple metazoan lineages led to the identification of operon-like gene organization in diverse organisms, including trypanosomes, tunicates, and nematodes, but the functional significance of such operons is not completely understood. To see whether the content or organization of operons serves similar roles across species, we experimentally defined operons in the nematode model Pristionchus pacificus. We performed affinity capture experiments on mRNA pools to specifically enrich for transcripts that are trans-spliced to either the SL1- or SL2-spliced leader, using spliced leader-specific probes. We obtained distinct trans-splicing patterns from the analysis of three mRNA pools (total mRNA, SL1 and SL2 fraction) by RNA-seq. This information was combined with a genome-wide analysis of gene orientation and spacing. We could confirm 2219 operons by RNA-seq data out of 6709 candidate operons, which were predicted by sequence information alone. Our gene order comparison of the Caenorhabditis elegans and P. pacificus genomes shows major changes in operon organization in the two species. Notably, only 128 out of 1288 operons in C. elegans are conserved in P. pacificus. However, analysis of gene-expression profiles identified conserved functions such as an enrichment of germline-expressed genes and higher expression levels of operonic genes during recovery from dauer arrest in both species. These results provide support for the model that a necessity for increased transcriptional efficiency in the context of certain developmental processes could be a selective constraint for operon evolution in metazoans. Our method is generally applicable to other metazoans to see if similar functional constraints regulate gene organization into operons.

Keywords: gene order; genome evolution; operon; trans-splicing.


Figures

FIGURE 1.
FIGURE 1.
Schematic of experiments for obtaining mRNA pools enriched in SL1- or SL2-spliced variants of all expressed genes. Three pools of poly-adenylated RNA were isolated from total RNA: total polyA mRNA, a SL1-spliced mRNA fraction, and a SL2-spliced mRNA fraction. Briefly, biotinylated oligo-dT probes were used to purify the entire polyA-mRNA from total RNA. The mRNA was split into three aliquots, where one of the aliquot was directly used for RNA-seq, while the SL1-spliced or SL2-spliced mRNA was isolated from the remaining two aliquots, using biotinylated oligo probes with sequences complementary to the respective splice leaders. Streptavidin-coated magnetic beads were used to pull down the biotinylated probes.
FIGURE 2.
FIGURE 2.
Effect of different intergenic distance thresholds on the number of predicted operons and the number of genes within operons in P. pacificus (A) and C. elegans (B) suggests an optimal threshold at 3500 nt for predicting operons. The number of predicted operons (left y-axes, black curves with open boxes) in both species initially increases with the maximum intergenic distance allowed between consecutive genes within operons but starts to decrease beyond a 3500-nt cut-off (dotted vertical lines). The total number of genes predicted to be within these operons (right y-axes, gray curves with filled squares) increases with increasing intergenic distance threshold and saturates at ∼13,000 nt when almost all genes become part of predicted operons. In P. pacificus, the number of operons that could be validated using our RNA-seq data (dotted black curve, open black rectangles in A) also show the same trend as predicted operons, with a maximum at 3500 nt. Interestingly, the total number of genes included within these validated operons (dotted gray curve, open gray squares in A) also decreases beyond the 3500-nt threshold, which was thus chosen as the optimal threshold for computational prediction of operonic gene clusters.
FIGURE 3.
FIGURE 3.
Distinct patterns of trans-splicing observed in P. pacificus transcriptome. (A) A k-means clustering on the fraction of SL1 and SL2 splicing for each gene reveals three distinct clusters. (B) A violin plot for the %SL1 and %SL2 for all genes within each of the three clusters shows that genes in Cluster 1 get higher SL1 than SL2, while the opposite is true for genes in Clusters 2 and 3. (C) The same trend is more clearly visible in density plots of relative SL levels (log2(SL1/SL2) for all genes within each of the three clusters. (D) Boxplots for relative trans-splicing levels for all the genes within all predicted operons indicate that the first gene in an operon tends to receive higher levels of SL1 than SL2, although outliers can be seen for all gene positions. Only gene positions 1 to 6 are shown in this plot, but the trend remains the same down to gene position 14, which is the maximum number of genes in an operon.
FIGURE 4.
FIGURE 4.
Genes within predicted operons are expressed at lower levels compared with the genes within operons validated to be of Types 1, 2, or 3.
FIGURE 5.
FIGURE 5.
Conservation of gene content and function between operons of C. elegans and P. pacificus. (A) Significant overlap between the 1:1 orthologs of C. elegans and P. pacificus that are found within the operons of either species (Fisher's test P-value = 9.90 × 10−39). The rectangular boxes represent the set of genes within C. elegans and P. pacificus, and their overlap indicates the 1:1 orthologs (n = 5513). The oval regions represent the corresponding subset of genes that are part of operons in respective species. (B) Operons of Type 1, Type 2, and Type 3 in P. pacificus are highly enriched for germline genes (Fisher's test P-value = 2.43 × 10−74).
FIGURE 6.
FIGURE 6.
Higher fold-change induction of genes inside the annotated/validated operons vs. genes outside of operons, upon dauer-exit in C. elegans (A) and P. pacificus (B).

References

    1. Allen MA, Hillier LW, Waterston RH, Blumenthal T 2011. A global analysis of C. elegans trans-splicing. Genome Res 21: 255–264 - PMC - PubMed
    1. Blaxter M, Liu L 1996. Nematode spliced leaders: ubiquity, evolution and utility. Int J Parasitol 26: 1025–1033 - PubMed
    1. Blumenthal T 1995. Trans-splicing and polycistronic transcription in Caenorhabditis elegans. Trends Genet 11: 132–136 - PubMed
    1. Blumenthal T 2012. Trans-splicing and operons in C. elegans. WormBook Nov 11: 1–11 - PMC - PubMed
    1. Blumenthal T, Gleason KS 2003. Caenorhabditis elegans operons: form and function. Nat Rev Genet 4: 112–120 - PubMed

Publication types