. 2014 Oct;4(10):1168-81.
doi: 10.1158/2159-8290.CD-13-0747. Epub 2014 Jul 11.

A large-scale RNAi-based mouse tumorigenesis screen identifies new lung cancer tumor suppressors that repress FGFR signaling

Affiliations

A large-scale RNAi-based mouse tumorigenesis screen identifies new lung cancer tumor suppressors that repress FGFR signaling

Ling Lin et al. Cancer Discov. 2014 Oct.

Abstract

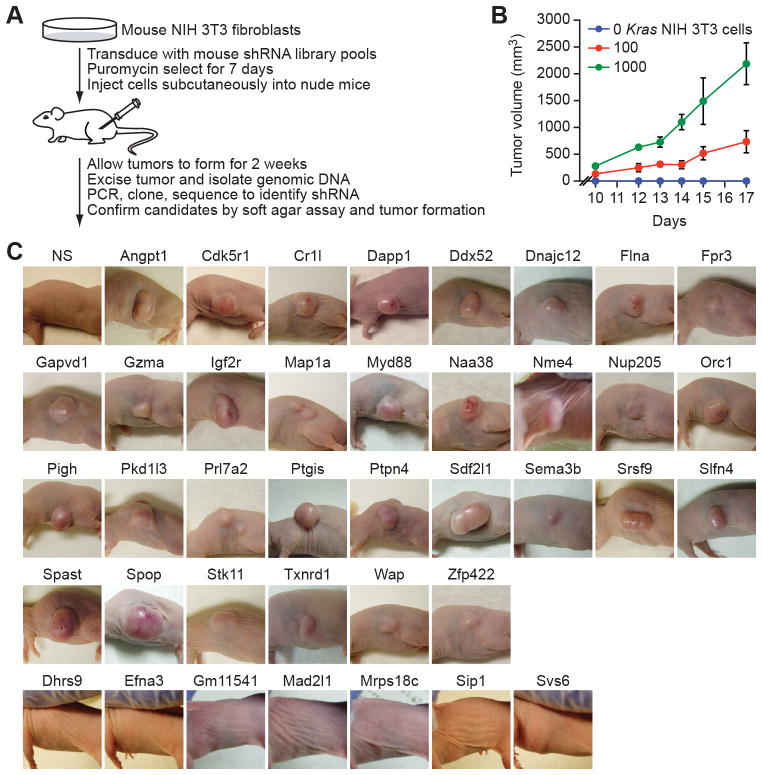
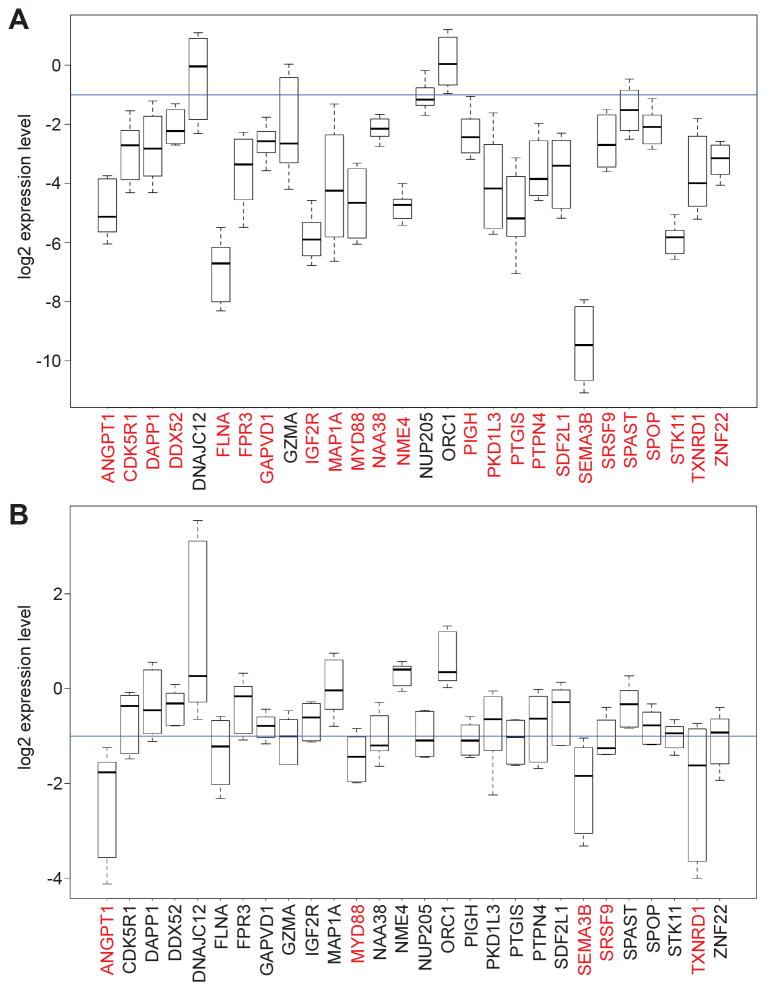
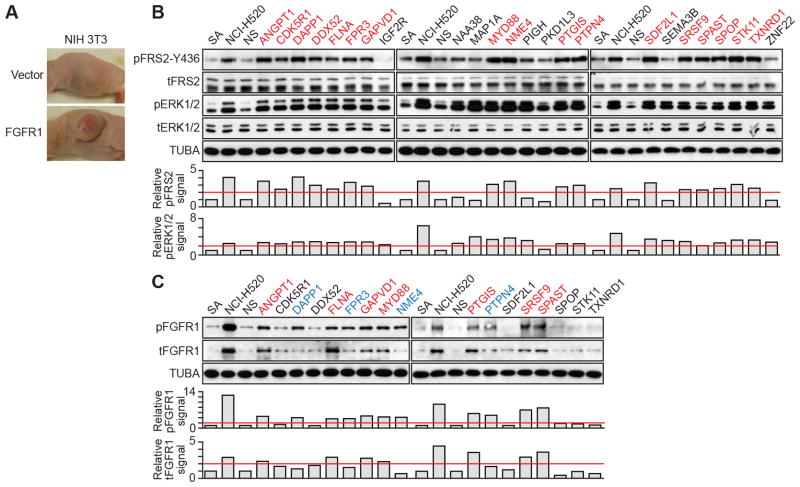
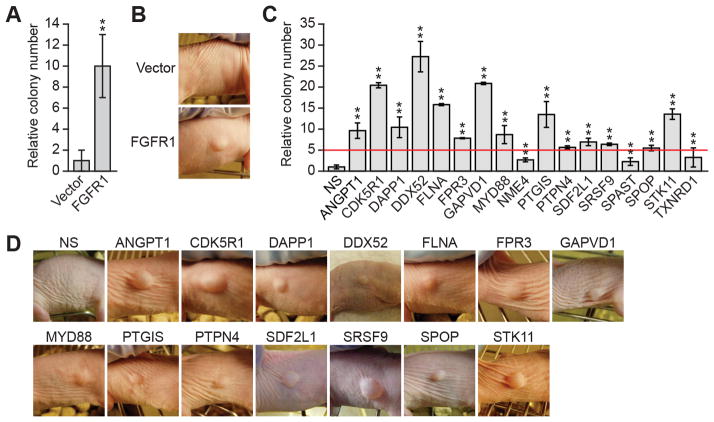
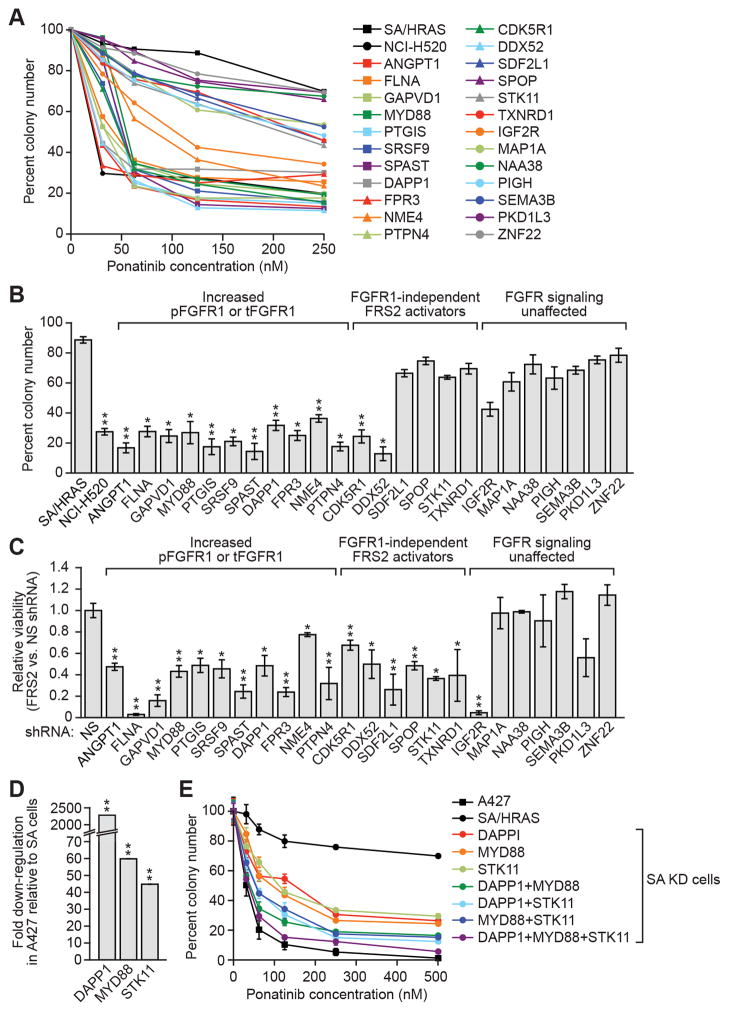
To discover new tumor-suppressor genes (TSG), we developed a functional genomics approach in which immortalized but nontumorigenic cells were stably transduced with large-scale shRNA pools and tested for tumor formation in mice. Identification of shRNAs in resulting tumors revealed candidate TSGs, which were validated experimentally and by analyzing expression in human tumor samples. Using this approach, we identified 24 TSGs that were significantly downregulated in human lung squamous cell carcinomas (hLSCC). Amplification of fibroblast growth factor receptor 1 (FGFR1), which aberrantly increases FGFR signaling, is a common genetic alteration in hLSCCs. Remarkably, we found that 17 of the TSGs encode repressors of FGFR signaling. Knockdown of 14 of these TSGs transformed immortalized human bronchial epithelial cells and, in most cases, rendered them sensitive to FGFR inhibitors. Our results indicate that increased FGFR signaling promotes tumorigenesis in many hLSCCs that lack FGFR1 amplification or activating mutations.

Significance: A functional genomics approach identifies new lung TSGs whose loss aberrantly increases FGFR signaling to promote tumorigenesis. These TSGs are frequently downregulated in hLSCCs, indicating that increased FGFR signaling promotes tumorigenesis in many hLSCCs lacking FGFR1 amplification or activating mutations.


Conflict of interest statement

The authors disclose no potential conflicts of interest.

Disclosure of Potential Conflicts of Interest

No potential conflicts of interest were disclosed by the authors.

Figures

Figure 1
Figure 1
A large-scale shRNA screen identifies candidate TSGs. A, Schematic summary of the screen. B, Tumor formation in mice (n=3) subcutaneously injected with 1×10⁶ cells comprising a mixture of non-transformed NIH 3T3 cells and 0, 100 or 1000 Kras-transformed NIH 3T3 cells. Data are represented as mean ± SD. C, Tumor formation in mice injected with NIH 3T3 knockdown cell lines; tumors were photographed at various time points following injection. NS, non-silencing shRNA control.
Figure 2
Figure 2
Many candidate TSGs are down-regulated in hLSCC samples. A and B, Boxplots displaying log2 fold changes in expression of each TSG in 27 hLSCC samples (A) and 10 human lung adenocarcinoma samples (B) compared with the mean of nine normal lung samples. Boxed areas span the first to the third quartile. Whiskers represent 15th and 85th percentiles; samples falling outside these percentiles have been removed for clarity. The blue line indicates a 2-fold decrease in gene expression. Genes indicated in red are down-regulated >2-fold in ≥70% of the samples analyzed and have a P-value <0.05 (see Methods).
Figure 3
Figure 3
Many of the TSGs encode repressors of FGFR signaling. A, Tumor formation 4 weeks following injection of NIH 3T3 cells expressing FGFR1 or, as a control, empty vector. B and C, (Top) Immunoblots monitoring phosphorylated (p) and total (t) FRS2 and ERK1/2 (B) or FGFR1 (C) in the SA knockdown cell lines and NCI-H520 cells. α-tubulin (TUBA) was monitored as a loading control. (Bottom) Quantification of the immunoblots. The red line indicates a two-fold increase in phospho-protein level relative to that observed in non-silencing (NS) cells, which was set to 1. Genes in red indicate those whose knockdown increases pFRS2-Y436 levels (B) or pFGFR1 and tFGFR1 levels (C); blue, increased pFGFR1 but not tFGFR1 levels; and black, no effect on either pFGFR1 or tFGFR1 levels.
Figure 4
Figure 4
Knockdown of FGFR signaling repressors transforms immortalized HBECs. A, Soft agar assay measuring colony formation of SA cells expressing FGFR1 relative to that obtained with empty vector, which was set to 1. Data are represented as mean ± SD. B, Tumor formation 6 weeks following injection of SA cells expressing FGFR1 or empty vector. C, Soft agar assay measuring colony formation of SA knockdown cell lines relative to that obtained with the non-silencing (NS) shRNA, which was set to 1. Data are represented as mean ± SD. D, Tumor formation in mice injected with SA knockdown cell lines; tumors were photographed at various time points following injection. *P<0.05; **P<0.01.
Figure 5
Figure 5
Knockdown of FGFR signaling repressors sensitizes HBECs to FGFR pharmacological inhibition. A, Soft agar assay measuring colony formation of SA knockdown cells treated with varying concentrations of ponatinib. Colony number was normalized to that obtained in the absence of ponatinib, which was set to 100%. B, Soft agar assay measuring colony formation of SA knockdown cells treated with 125 nM ponatinib, normalized as described in (A). Data are represented as mean ± SD. C, Colony formation assay measuring viability of SA knockdown cells expressing an FRS2 shRNA relative to that obtained with a non-silencing (NS) shRNA. Viability was normalized to that obtained in NS shRNA-expressing cells, which was set to 1. Data are represented as mean ± SD. D, qRT-PCR analysis monitoring expression of DAPP1, MYD88 and STK11 in A427 cells relative to SA cells. Data are represented as mean ± SD (error bars are too small to be visualized). E, Soft agar assay monitoring colony formation of ponatinib-treated SA single, double and triple knockdown (KD) cells, normalized as described in (A). Data are represented as mean ± SD. *P<0.05; **P<0.01.
Figure 6
Figure 6
The splicing regulator SRSF9 represses FGFR signaling through the cytoplasmic adaptor protein SH3BP2. A, Schematic of the RNA-Seq experimental approach and data analysis. B, qRT-PCR analysis monitoring expression of SRSF9, SH3BP2 exon 10 and SH3BP2 exons 7–8 (SH3BP2 total) in SA cells expressing a non-silencing (NS) shRNA or one of two unrelated SRSF9 shRNAs. The results were normalized to expression in NS control cells, which was set to 1. C, Schematic showing splicing of the SH3BP2 gene in NS and SRSF9 knockdown cells, in which exon 10 (yellow) is skipped. Red octagons indicate stop codons. The resulting proteins are also shown. In the truncated protein, the last two exons are shown in purple to indicate an alternate reading frame compared to the full-length protein. D, Immunoblot monitoring levels of SH3BP2 in SA cells expressing an NS or one of two SRSF9 shRNAs. E and F, Immunoblot analysis monitoring levels of tFGFR1 and SH3BP2 in SA cells expressing an SH3BP2 shRNA (E) or overexpressing SH3BP2 (F). G, Co-immunoprecipitation analysis. Left, the FGFR1 immunoprecipitate was immublotted for SH3BP2. Right, the SH3BP2 immunoprecipitate was immunoblotted for FGFR1. The levels of the proteins in the input are shown. H, Soft agar colony formation assay. NIH 3T3 cells expressing a NS shRNA or one of two unrelated SH3BP2 shRNAs were analyzed for their ability to form colonies in soft agar. I, Tumor formation in mice injected with NIH 3T3 cells expressing a NS shRNA or one of two unrelated SH3BP2 shRNAs. J, Model depicting the mechanism by which loss of SRSF9 leads to increased FGFR1 levels. K, Boxplots displaying log2 fold changes in expression of SH3BP2 exon 10 in normal lung samples, 27 hLSCC samples and 10 human lung adenocarcinoma (hLA) samples. Boxed areas span the first to the third quartile. Whiskers represent 15th and 85th percentiles. P<0.05 for hLSCC versus hLA. *P<0.05; **P<0.01.

References

    1. Mardis ER, Wilson RK. Cancer genome sequencing: a review. Hum Mol Genet. 2009;18:R163–8. - PMC - PubMed
    1. Loeb LA. A mutator phenotype in cancer. Cancer Res. 2001;61:3230–9. - PubMed
    1. Esteller M. Epigenetic gene silencing in cancer: the DNA hypermethylome. Hum Mol Genet. 2007;16(Spec No 1):R50–9. - PubMed
    1. Stacey DW, Kung HF. Transformation of NIH 3T3 cells by microinjection of Ha-ras p21 protein. Nature. 1984;310:508–11. - PubMed
    1. Smith MR, Heidecker G, Rapp UR, Kung HF. Induction of transformation and DNA synthesis after microinjection of raf proteins. Mol Cell Biol. 1990;10:3828–33. - PMC - PubMed

Publication types

MeSH terms

Substances