

AMPK activation prevents excess nutrient-induced hepatic lipid accumulation by inhibiting mTORC1 signaling and endoplasmic reticulum stress response
- PMID: 25016145
- PMCID: PMC6408939
- DOI: 10.1016/j.bbadis.2014.07.002
AMPK activation prevents excess nutrient-induced hepatic lipid accumulation by inhibiting mTORC1 signaling and endoplasmic reticulum stress response
Abstract
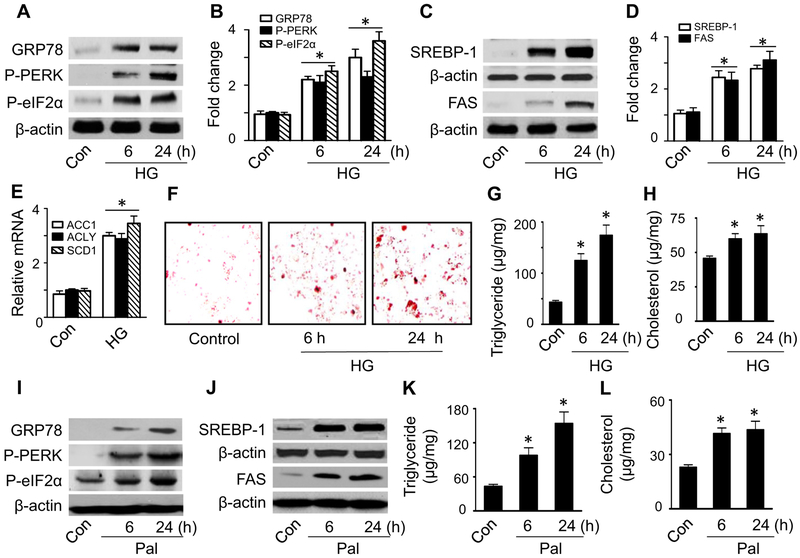
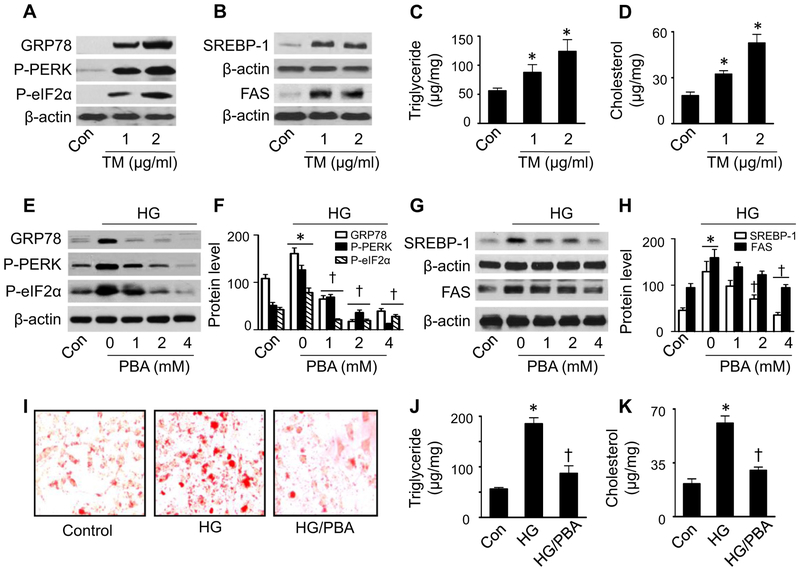
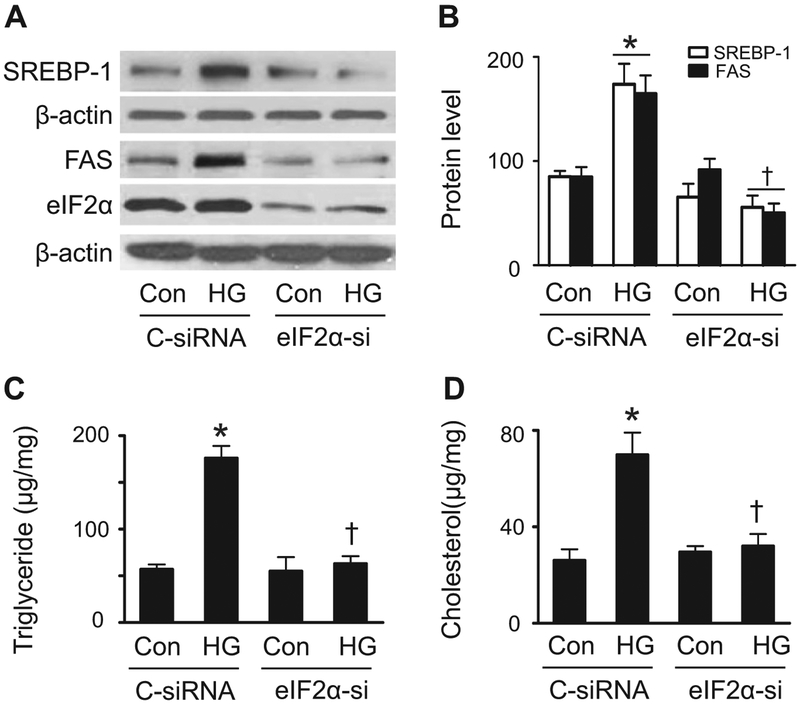
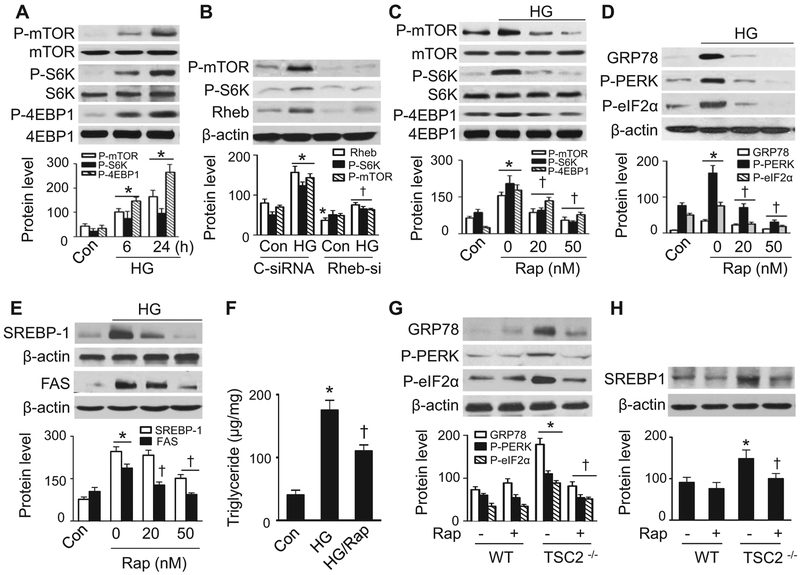
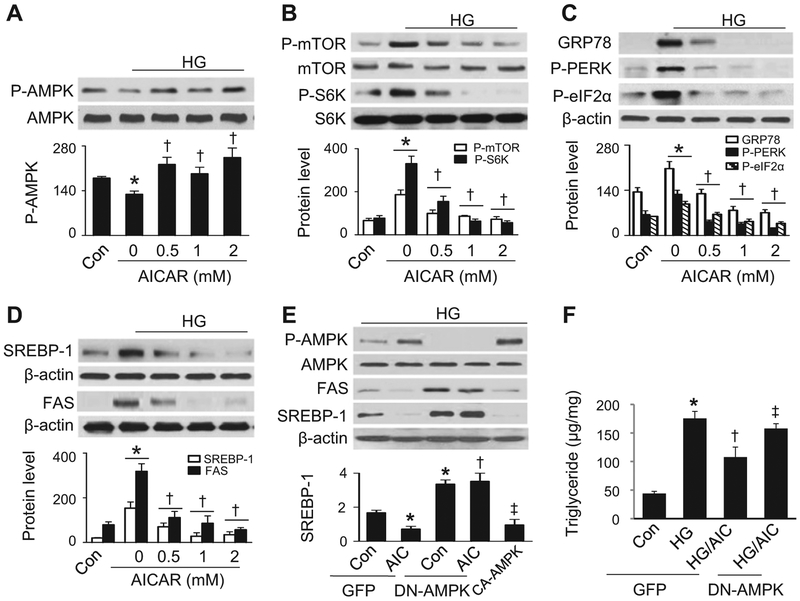
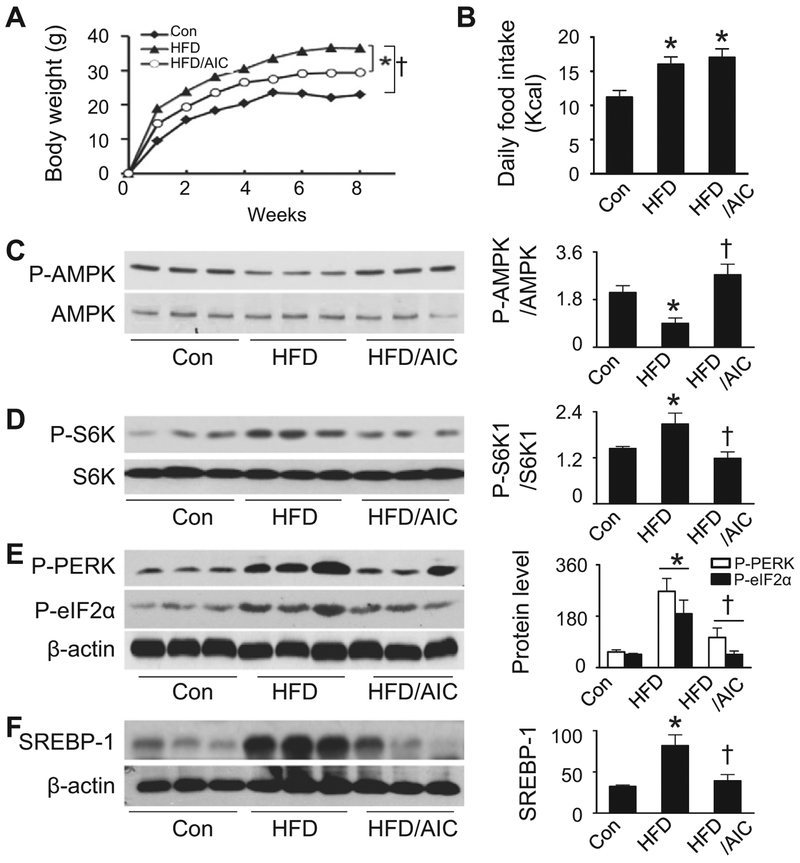
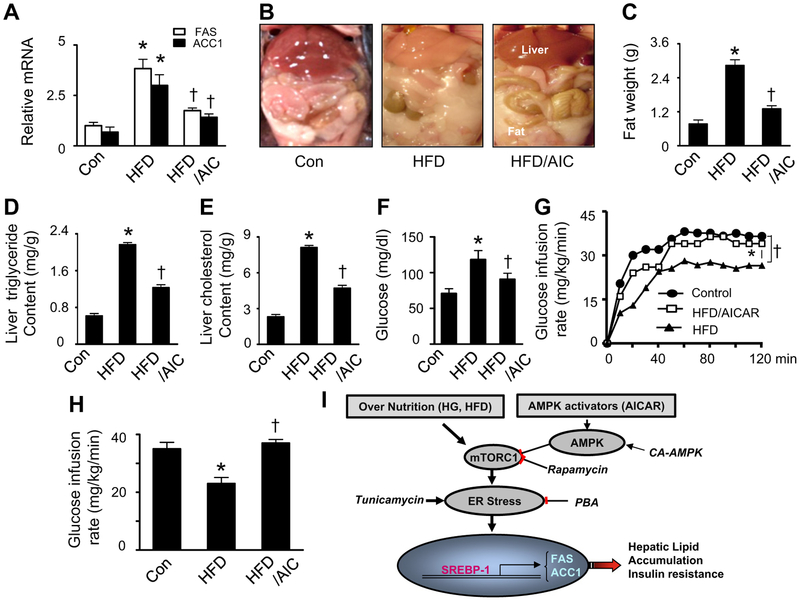
Lipid accumulation is a central event in the development of chronic metabolic diseases, including obesity and type 2 diabetes, but the mechanisms responsible for lipid accumulation are incompletely understood. This study was designed to investigate the mechanisms for excess nutrient-induced lipid accumulation and whether activation of AMP-activated protein kinase (AMPK) prevents the hepatic lipid accumulation in excess nutrient-treated HepG2 cells and high fat diet (HFD)-fed mice. Exposure of HepG2 cells to high levels of glucose or palmitate induced the endoplasmic reticulum (ER) stress response, activated sterol regulatory element-binding protein-1 (SREBP-1), and enhanced lipid accumulation, all of which were sensitive to ER stress inhibitor and gene silencing of eukaryotic initiation factor 2α. The increases in ER stress response and lipid accumulation were associated with activation of mammalian target of rapamycin complex 1 (mTORC1) signaling. Inhibition of mTORC1 signaling attenuated the ER stress response and lipid accumulation induced by high glucose or by deletion of tuberous sclerosis 2. In addition, AMPK activation prevented the mTORC1 activation, ER stress response, and lipid accumulation. This effect was mimicked or abrogated, respectively, by overexpression of constitutively active and dominant-negative AMPK mutants. Finally, treatment of HFD-fed mice with 5-aminoimidazole-4-carboxamide-1-β-4-ribofuranoside inhibited the mTORC1 pathway, suppressed the ER stress response, and prevented insulin resistance and hepatic lipid accumulation. We conclude that activation of AMPK prevents excess nutrient-induced hepatic lipid accumulation by inhibiting mTORC1 and ER stress response.
Keywords: AMPK; ER stress; Lipid accumulation; SREBP; mTORC1.
Copyright © 2014. Published by Elsevier B.V.
Conflict of interest statement
Disclosure statement
No conflicts of interest relevant to this article are reported.
Figures
Similar articles
-
Suppression of the mTORC1/STAT3/Notch1 pathway by activated AMPK prevents hepatic insulin resistance induced by excess amino acids.Am J Physiol Endocrinol Metab. 2014 Jan 15;306(2):E197-209. doi: 10.1152/ajpendo.00202.2013. Epub 2013 Dec 3. Am J Physiol Endocrinol Metab. 2014. Retraction in: Am J Physiol Endocrinol Metab. 2022 Oct 1;323(4):E403. doi: 10.1152/ajpendo.00202.2013_ret. PMID: 24302004 Free PMC article. Retracted.
-
Docosahexaenoic acid inhibits proteolytic processing of sterol regulatory element-binding protein-1c (SREBP-1c) via activation of AMP-activated kinase.Biochim Biophys Acta. 2015 Dec;1851(12):1521-9. doi: 10.1016/j.bbalip.2015.08.007. Epub 2015 Aug 29. Biochim Biophys Acta. 2015. PMID: 26327595
-
β-aminoisobutyric acid attenuates hepatic endoplasmic reticulum stress and glucose/lipid metabolic disturbance in mice with type 2 diabetes.Sci Rep. 2016 Feb 24;6:21924. doi: 10.1038/srep21924. Sci Rep. 2016. PMID: 26907958 Free PMC article.
-
Sestrin2 as a Potential Target for Regulating Metabolic-Related Diseases.Front Endocrinol (Lausanne). 2021 Nov 3;12:751020. doi: 10.3389/fendo.2021.751020. eCollection 2021. Front Endocrinol (Lausanne). 2021. PMID: 34803916 Free PMC article. Review.
-
AMPK--sensing energy while talking to other signaling pathways.Cell Metab. 2014 Dec 2;20(6):939-52. doi: 10.1016/j.cmet.2014.09.013. Epub 2014 Oct 30. Cell Metab. 2014. PMID: 25448702 Free PMC article. Review.
Cited by
-
Research progress in the role and mechanism of Leucine in regulating animal growth and development.Front Physiol. 2023 Nov 17;14:1252089. doi: 10.3389/fphys.2023.1252089. eCollection 2023. Front Physiol. 2023. PMID: 38046946 Free PMC article. Review.
-
Citrus Peel Extract Ameliorates High-Fat Diet-Induced NAFLD via Activation of AMPK Signaling.Nutrients. 2020 Mar 1;12(3):673. doi: 10.3390/nu12030673. Nutrients. 2020. PMID: 32121602 Free PMC article.
-
Astragaloside IV attenuates free fatty acid-induced ER stress and lipid accumulation in hepatocytes via AMPK activation.Acta Pharmacol Sin. 2017 Jul;38(7):998-1008. doi: 10.1038/aps.2016.175. Epub 2017 Mar 27. Acta Pharmacol Sin. 2017. PMID: 28344322 Free PMC article.
-
Exploring the multifaceted role of ginkgolides and bilobalide from Ginkgo biloba in mitigating metabolic disorders.Food Sci Biotechnol. 2024 Jul 10;33(13):2903-2917. doi: 10.1007/s10068-024-01656-3. eCollection 2024 Oct. Food Sci Biotechnol. 2024. PMID: 39234277 Free PMC article. Review.
-
PGC-1α in hepatic UPR during high-fat high-fructose diet and exercise training in mice.Physiol Rep. 2018 Aug;6(15):e13819. doi: 10.14814/phy2.13819. Physiol Rep. 2018. PMID: 30105901 Free PMC article.
References
-
- Fu S, Watkins SM, Hotamisligil GS, The role of endoplasmic reticulum in hepatic lipid homeostasis and stress signaling, Cell Metab. 15 (2012) 623–634. - PubMed
-
- Colgan SM, Tang D, Werstuck GH, Austin RC, Endoplasmic reticulum stress causes the activation of sterol regulatory element binding protein-2, Int. J. Biochem. Cell Biol 39 (2007) 1843–1851. - PubMed
-
- Um SH, D’Alessio D, Thomas G, Nutrient overload, insulin resistance, and ribosomal protein S6 kinase 1, S6K1, Cell Metab. 3 (2006) 393–402. - PubMed
Publication types
MeSH terms
Substances
Grants and funding
- HL074399/HL/NHLBI NIH HHS/United States
- R01 HL089920/HL/NHLBI NIH HHS/United States
- HL080499/HL/NHLBI NIH HHS/United States
- R01 HL137371/HL/NHLBI NIH HHS/United States
- HL079584/HL/NHLBI NIH HHS/United States
- R01 HL142287/HL/NHLBI NIH HHS/United States
- R01 HL079584/HL/NHLBI NIH HHS/United States
- R01 HL140954/HL/NHLBI NIH HHS/United States
- 1P20RR024215-01/RR/NCRR NIH HHS/United States
- R01 HL096032/HL/NHLBI NIH HHS/United States
- R01 HL132500/HL/NHLBI NIH HHS/United States
- HL096032/HL/NHLBI NIH HHS/United States
- R01 HL128014/HL/NHLBI NIH HHS/United States
- R01 HL074399/HL/NHLBI NIH HHS/United States
- HL089920/HL/NHLBI NIH HHS/United States
- R01 HL110488/HL/NHLBI NIH HHS/United States
- R01 HL105157/HL/NHLBI NIH HHS/United States
- P20 RR024215/RR/NCRR NIH HHS/United States
- R01 HL080499/HL/NHLBI NIH HHS/United States
LinkOut - more resources
Full Text Sources
Other Literature Sources
Research Materials
