. 2014 Sep 15;462(3):475-87.
doi: 10.1042/BJ20140620.

Effects of metformin and other biguanides on oxidative phosphorylation in mitochondria

Affiliations

Effects of metformin and other biguanides on oxidative phosphorylation in mitochondria

Hannah R Bridges et al. Biochem J. .

Abstract

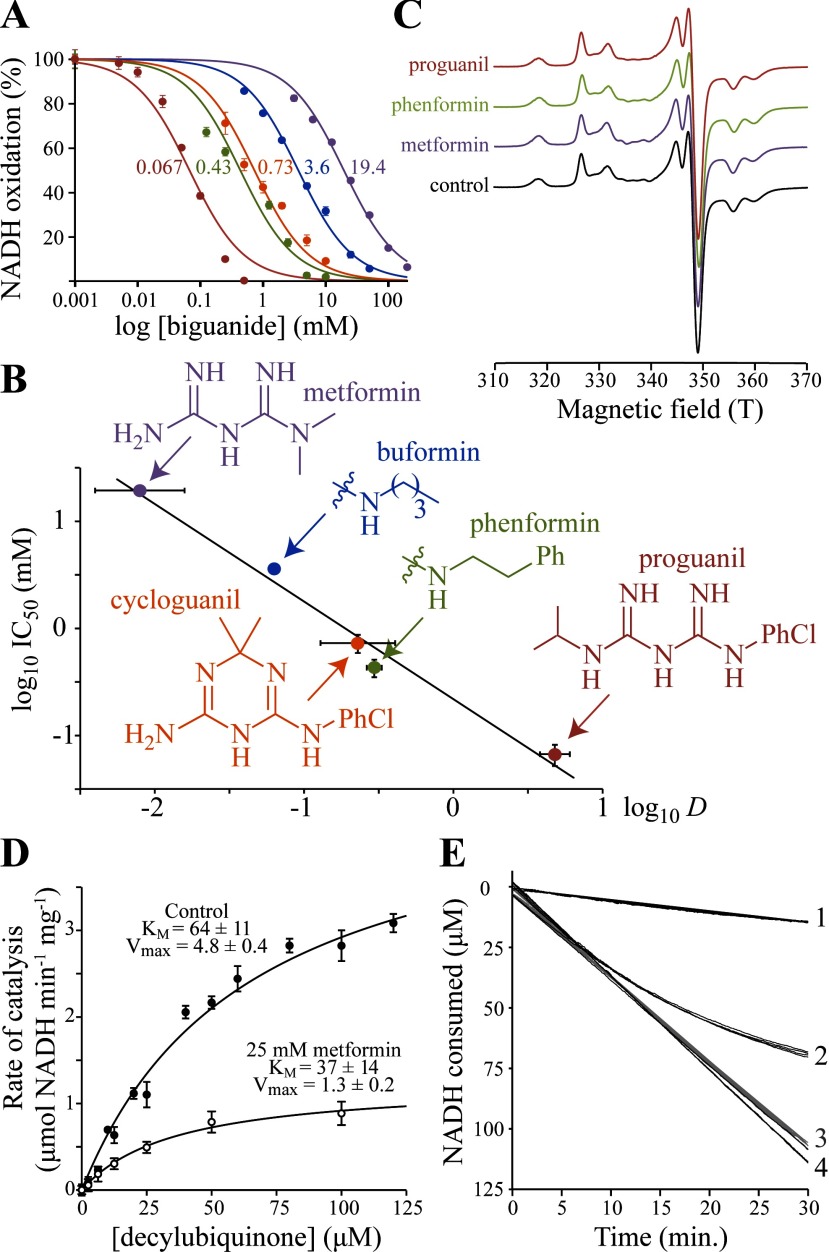
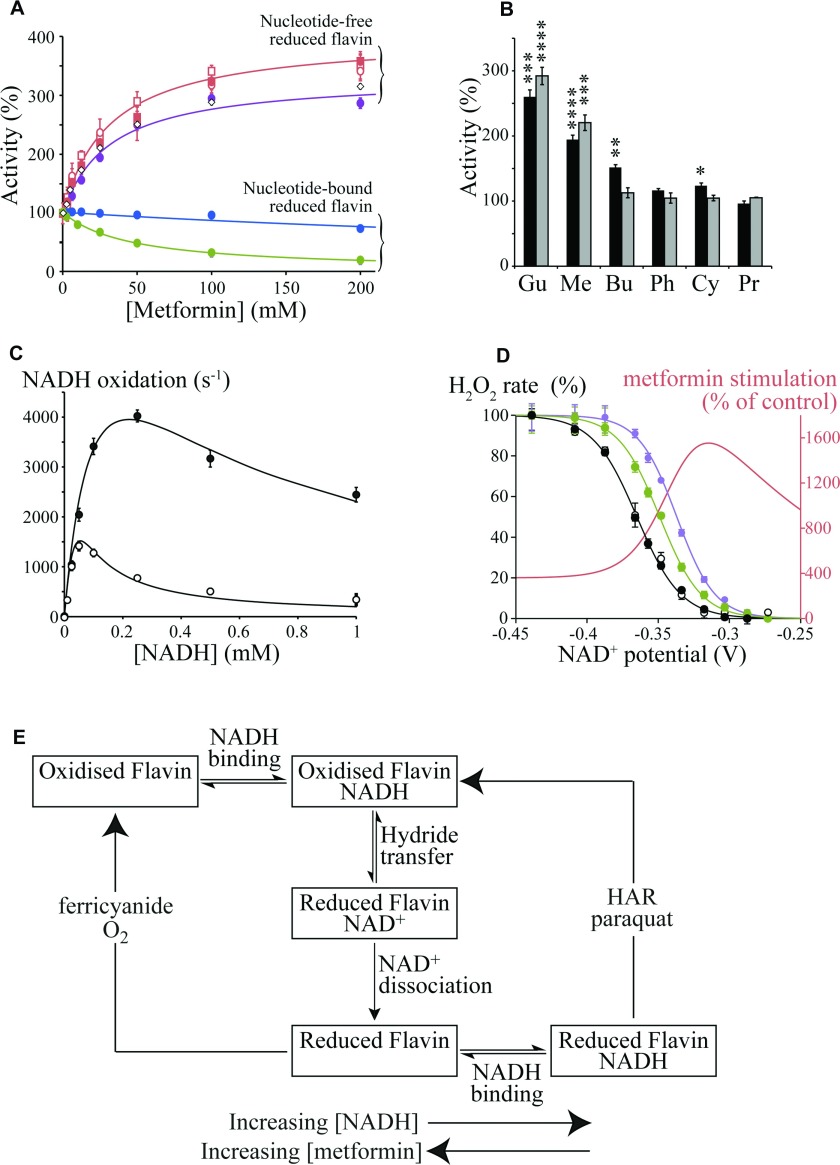
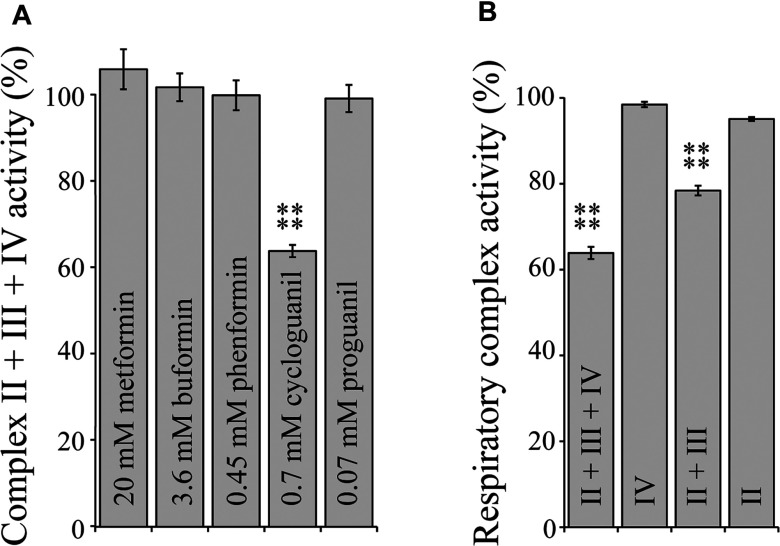
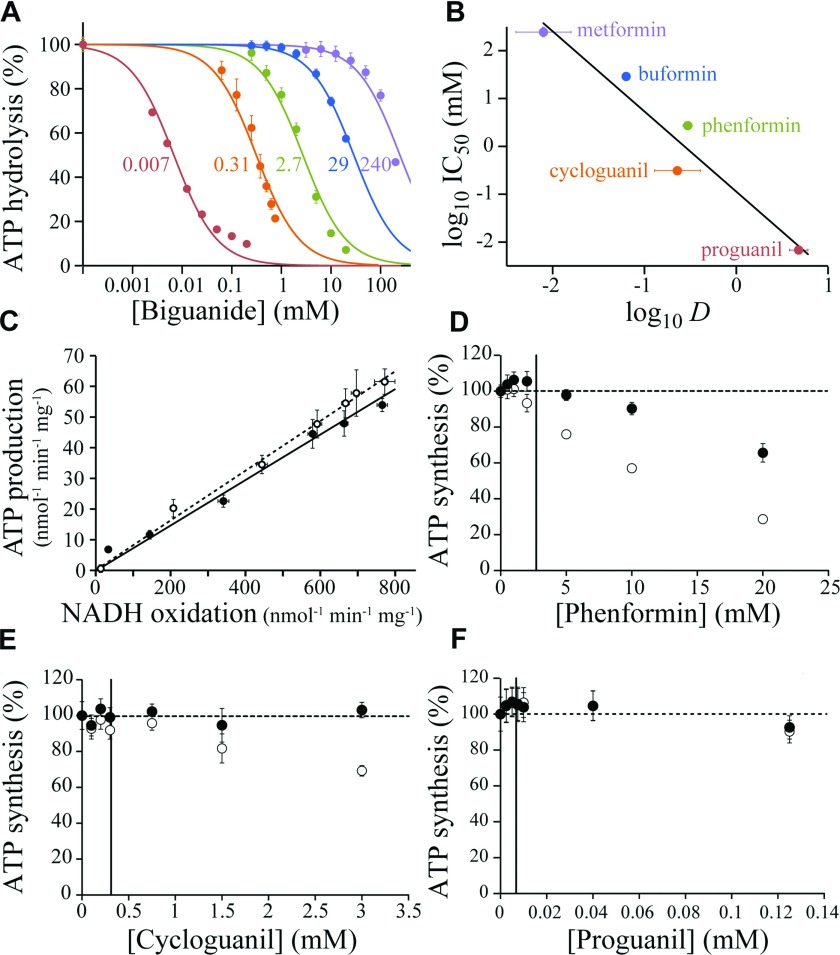
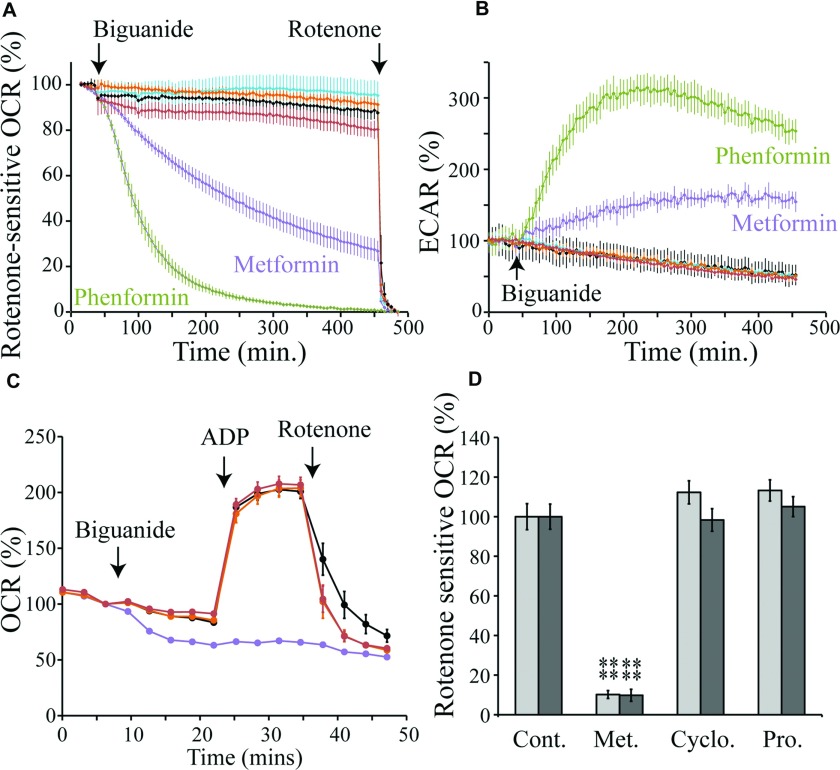
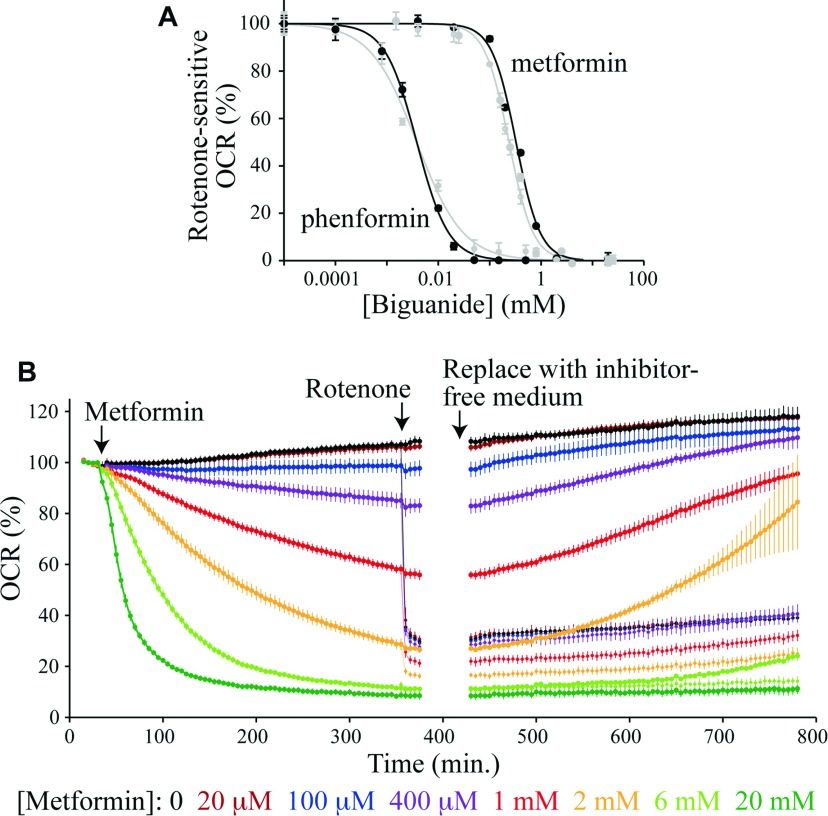
The biguanide metformin is widely prescribed for Type II diabetes and has anti-neoplastic activity in laboratory models. Despite evidence that inhibition of mitochondrial respiratory complex I by metformin is the primary cause of its cell-lineage-specific actions and therapeutic effects, the molecular interaction(s) between metformin and complex I remain uncharacterized. In the present paper, we describe the effects of five pharmacologically relevant biguanides on oxidative phosphorylation in mammalian mitochondria. We report that biguanides inhibit complex I by inhibiting ubiquinone reduction (but not competitively) and, independently, stimulate reactive oxygen species production by the complex I flavin. Biguanides also inhibit mitochondrial ATP synthase, and two of them inhibit only ATP hydrolysis, not synthesis. Thus we identify biguanides as a new class of complex I and ATP synthase inhibitor. By comparing biguanide effects on isolated complex I and cultured cells, we distinguish three anti-diabetic and potentially anti-neoplastic biguanides (metformin, buformin and phenformin) from two anti-malarial biguanides (cycloguanil and proguanil): the former are accumulated into mammalian mitochondria and affect oxidative phosphorylation, whereas the latter are excluded so act only on the parasite. Our mechanistic and pharmacokinetic insights are relevant to understanding and developing the role of biguanides in new and existing therapeutic applications, including cancer, diabetes and malaria.


Figures

Figure 1
Figure 1. Effects of biguanides on isolated bovine complex I
(A) Dependence of NADH oxidation on biguanide concentration, relative to a biguanide-free control. Colours are as in (B), and the IC50 values (in mM) are noted. Data points are means±S.E.M. (n=3–5). (B) Relationship between the inhibition IC50 values and octanol:PBS distribution coefficient (D) values of the biguanides. IC50 values are in mM with 95% confidence intervals; log D values are means±S.E.M. (n=3). Linear fit with R2=0.963. Biguanide structures shown are for the neutral forms. (C) 12 K EPR spectra of the FeS clusters in complex I in the presence and absence of biguanides. Ph, phenyl; PhCl, para-chlorophenyl. (D) The effect of 25 mM metformin on NADH:decylubiquinone oxidoreduction, presented as the measurement of KM for decylubiquinone. The data (means±S.E.M.; n=3) were fit using the Michaelis–Menten equation. (E) Metformin inhibition of NADH oxidation by SMPs (4.5 μg protein/ml). Trace 1, 100 mM metformin added before initiation of catalysis by 200 μM NADH at t=0. Trace 2, catalysis initiated by 200 μM NADH 10 min before the addition of 100 mM metformin at t=0. Traces 3 and 4, controls for 1 and 2, with NaCl instead of metformin. Four traces are overlaid for each condition.
Figure 2
Figure 2. Biguanide effects on the flavin site of complex I
(A) Effects of metformin on flavin site reactions that require nucleotide binding to the reduced flavin [NADH:HAR (blue) and NADH:paraquat (green) oxidoreduction] [27], and nucleotide-free reduced flavin [NADH:FeCN (purple) and NADH:O2 (red) oxidoreduction] [26]. NADH:O2 oxidoreduction (H2O2 production) was detected directly (by NADH oxidation, circles) or as H2O2 by the Amplex Red assay (squares) [15], with/without (open/closed symbols respectively) 1 μM rotenone. Data for H2O2 production by subcomplex Iλ are shown as open diamonds (◇). Data points are means±S.E.M., n=3–5. (B) Stimulation of flavin-site reactions, measured at the inhibitory IC50 concentrations (black, H2O2 production measured using Amplex Red; grey, NADH:FeCN oxidoreduction). Gu, 25 mM guanidinium; Me, 25 mM metformin; Bu, 5 mM buformin; Ph, 0.5 mM phenformin; Cy, 0.7 mM cycloguanil; Pr, 0.05 mM proguanil. Data are presented as means±S.E.M., n=3–5. (C) NADH-dependence of NADH:FeCN catalysis by isolated bovine complex I. ●, 100 mM metformin; ○, control. Data points are means±S.E.M., n=3–5 and data were fit as described previously [26] with KMNADH=220 μM, kcatNADH=1500 s−1, kcatFeCN=3.7×10⁷ M−1·s−1 and KNADHRed (the dissociation constant for NADH binding to the reduced flavin)=KNADHSemi=11 μM (control) or 181 μM (metformin). (D) Dependence of H2O2 production on the NAD+ potential, set by the Nernst equation with 30 μM NADH and variable NAD+ [15]. Control [with (●) and without (○) 200 mM NaCl], 20 mM phenformin (green) and 200 mM metformin (purple). Data points are means±S.E.M., n=3–5. The stimulation of H2O2 production by metformin (red) is also represented as the non-normalized percentage activity relative to the control (see A for the effect of metformin in NADH only). (E) Simplified scheme illustrating how metformin affects the different flavin site reactions differently. The boxes represent different states of the complex I flavin site, with the flavin oxidized or reduced, and with or without NADH or NAD+ bound.
Figure 3
Figure 3. Biguanide interactions with respiratory complexes II, III and IV
(A) Rates of complex II + III + IV activity in bovine SMPs measured by a coupled enzyme assay [28] in the presence of biguanide concentrations equivalent to IC50 for NADH:decylubiquinone catalysis. Results are means±S.E.M. as a percentage of the biguanide-free control, n=3–4. (B) Rates of respiratory complex activity in the presence of 0.7 mM cycloguanil as a percentage of their respective cycloguanil-free controls. ****P<0.0001.
Figure 4
Figure 4. Biguanide inhibition of F1F0-ATP synthase in bovine SMPs
(A) Inhibition of ATP hydrolysis by SMPs (colours as in B). Data points are means±S.E.M., n=3–5, and IC50 values are indicated in mM. (B) Relationship between the IC50 values for ATP hydrolysis and the log D values. IC50 values are in mM with 95% confidence intervals; log D values are means±S.E.M., n=3. Linear fit with R2=0.948. (C) Relative inhibition of ATP production in SMPs in the presence of piericidin A (○) or metformin (●). ATP synthesis was driven using 200 μM NADH; NADH oxidation was measured spectroscopically, and the concentration of ATP determined after 3.5 min (during this time a linear rate is observed). NADH oxidation rates were adjusted using 0–50 nM piericidin A or 0–250 mM metformin, with the ionic strength kept constant at 250 mM using NaCl. (DF) Dose-dependent effects of biguanides on succinate-driven ATP production. Data points are means±S.E.M., n=3, as a percentage of ATP production in the absence of biguanide. ATP concentrations were determined after 3.5 min (○) then corrected for the rate of succinate oxidation, detected spectroscopically using a coupled assay system [28] (●). The IC50 values for hydrolysis are marked with vertical lines.
Figure 5
Figure 5. Selective uptake of biguanides into mitochondria
(A) Effects of biguanides on the rotenone-sensitive OCR of Hep G2 cells. The traces are the means±S.D. of multiple traces. The biguanide concentrations are equal to the complex I IC50/10 values. Purple, 1.9 mM metformin; green, 0.04 mM phenformin; orange, 0.07 mM cycloguanil added in DMSO; red, 0.007 mM proguanil in DMSO; black, control (no biguanide); cyan, control (DMSO). (B) The effects of biguanides on the ECAR of Hep G2 cells. Conditions and colours as in (A). (C) Mitochondrial respiratory coupling test on 143B cells permeabilized with 2 nM PMP, respiring on pyruvate and malate and using biguanides at concentrations equal to their complex I IC50/10 values. Black, control; purple, 2 mM metformin; orange, 0.07 mM cycloguanil; red, 0.007 mM proguanil. Data points are means±S.E.M., n=5–6. (D) Rates of rotenone-sensitive ADP-stimulated NADH-linked respiration in permeabilized 143B cells (light grey) and rat liver mitochondria (dark grey) after 15 min of incubation with 2 mM metformin (Met.), 0.07 mM cycloguanil (Cyclo.) or 0.007 mM proguanil (Pro.). Values are mean percentage of the control±S.E.M., n=5–6. ****P< 0.01. Cont. control.
Figure 6
Figure 6. Biguanide effects on cells in culture: accumulation and reversibility
(A) The normalized rotenone-sensitive OCR 6 h after the addition of metformin or phenformin to Hep G2 (black) or 143B (grey) cells. Results are means±S.E.M., n=3–4. The IC50 values (with 95% confidence intervals) are metformin, 240±10 μM (143B) and 330±20 μM (Hep G2); phenformin, 3.9±1.0 μM (143B) and 3.8±0.4 μM (Hep G2). (B) Metformin inhibition of the OCR by Hep G2 cells. Results are means of multiple traces±S.E.M., n=3–4. Rotenone (200 nM) was added to half of the samples part way through the experiment; pairs of traces with and without rotenone are coloured the same. Then, the assay medium in each experiment was exchanged for a metformin and rotenone-free medium. All data were measured using a Seahorse Extracellular Flux Analyzer at 37°C.

Comment in

References

    1. Shaw R. J., Lamia K. A., Vasquez D., Koo S.-H., Bardeesy N., DePinho R. A., Montminy M., Cantley L. C. The kinase LKB1 mediates glucose homeostasis in liver and therapeutic effects of metformin. Science. 2005;310:1642–1646. doi: 10.1126/science.1120781. - DOI - PMC - PubMed
    1. Miller R. A., Chu Q., Xie J., Foretz M., Viollet B., Birnbaum M. J. Biguanides suppress hepatic glucagon signalling by decreasing production of cyclic AMP. Nature. 2013;494:256–260. doi: 10.1038/nature11808. - DOI - PMC - PubMed
    1. Madiraju A. K., Erion D. M., Rahimi Y., Zhang X.-M., Braddock D. T., Albright R. A., Prigaro B. J., Wood J. L., Bhanot S., MacDonald M. J., et al. Metformin suppresses gluconeogenesis by inhibiting mitochondrial glycerophosphate dehydrogenase. Nature. 2014;510:542–546. doi: 10.1038/nature13270. - DOI - PMC - PubMed
    1. Pollak M. N. Investigating metformin for cancer prevention and treatment: the end of the beginning. Cancer Discov. 2012;2:778–790. doi: 10.1158/2159-8290.CD-12-0263. - DOI - PubMed
    1. Pernicova I., Korbonits M. Metformin-mode of action and clinical implications for diabetes and cancer. Nat. Rev. Endocrinol. 2014;10:143–156. doi: 10.1038/nrendo.2013.256. - DOI - PubMed

Publication types

MeSH terms