. 2014 Jul 1:8:168.
doi: 10.3389/fnins.2014.00168. eCollection 2014.

Brain state-dependent abnormal LFP activity in the auditory cortex of a schizophrenia mouse model

Affiliations

Brain state-dependent abnormal LFP activity in the auditory cortex of a schizophrenia mouse model

Kazuhito Nakao et al. Front Neurosci. .

Abstract

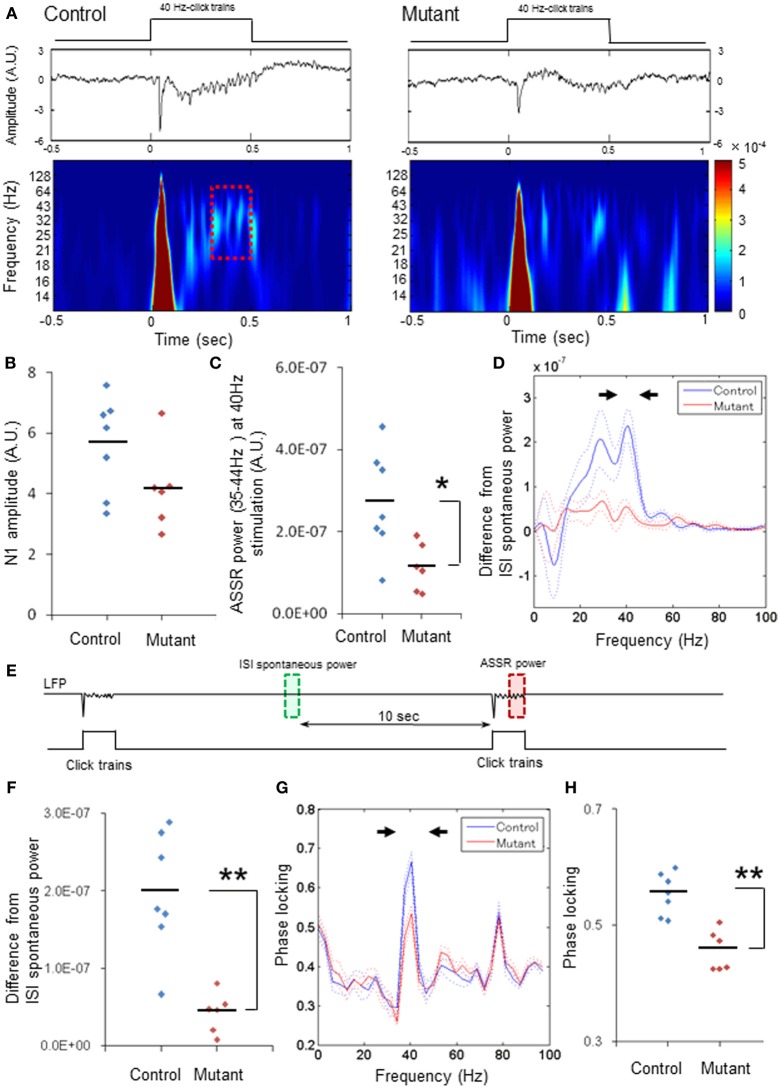
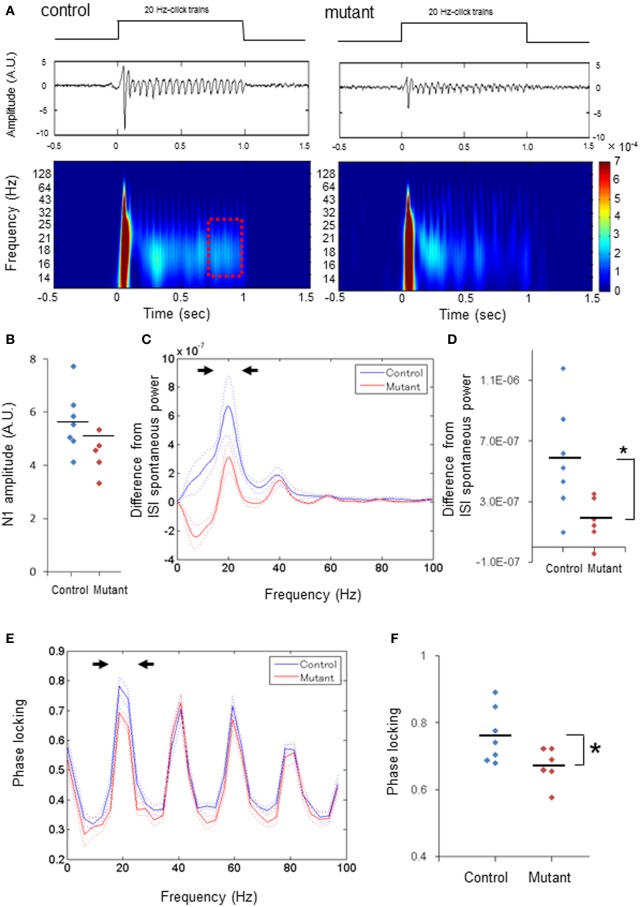
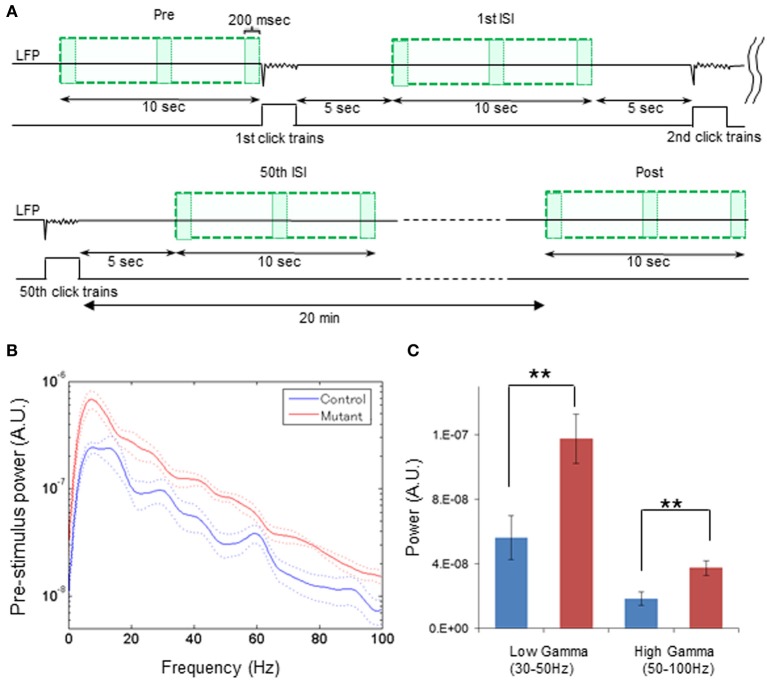
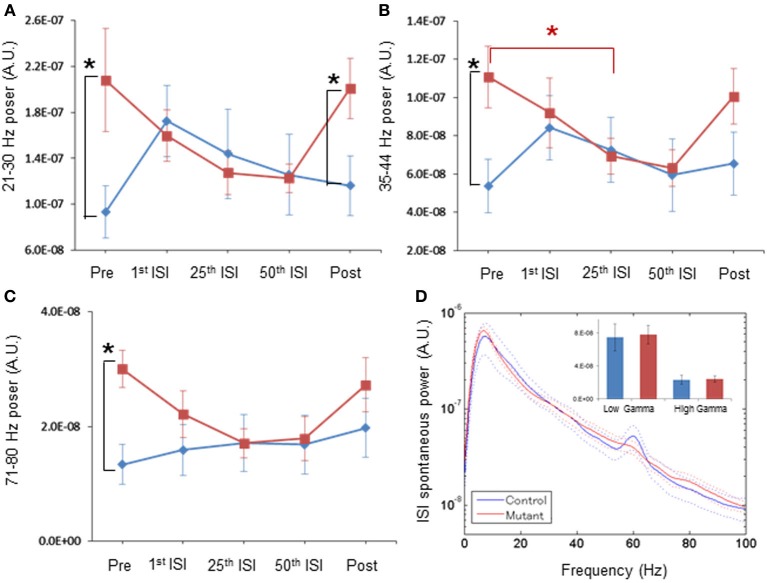
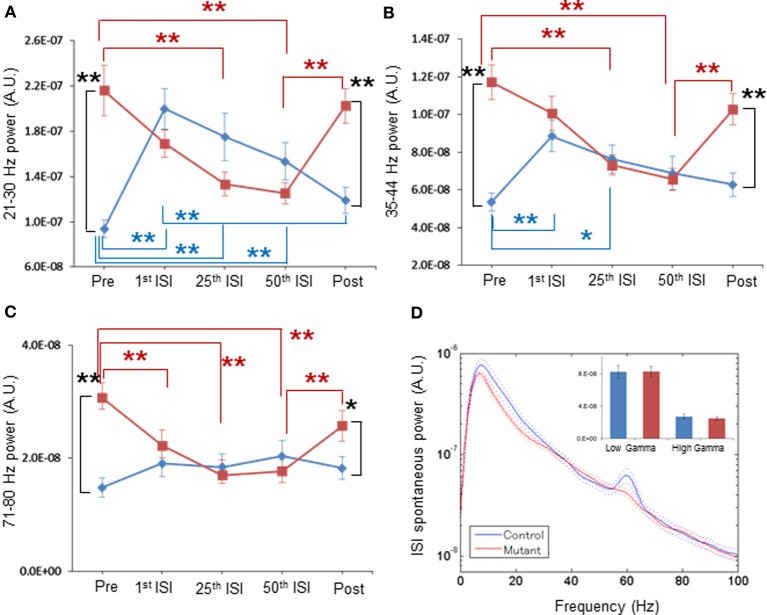
In schizophrenia, evoked 40-Hz auditory steady-state responses (ASSRs) are impaired, which reflects the sensory deficits in this disorder, and baseline spontaneous oscillatory activity also appears to be abnormal. It has been debated whether the evoked ASSR impairments are due to the possible increase in baseline power. GABAergic interneuron-specific NMDA receptor (NMDAR) hypofunction mutant mice mimic some behavioral and pathophysiological aspects of schizophrenia. To determine the presence and extent of sensory deficits in these mutant mice, we recorded spontaneous local field potential (LFP) activity and its click-train evoked ASSRs from primary auditory cortex of awake, head-restrained mice. Baseline spontaneous LFP power in the pre-stimulus period before application of the first click trains was augmented at a wide range of frequencies. However, when repetitive ASSR stimuli were presented every 20 s, averaged spontaneous LFP power amplitudes during the inter-ASSR stimulus intervals in the mutant mice became indistinguishable from the levels of control mice. Nonetheless, the evoked 40-Hz ASSR power and their phase locking to click trains were robustly impaired in the mutants, although the evoked 20-Hz ASSRs were also somewhat diminished. These results suggested that NMDAR hypofunction in cortical GABAergic neurons confers two brain state-dependent LFP abnormalities in the auditory cortex; (1) a broadband increase in spontaneous LFP power in the absence of external inputs, and (2) a robust deficit in the evoked ASSR power and its phase-locking despite of normal baseline LFP power magnitude during the repetitive auditory stimuli. The "paradoxically" high spontaneous LFP activity of the primary auditory cortex in the absence of external stimuli may possibly contribute to the emergence of schizophrenia-related aberrant auditory perception.

Keywords: GABAergic interneurons; NMDA receptors; auditory steady-state responses; gamma oscillation; local field potentials; mouse models; parvalbumin; schizophrenia.


Figures

Figure 1
Figure 1
Robust reduction in power and phase-locking of 40-Hz ASSRs. (A) Representative examples of the averaged 40-Hz ASSR (middle, z-score) and spectrogram (bottom) in response to 40-Hz click trains (upper; 80 dB intensity, 500 ms duration). Time 0 is tone onset. (B) No difference in the averaged N1 amplitudes (z-score) evoked by 40-Hz click trains between genotypes (blue for 7 fGluN1 control mice; red for 6 mutant mice). p = 0.11, unpaired Student's t-test (C) Evoked ASSR power (z-score) at 35–44 Hz frequency range during 40-Hz click train stimulation in mutants (red) was lower than controls (blue). *p < 0.05, unpaired Student's t-test. (D) The mean difference (A.U.) from baseline spontaneous power during inter-stimulus interval (ISIs; green square in Panel E) in click train-evoked ASSR power during last 200 ms before cessation of 40-Hz click trains (red square in Panels A,E). Dotted lines: mean ± s.e.m. (E) Schematic diagram indicates the analysis periods of baseline LFP power (green, ISI spontaneous power) and the evoked ASSR power (red). Relative ASSR power amplitudes shown in Panel (D) were calculated by subtracting an ISI power (in green) from the evoked ASSR power (in red) for each channel, and averaged per animal. (F) The difference in the magnitude between 35 and 44 Hz spectral power (arrowheads in Panel D) and the baseline for 40-Hz ASSRs in mutants (red) was lower than controls (blue). **p < 0.01, unpaired Student's t-test. (G) Phase locking to 40-Hz steady-state tone stimuli in control (blue) and mutant (red) mice. Dotted lines: mean ± s.e.m. (H) Magnitude of 35–44 Hz phase locking for 40-Hz ASSRs (arrowheads in Panel G) in mutants (red) was lower than controls (blue). **p < 0.01, unpaired Student's t-test. Each dot represents individual animals. Dotted lines in Panels (D,G) are s.e.m.
Figure 2
Figure 2
Diminished power and phase-locking of 20-Hz ASSRs. (A) Representative examples of the averaged 20-Hz ASSR (middle, z-score) and spectrogram (bottom), in response to 20-Hz click trains (upper; 80 dB intensity, 1000 ms duration). Time 0 is tone onset. (B) No difference in the averaged N1 amplitudes (z-score) evoked by 20-Hz click trains between genotypes (blue for 7 fGluN1 control mice; red for 6 mutant mice). p = 0.54, unpaired Student's t-test. (C) The mean difference (A.U.) from ISI spontaneous power in click train-evoked ASSR power during last 200 ms before cessation of 20-Hz click trains (red square in A) (blue for 7 fGluN1 controls; red for 6 mutants). Dotted lines: mean ± s.e.m. (D) The difference in the magnitude between 15 and 24 Hz power (arrowheads in C) from ISI spontaneous power for 20-Hz ASSRs was lower in mutant mice (red). *p < 0.05, unpaired Student's t-test. (E) Phase locking to 20-Hz ASSR stimuli in control (blue) and mutant (red) mice. Dotted lines: mean ± s.e.m. (F) Magnitude of 15–24 Hz phase locking for 20-Hz ASSRs (arrowheads in E) was lower in mutant mice (red). *p < 0.05 unpaired Student's t-test. Each dot represents individual animals. Dotted lines in (C,E) are s.e.m.
Figure 3
Figure 3
Broadband elevation of mutant spontaneous LFP power during pre-stimulus period. (A) Schematic diagram indicates the analysis periods of spontaneous LFP power during pre-stimulus period (Pre), following the first ASSR stimuli [1st inter-stimulus interval (ISI)], following the 50th ASSR stimuli (50th ISI), and during post-stimulus period (Post). For a pre-stimulus period, z-score normalized LFPs (top line) during last 10 s (upper left green square) before the first click train onset were analyzed with FFT algorism with every 200-ms bin (each box). During ASSR sessions, LFP data from 5 to 15 s (200-ms bin) after the 1st stimuli (upper right green square), the 25th stimuli (not shown), and 50th stimuli (bottom left green square) were analyzed with FFT algorithm. For a post-stimulus period, LFPs were obtained from a 10-s period (bottom right green square) 20 min after cessation of the last click trains were analyzed with FFT algorithm (200-ms bin). (B) Z-score normalized spectral density power during pre-stimulus period from control (blue) and mutant (red) mice (control: n = 7, mutant: n = 6). Dotted lines: mean ± s.e.m. A 60-Hz bump in control LFP power spectra was due to power line noise contamination. (C) Averaged spontaneous LFP powers at low gamma (30–50 Hz), high gamma (50–100 Hz) frequency range were higher in mutant (red) mice compared to control mice (blue). **p < 0.01, unpaired Student's t-test.
Figure 4
Figure 4
Normal magnitude of baseline LFP power during periods of periodic ASSR stimuli, by per-animal design. (A) Transition of z-score normalized spontaneous LFP powers per animal at 21–30 Hz frequency in control (blue) and mutant (red) mice during Pre (pre-stimulus period), 1st ISI (first inter-stimulus interval), 25th ISI, 50th ISI, and Post (post-stimulus period). *p < 0.05. (B) Transition of spontaneous LFP powers at 35–44 Hz in control (blue) and mutant (red) mice. *p < 0.05. (C) Transition of spontaneous LFP powers at 71–80 Hz in control (blue) and mutant (red) mice. *p < 0.05. Repeated-measures ANOVA followed by post-hoc Bonferroni testing. (D) No differences in averaged spontaneous LFP power amplitudes in the first, the 25th and the 50th ISIs, across frequencies between control (blue, n = 7) and mutant (red, n = 6) mice. The inset shows no difference in average LFP power amplitudes at low gamma (30–50 Hz) and high gamma (50–100 Hz) frequency. A 60-Hz bump in control LFP power spectra was due to power line noise contamination. Dotted lines: mean ± s.e.m.
Figure 5
Figure 5
Normal magnitude of baseline LFP power during periods of periodic ASSR stimuli, by per-channel design. (A) Mean normalized powers in per channel design for 21–30 Hz frequency LFP fluctuation in control (blue, n = 31 sites from 7 animals) and mutant (red, n = 26 sites from 6 animals) mice during Pre-ASSR, 1st ISI, 25th ISI, 50th ISI, and post-ASSR. **p < 0.01, repeated-measures ANOVA followed by post-hoc Bonferroni testing. (B) Mean normalized powers for 35–44 Hz frequency LFP fluctuation in control (blue) and mutant (red) mice during Pre-ASSR, 1st ISI, 25th ISI, 50th ISI, and Post-ASSR. **p < 0.01 and *p < 0.05, repeated-measures ANOVA followed by post-hoc Bonferroni testing. (C) Mean normalized powers for 71–80 Hz frequency LFP fluctuation in control (blue) and mutant (red) mice during Pre-ASSR, 1st ISI, 25th ISI, 50th ISI, and Post-ASSR. **p < 0.01, *p < 0.05, repeated-measures ANOVA followed by post-hoc Bonferroni testing. (D) No differences in averaged spontaneous LFP power amplitudes in the first, the 25th and the 50th ISIs, across frequencies between control mice (blue, n = 31 sites from 7 animals) and mutant mice (red, n = 26 sites from 6 animals). The inset shows no difference in average LFP power amplitudes at low gamma (30–50 Hz) and high gamma (50–100 Hz) frequency. A 60-Hz bump in control LFP power spectra was due to power line noise contamination. Dotted lines: mean ± s.e.m.

References

    1. Baldeweg T., Spence S., Hirsch S. R. (1998). Gamma-band electroencephalographic oscillations in a patient with somatic hallucinations. Lancet 352, 620–621 10.1016/S0140-6736(05)79575-1 - DOI - PubMed
    1. Becker C., Gramann K., Müller H. J., Elliott M. A. (2009). Electrophysiological correlates of flicker-induced color hallucinations. Conscious. Cogn. 18, 266–276 10.1016/j.concog.2008.05.001 - DOI - PubMed
    1. Belforte J. E., Zsiros V., Sklar E. R., Jiang Z., Yu G., Li Y., et al. (2010). Postnatal NMDA receptor ablation in corticolimbic interneurons confers schizophrenia-like phenotypes. Nat. Neurosci. 13, 76–83 10.1038/nn.2447 - DOI - PMC - PubMed
    1. Bikbaev A., Manahan-vaughan D., Sandi C. (2008). Relationship of hippocampal theta and gamma oscillations to potentiation of synaptic transmission. Front. Neurosci. 2:1 10.3389/neuro.01.010.2008 - DOI - PMC - PubMed
    1. Brenner C. A., Krishnan G. P., Vohs J. L., Ahn W.-Y., Hetrick W. P., Morzorati S. L., et al. (2009). Steady state responses: electrophysiological assessment of sensory function in schizophrenia. Schizophr. Bull. 35, 1065–1077 10.1093/schbul/sbp091 - DOI - PMC - PubMed

LinkOut - more resources