. 2014 Feb 28;2(4):0004.
doi: 10.3389/fcell.2014.00004.

Gβ1γ2 activates phospholipase A2-dependent Golgi membrane tubule formation

Affiliations

Gβ1γ2 activates phospholipase A2-dependent Golgi membrane tubule formation

Marie E Bechler et al. Front Cell Dev Biol. .

Abstract

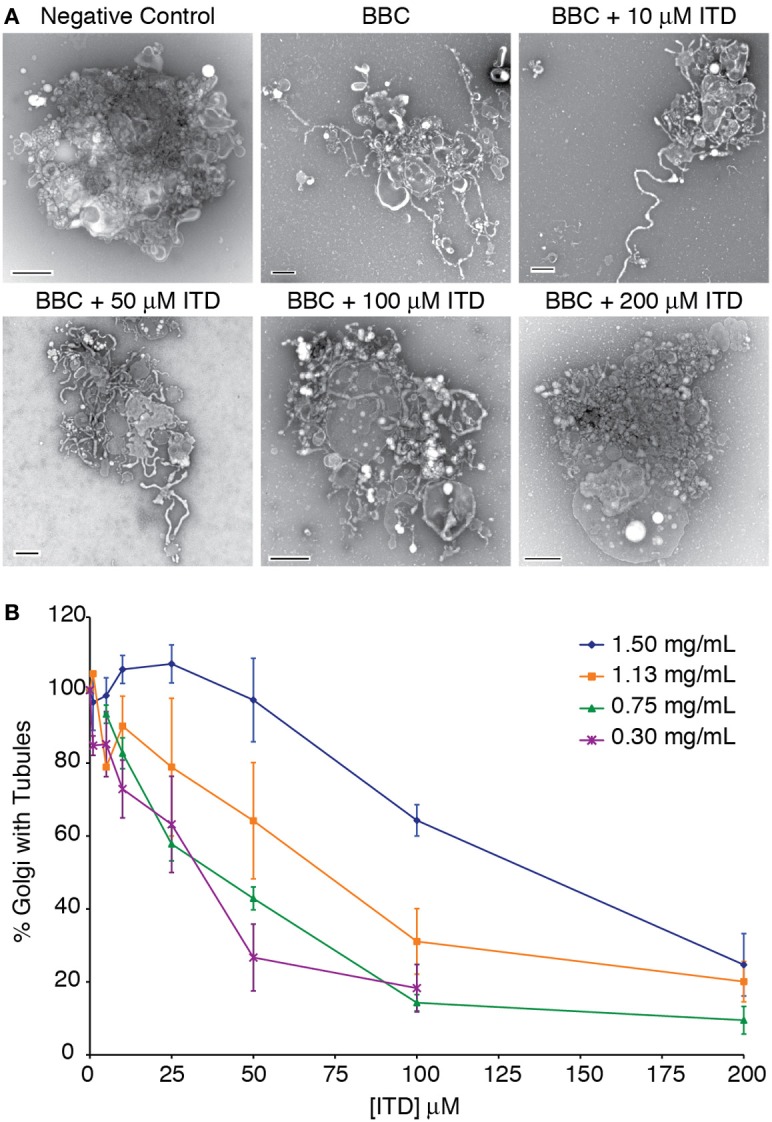
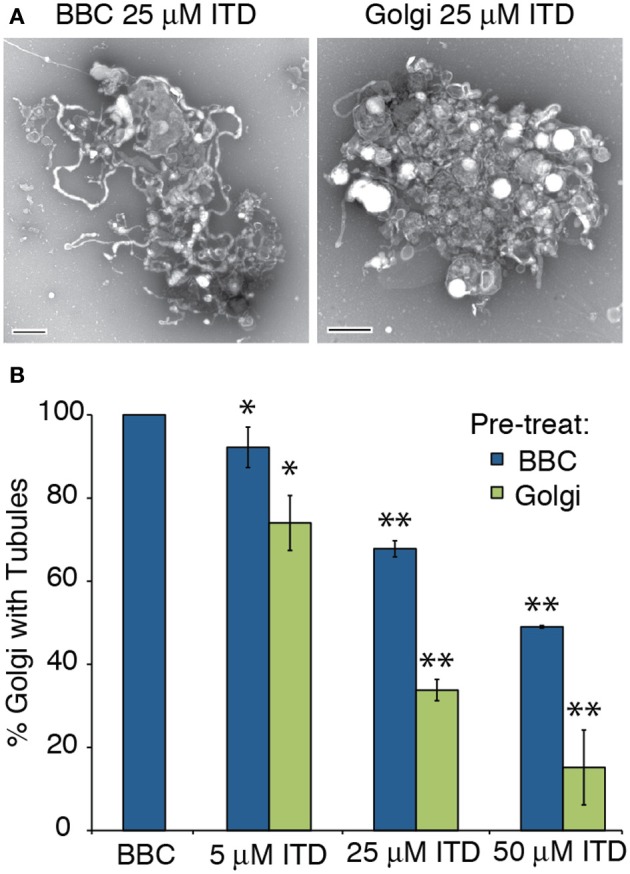
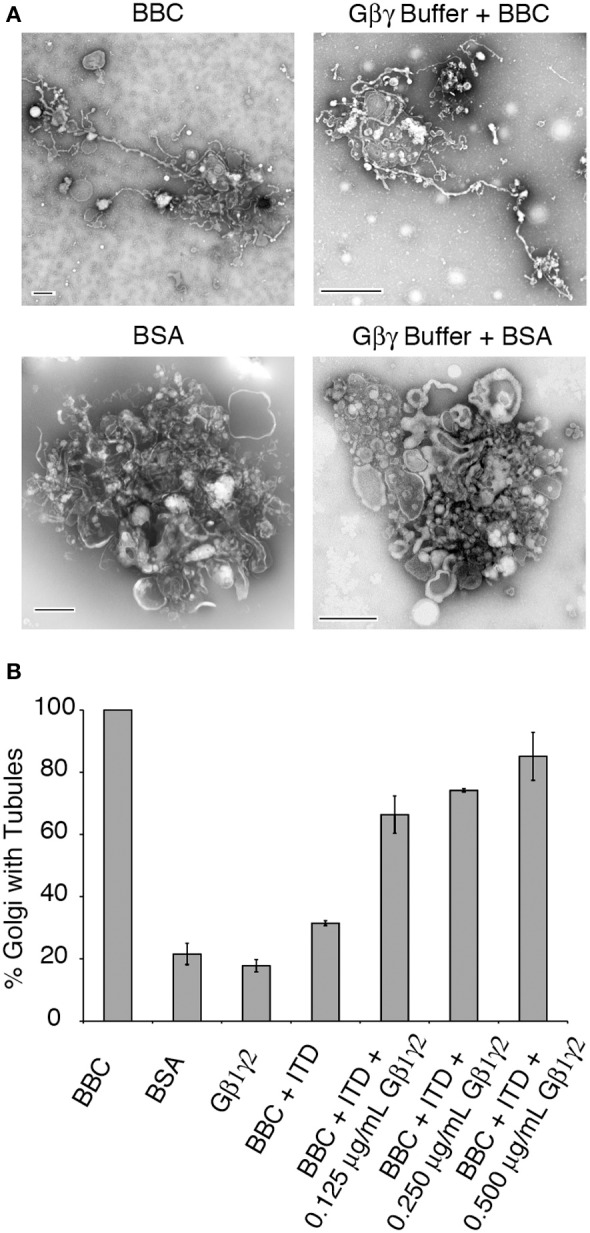
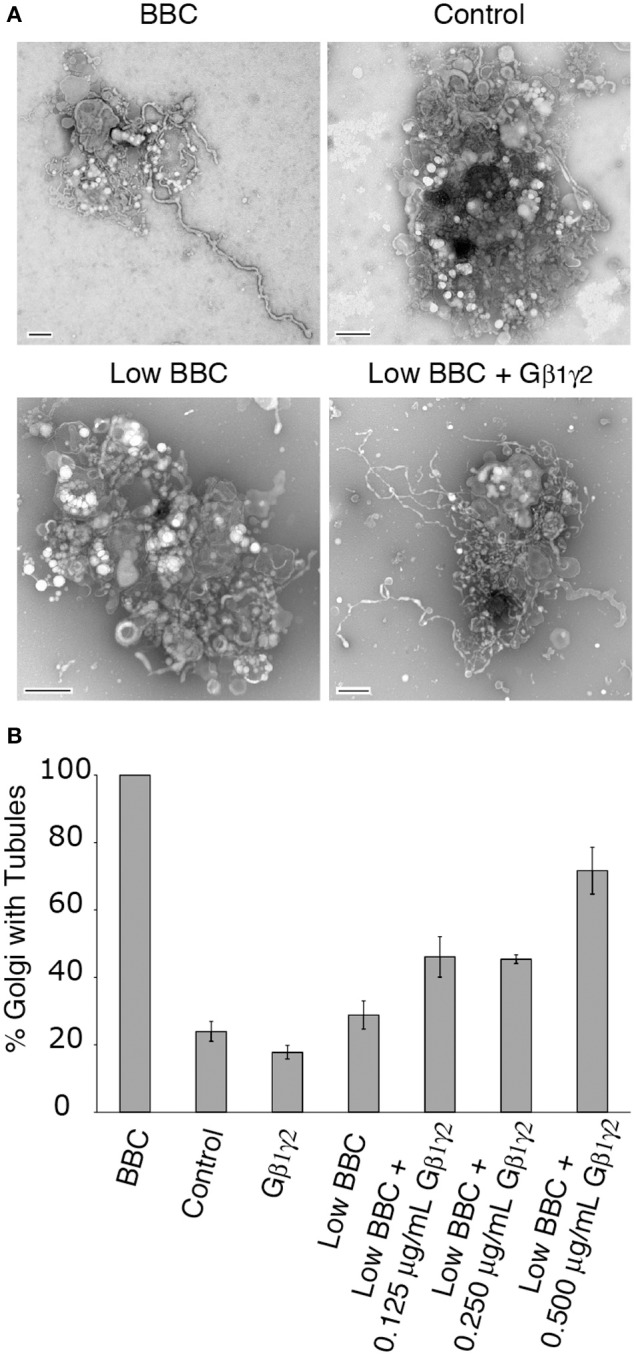
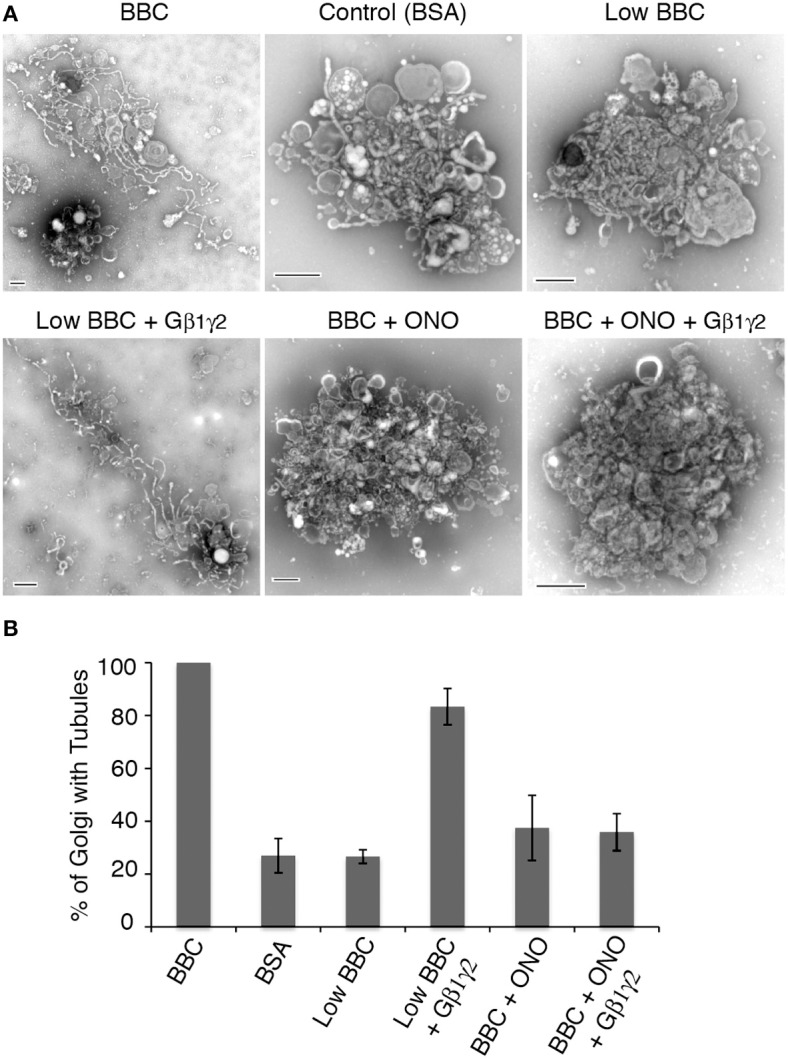
Heterotrimeric G proteins transduce the ligand binding of transmembrane G protein coupled receptors into a variety of intracellular signaling pathways. Recently, heterotrimeric Gβγ subunit signaling at the Golgi complex has been shown to regulate the formation of vesicular transport carriers that deliver cargo from the Golgi to the plasma membrane. In addition to vesicles, membrane tubules have also been shown to mediate export from the Golgi complex, which requires the activity of cytoplasmic phospholipase A2 (PLA2) enzyme activity. Through the use of an in vitro reconstitution assay with isolated Golgi complexes, we provide evidence that Gβ1γ2 signaling also stimulates Golgi membrane tubule formation. In addition, we show that an inhibitor of Gβγ activation of PLA2 enzymes inhibits in vitro Golgi membrane tubule formation. Additionally, purified Gβγ protein stimulates membrane tubules in the presence of low (sub-threshold) cytosol concentrations. Importantly, this Gβγ stimulation of Golgi membrane tubule formation was inhibited by treatment with the PLA2 antagonist ONO-RS-082. These studies indicate that Gβ1γ2 signaling activates PLA2 enzymes required for Golgi membrane tubule formation, thus establishing a new layer of regulation for this process.

Keywords: Golgi complex; Gβγ; PLA2; heterotrimeric G proteins; membrane tubules; phospholipids.


Figures

Figure 1
Figure 1
Dose-dependent inhibition of cytosol-stimulated Golgi membrane tubules. (A) Example negative stain electron micrographs of tubulated and non-tubulated Golgi from the in vitro reconstitution assay. Bovine brain cytosol (BBC, 1.5 mg/ml) was incubated with the indicated concentration of ITD and added to isolated Golgi complexes. Control Golgi complexes were incubated with 0.2 mg/ml BSA. Scale bars = 500 nm. (B) Quantification of the percent of Golgi complexes with membrane tubules, normalized to the maximum percent of Golgi with tubules in the presence of each BBC concentration shown. Averages are shown from minimum of three replicates, error bars = s.e.m.
Figure 2
Figure 2
ITD inhibits Golgi-membrane associated proteins. Various concentrations of ITD were either pre-incubated at 37°C for 15 min with BBC or Golgi membranes before combining the cytosol and Golgi, followed by further incubation at 37°C for 15 min. (A) Representative negative stain Golgi treated with ITD, which was pre-incubated as labeled. Scale bars = 500 nm. (B) Quantification of the percent of Golgi with membrane tubules, normalized to BBC alone (1.5 mg/ml). ITD concentrations shown are the final concentration after mixing the Golgi and cytosol. Error bars = s.e.m. Differences between samples with ITD pre-treated BBC or Golgi were statistically different, with p-values < 0.04 (*) or 0.006 (**), determined using a two-tailed t-test for each ITD concentration.
Figure 3
Figure 3
Gβ1γ2 rescues ITD inhibition of cytosol-stimulated Golgi membrane tubules. (A) Representative EM micrographs of Golgi treated with BBC (1.5 mg/ml) or BSA (0.2 mg/ml) in the presence or absence of the Gβγ buffer that contains CHAPS detergent. Membrane tubules and Golgi morphology were unaffected by the presence of the buffer. (B) Quantification of the fraction of Golgi with tubules, relative to the maximum percent of Golgi with tubules seen with BBC (1.5 mg/ml) alone. Final concentrations (after mixing the pre-incubated Golgi and cytosol) are shown for purified Gβγ. ITD final concentration was 25 μM. Error bars = s.e.m. Samples containing BBC + ITD+ Gβ1γ2 were statistically different with p-values < 0.003 compared to BSA, Gβ1γ2 alone, or BBC + ITD, as determined using ANOVA.
Figure 4
Figure 4
Gβ1γ2 stimulates cytosol-dependent Golgi membrane tubulation. (A) Representative EM micrographs of Golgi treated with BBC (1.5 mg/ml), a BSA control (0.2 mg/ml), Low BBC (0.15 mg/ml), or Low BBC + Gβ1γ2 (0.5 μg/ml Gβγ). Each condition was in the presence of the Gβγ buffer. Scale bar = 500 nm. (B) Quantification of the percent of Golgi with membrane tubules, normalized to the maximum amount of tubulated Golgi with BBC (1.5 mg/ml). Gβ1γ2 purified protein alone does not stimulate Golgi membrane tubules above background levels (no BBC control). In the presence of low cytosol concentrations (Low BBC 0.15 mg/ml), the addition of Gβ1γ2 stimulates membrane tubules. Error bars = s.e.m. Low BBC + 0.0125 μg/mL Gβ1γ2 was statistically different than samples of Control, Gβ1γ2 alone, or Low BBC, with p-values < 0.009 determined using ANOVA.
Figure 5
Figure 5
Gβ1γ2 stimulation of Golgi membrane tubules is PLA2 activity dependent. BBC (1.5 mg/ml) was pre-incubated with the PLA2 inhibitor ONO (at final concentration of 25 μM) at 37°C for 15 min, followed by the addition of Gβ1γ2 purified protein (final concentration of 0.4 μg/ml) to BBC before combining the cytosol and Golgi, and additional incubation at 37°C for 15 min. Low BBC was 0.15 mg/ml and the BSA, as a negative control, was at a final 1 mg/ml concentration. (A) Representative negative stain Golgi treated with ONO and Gβ1γ2 as labeled. Scale bars = 500 nm. (B) Quantification of the percent of Golgi with membrane tubules, normalized to BBC alone (1.5 mg/ml). Error bars = s.e.m. Golgi samples with ONO-treated BBC, BSA, or Low BBC were statistically different from Low BBC + Gβ1γ2 with p-values < 0.013, as determined using ANOVA.

References

    1. Akgoz M., Kalyanaraman V., Gautam N. (2006). G protein betagamma complex translocation from plasma membrane to Golgi complex is influenced by receptor gamma subunit interaction. Cell. Signal. 18, 1758–1768. 10.1016/j.cellsig.2006.01.016 - DOI - PMC - PubMed
    1. Akiba S., Kato E., Sato T., Fujii T. (1992). Biscoclaurine alkaloids inhibit receptor-mediated phospholipase A2 activation probably through uncoupling of a GTP-binding protein from the enzyme in rat peritoneal mast cells. Biochem. Pharmacol. 44, 45–50. 10.1016/0006-2952(92)90036-I - DOI - PubMed
    1. Akiba S., Nagatomo R., Ishimoto T., Sato T. (1995). Effect of berbamine on cytosolic phospholipase A2 activation in rabbit platelets. Eur. J. Pharmacol. 291, 343–350. 10.1016/0922-4106(95)90075-6 - DOI - PubMed
    1. Banta M., Polizotto R. S., Wood S. A., De Figueiredo P., Brown W. J. (1995). Characterization of a cytosolic activity that induces the formation of Golgi membrane tubules in a cell-free reconstitution system. Biochemistry 34, 13359–13366. 10.1021/bi00041a012 - DOI - PubMed
    1. Baron C. L., Malhotra V. (2002). Role of diacylglycerol in PKD recruitment to the TGN and protein transport to the plasma membrane. Science 295, 325–328. 10.1126/science.1066759 - DOI - PubMed

LinkOut - more resources