. 2014 Jul 14;9(7):e102396.
doi: 10.1371/journal.pone.0102396. eCollection 2014.

Wireless monitoring of liver hemodynamics in vivo

Affiliations

Wireless monitoring of liver hemodynamics in vivo

Tony J Akl et al. PLoS One. .

Abstract

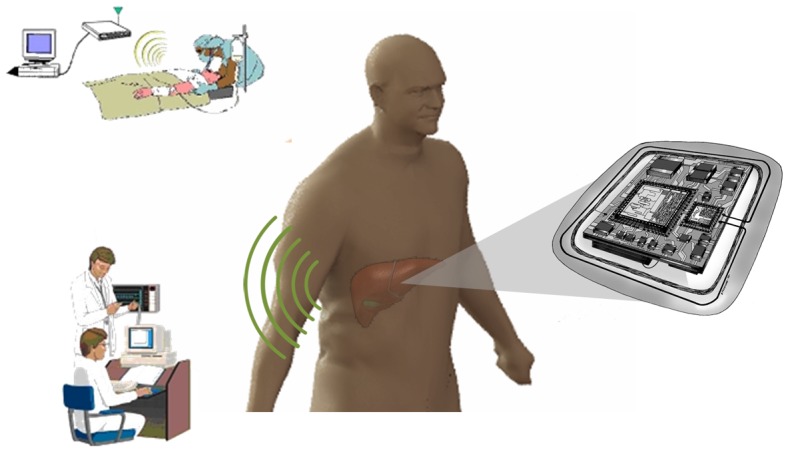
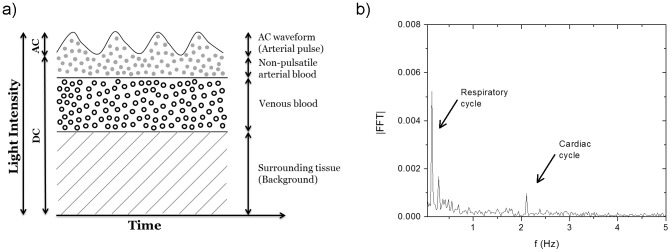
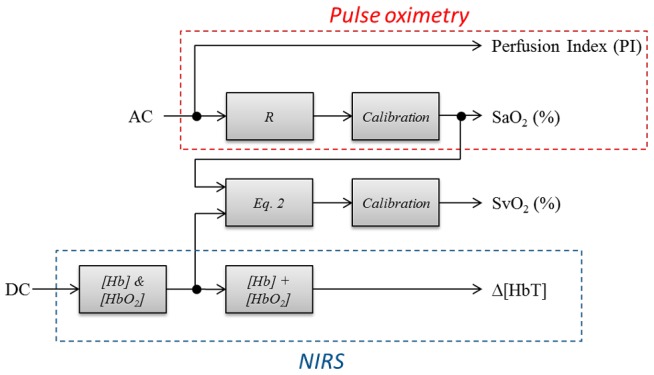
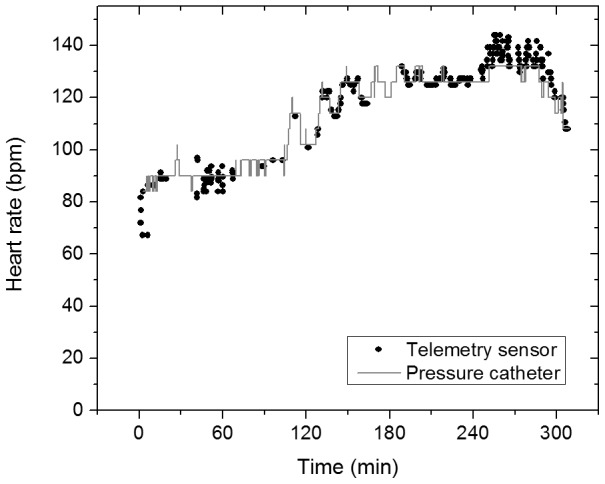
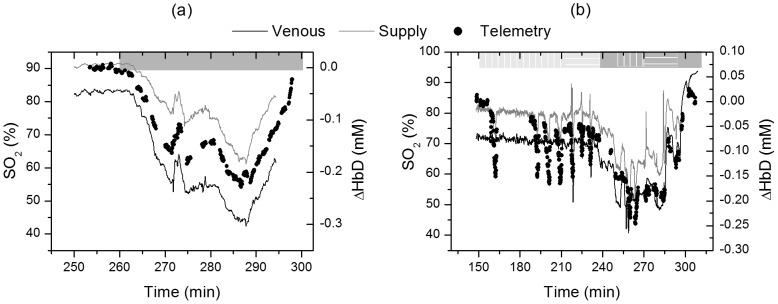
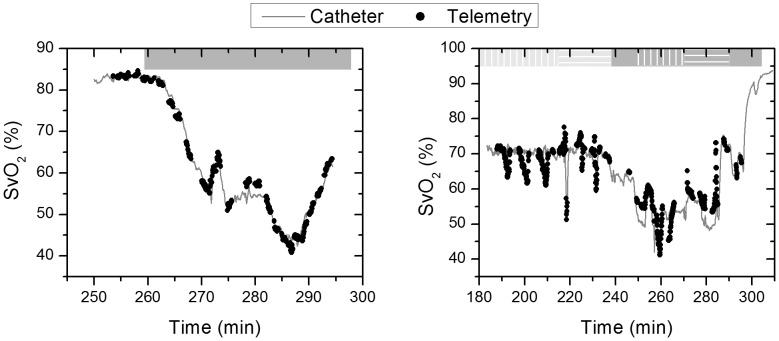
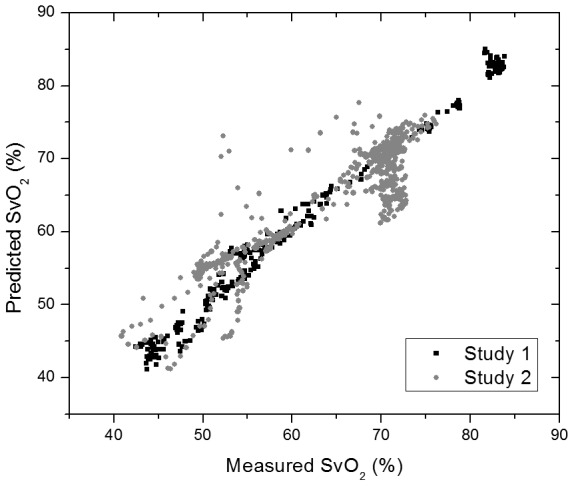
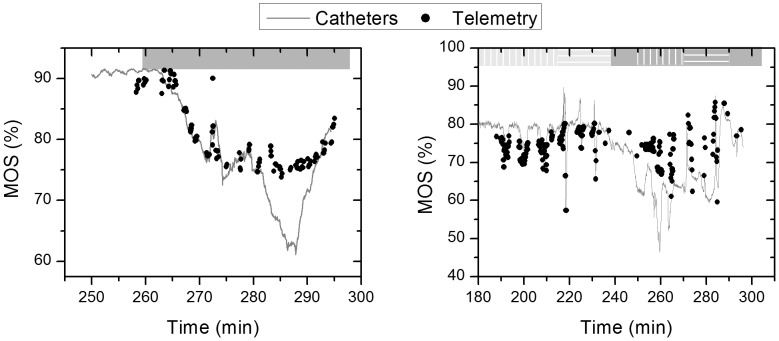
Liver transplants have their highest technical failure rate in the first two weeks following surgery. Currently, there are limited devices for continuous, real-time monitoring of the graft. In this work, a three wavelengths system is presented that combines near-infrared spectroscopy and photoplethysmography with a processing method that can uniquely measure and separate the venous and arterial oxygen contributions. This strategy allows for the quantification of tissue oxygen consumption used to study hepatic metabolic activity and to relate it to tissue stress. The sensor is battery operated and communicates wirelessly with a data acquisition computer which provides the possibility of implantation provided sufficient miniaturization. In two in vivo porcine studies, the sensor tracked perfusion changes in hepatic tissue during vascular occlusions with a root mean square error (RMSE) of 0.135 mL/min/g of tissue. We show the possibility of using the pulsatile wave to measure the arterial oxygen saturation similar to pulse oximetry. The signal is also used to extract the venous oxygen saturation from the direct current (DC) levels. Arterial and venous oxygen saturation changes were measured with an RMSE of 2.19% and 1.39% respectively when no vascular occlusions were induced. This error increased to 2.82% and 3.83% when vascular occlusions were induced during hypoxia. These errors are similar to the resolution of a commercial oximetry catheter used as a reference. This work is the first realization of a wireless optical sensor for continuous monitoring of hepatic hemodynamics.


Conflict of interest statement

Competing Interests: The authors have declared that no competing interests exist.

Figures

Figure 1
Figure 1. Schematic of the envisioned wireless sensor implanted on the liver.
Figure 2
Figure 2. Typical PPG signal.
a- Schematic of the collected reflectance signal (Note that the various signal components are not drawn to scale to allow easy visualization). b- Spectrum of the reflectance signal collected with our sensor prior to amplification and with the DC signal omitted.
Figure 3
Figure 3. Flow chart of the signal processing.
This was employed to compute the oxygen saturation at the arterial and venous side along with perfusion changes from the measured AC and DC signals.
Figure 4
Figure 4. Heart rate measurements.
Data from the arterial pressure catheter (grey) and the telemetry sensor (black).
Figure 5
Figure 5. Oxygenation changes as measured by the sensor and the oximetry catheters.
Hemoglobin oxygenation index (right axis) measured by the optical telemetry system versus venous and mixed oxygen saturation (left axis) for study 1 (left panel) and 2 (right panel). Venous oxygenation is measured by the oximetry catheter placed in the vena cava while the supply oxygenation is the weighted average of the HA and PV oxygenation described by equation 3.
Figure 6
Figure 6. Venous oxygen saturation.
Data from the telemetry sensor (black dots) and the central venous catheter (grey line) for study 1 (left) and 2 (right).
Figure 7
Figure 7. Scatter plot of the predicted (telemetry) versus measured (catheter) venous oxygen saturation for both studies (1: black & 2: grey).
Figure 8
Figure 8. Mixed oxygen supply (MOS) measured by the telemetry sensor (black dots) and the reference equipment (grey line) for both studies (1: left, & 2: right).
Figure 9
Figure 9. Scatter plot of the predicted vs. measured MOS for study 1 (black) and 2 (grey).
Figure 10
Figure 10. Predicted venous oxygen saturation by combining the DC NIRS measurements with the AC pulse oximetry measurements.
Note that the missing values correspond to the periods where MOS dropped below 72% and, because of the previously reported problem with signal from the red wavelength, could not get reliable pulse oximetry measurements. Study 1 & 2 are shown in left & right panel respectively.
Figure 11
Figure 11. Hepatic flow changes.
(Left) Changes in total hemoglobin concentration (ΔHbT, black dots) in hepatic tissue versus total hepatic flow measured by the addition of the HA and PV Transit-Time flowmeters' measurements (grey line). (Right) Total hepatic flow (grey) and mean arterial pressure (black) trends show that the increase in flow after t = 200 min is accompanied by an increase in the arterial pressure suggesting that a systemic response is responsible for that increase.
Figure 12
Figure 12. Hepatic flow changes prior to the increase in blood pressure.
(Left) Total hemoglobin concentration (ΔHbT) and flow changes. (Right) Scatter plot of measured hemoglobin concentration change (ΔHbT) vs. tissue perfusion (flow normalized by liver weight).

References

    1. Starzl TE, Marchioro TL, Vonkaulla KN, Hermann G, Brittain RS, et al. (1963) Homotransplantation of the Liver in Humans. Surg Gynecol Obstet 117: 659–676. - PMC - PubMed
    1. Organ Procurement and Transplantation Network (OPTN) and Scientific Registry of Transplant Recipients (SRTR). OPTN/SRTR 2011 Annual Data Report. Rockville, MD: Department of Health and Human Services, Health Resources and Services Administration, Healthcare Systems Bureau, Division of Transplantation; 2012.
    1. Quiroga J, Colina I, Demetris AJ, Starzl TE, Van Thiel DH (1991) Cause and timing of first allograft failure in orthotopic liver transplantation: a study of 177 consecutive patients. Hepatology 14: 1054–1062. - PubMed
    1. Eghtesad B, Miller CM, Fung JJ (2009) Cleveland Clinic: Current clinical medicine, 2nd edition, “Post-liver transplantation management”. In: Carey WD, editor. Cleveland Clinic: Current clinical medicine, 2nd edition. Philadelphia: Elsevier Saunders. pp. 564–570.
    1. Klar E, Bredt M, Kraus T, Angelescu M, Mehrabi A, et al. (1997) Early assessment of reperfusion injury by intraoperative quantification of hepatic microcirculation in patients. Transplant Proc 29: 362–363. - PubMed

Publication types