. 2014 Jul 14:5:4436.
doi: 10.1038/ncomms5436.

PKM2 regulates the Warburg effect and promotes HMGB1 release in sepsis

Affiliations

PKM2 regulates the Warburg effect and promotes HMGB1 release in sepsis

Liangchun Yang et al. Nat Commun. .

Abstract

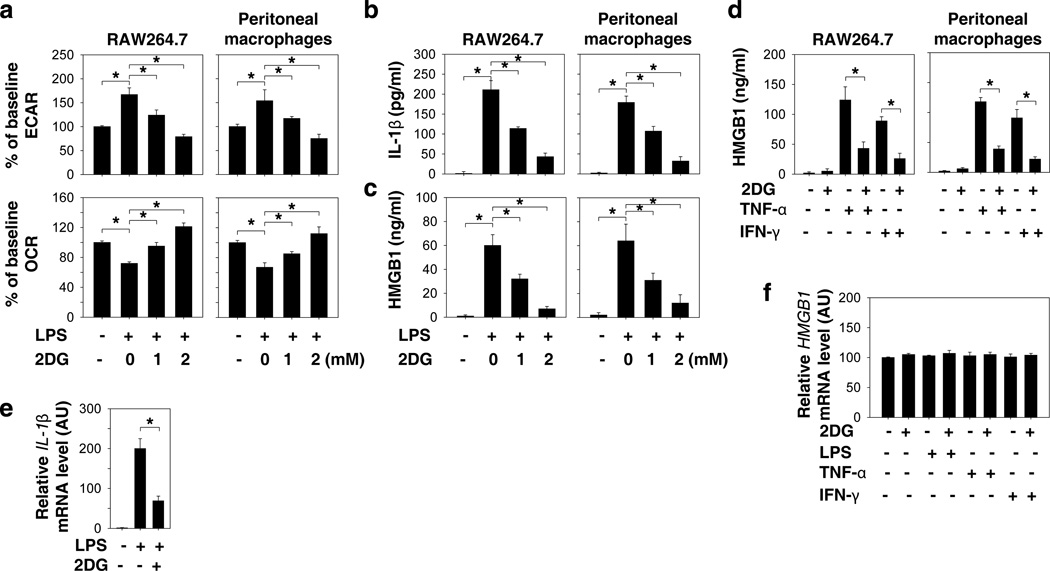
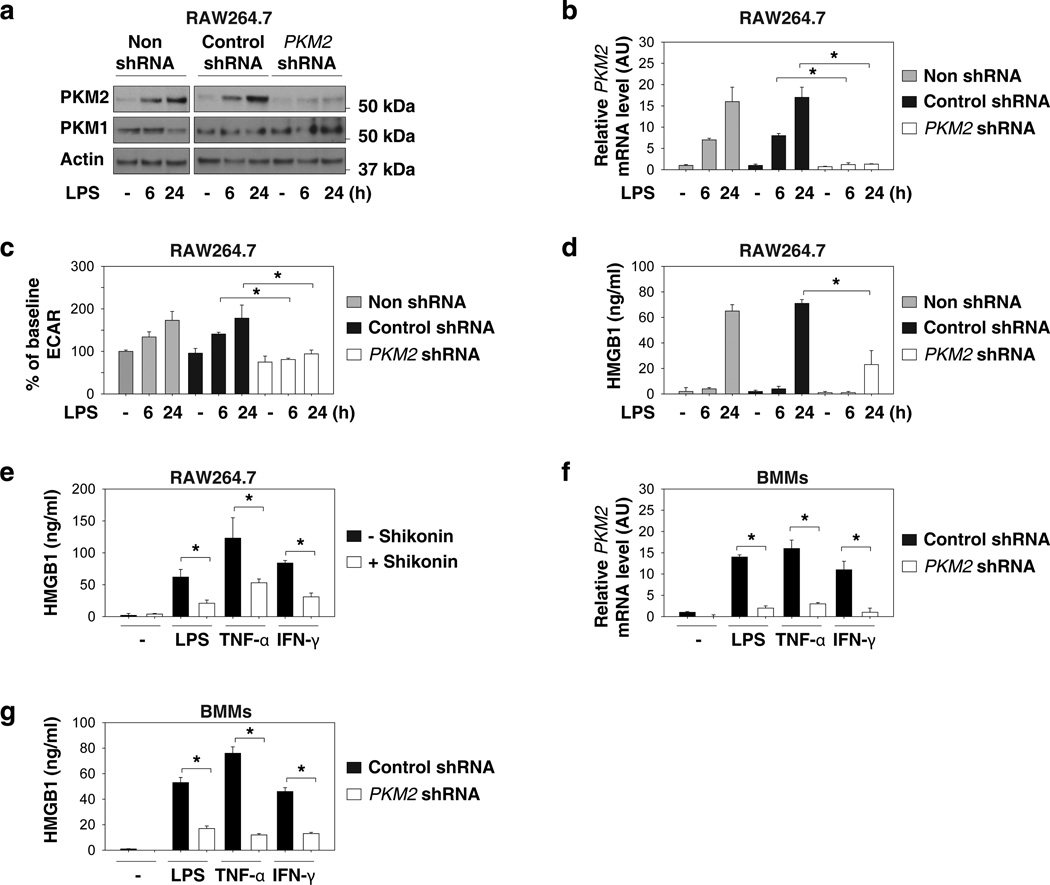
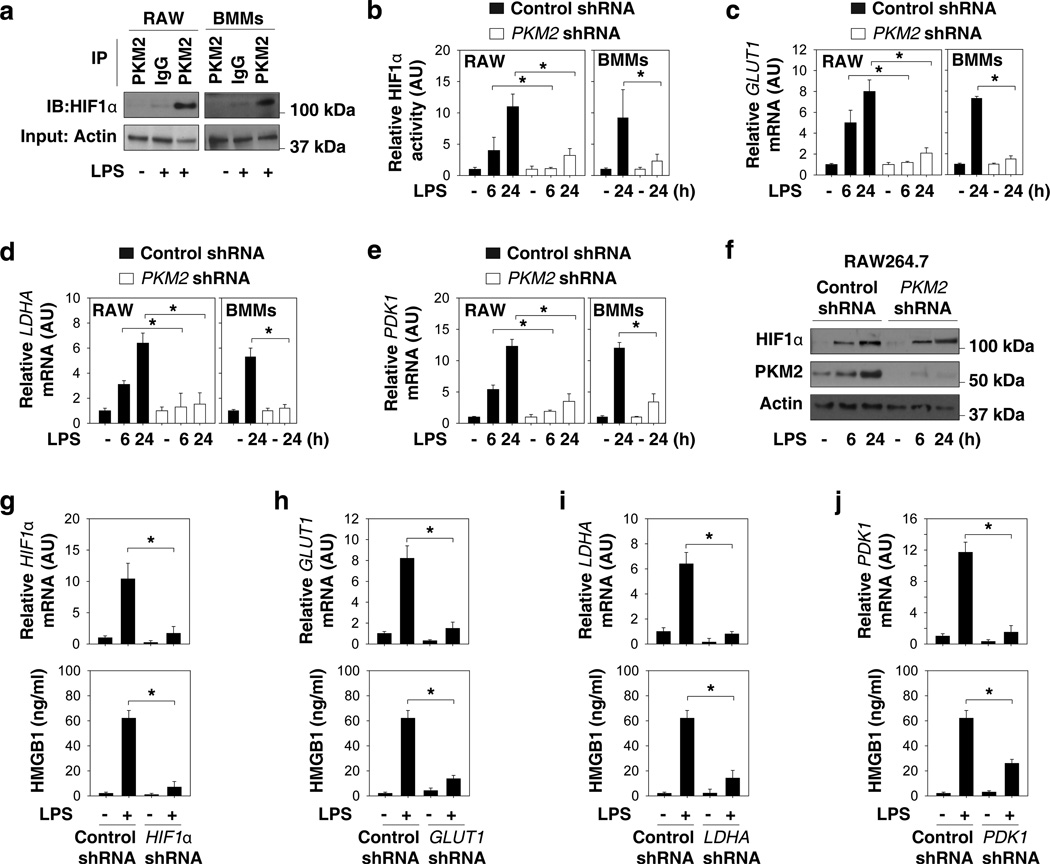
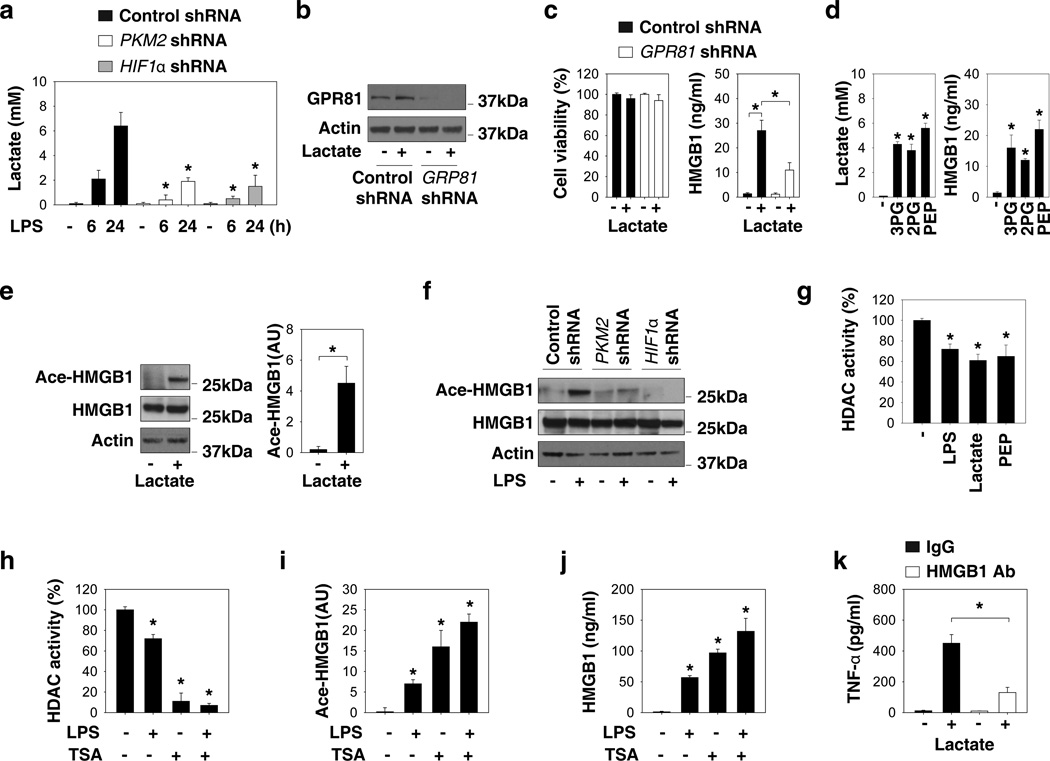
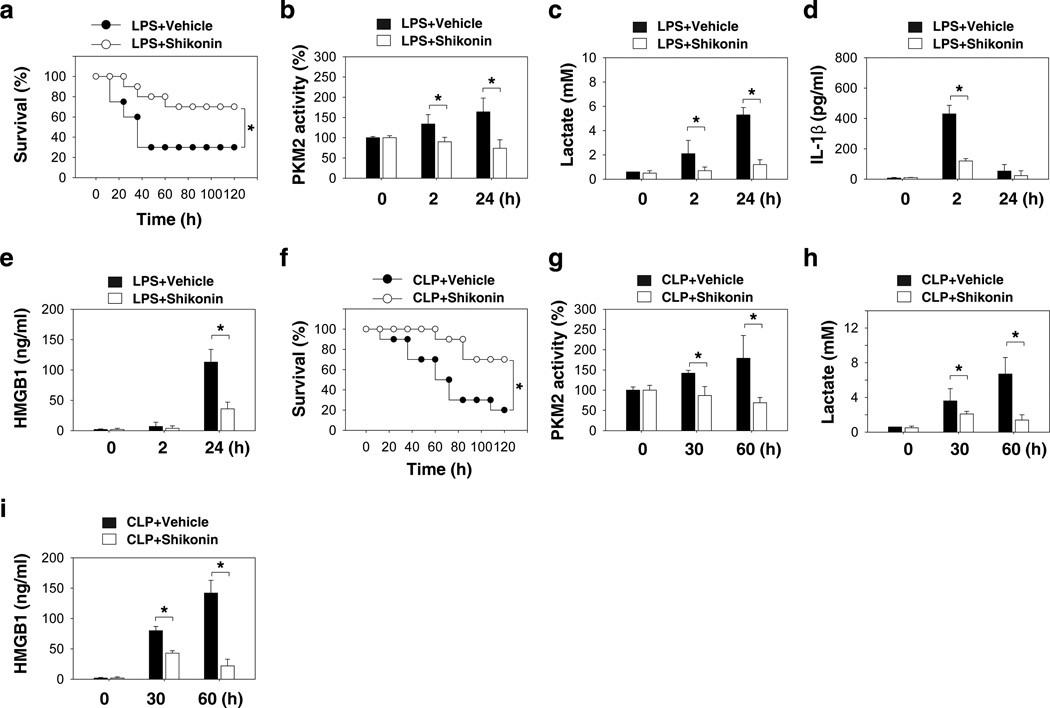
Increasing evidence suggests the important role of metabolic reprogramming in the regulation of the innate inflammatory response, but the underlying mechanism remains unclear. Here we provide evidence to support a novel role for the pyruvate kinase M2 (PKM2)-mediated Warburg effect, namely aerobic glycolysis, in the regulation of high-mobility group box 1 (HMGB1) release. PKM2 interacts with hypoxia-inducible factor 1α (HIF1α) and activates the HIF-1α-dependent transcription of enzymes necessary for aerobic glycolysis in macrophages. Knockdown of PKM2, HIF1α and glycolysis-related genes uniformly decreases lactate production and HMGB1 release. Similarly, a potential PKM2 inhibitor, shikonin, reduces serum lactate and HMGB1 levels, and protects mice from lethal endotoxemia and sepsis. Collectively, these findings shed light on a novel mechanism for metabolic control of inflammation by regulating HMGB1 release and highlight the importance of targeting aerobic glycolysis in the treatment of sepsis and other inflammatory diseases.


Conflict of interest statement

Conflict of interest

The authors declare no competing financial interests.

Figures

Figure 1
Figure 1. Glycolytic inhibitor 2DG attenuates HMGB1 release by activated macrophages
(a–c) Murine RAW 264.7 macrophage cell line and primary peritoneal macrophages were pretreated with 2DG for three hours and then stimulated with lipopolysaccharide (LPS) (100 ng ml−1) for two-24 hours. The oxygen consumption rates (OCR, indicative of oxidative phosphorylation) and extracellular acidification rates (ECAR, indicative of glycolysis) were monitored at 24 hours using the Seahorse Bioscience Extracellular Flux Analyzer (a). The levels of secreted IL-1β at two hours (b) and HMGB1 at 24 hours (c) in the cell culture medium were measured by ELISA (n=3, means ± SEM, *P < 0.05 by ANOVA LSD test). (d) 2DG (2 mM) inhibits TNF-α (5 ng ml−1) and IFN-γ (10 ng ml−1)-induced HMGB1 release at 24 hours (n=3, means ± SEM, *P < 0.05 by ANOVA LSD test). (e) IL-1β mRNA in RAW 264.7 macrophages after treatment with LPS (100ng/ml) for two hours with or without 2DG (2 mM) (n=3, means ± SEM, *P < 0.05 by ANOVA LSD test). (f) HMGB1 mRNA in RAW264.7 macrophages after treatment with LPS (100 ng ml−1), TNF-α (5 ng ml−1), and IFN-γ (10 ng ml−1) for 24 hours with or without 2DG (2 mM) (n=3, means ± SEM, *P < 0.05 by ANOVA LSD test). AU= arbitrary units.
Figure 2
Figure 2. Upregulated PKM2 promotes aerobic glycolysis and HMGB1 release in activated macrophages
(a–d) RAW 264.7 cells were transfected with or without indicated shRNA for 48 hours and then stimulated with LPS (100 ng ml−1) for six-24 hours. The level of indicated protein (a), mRNA (b), ECAR (c), and HMGB1 release (d) were assayed as described in the methods (n=3, means ± SEM, *P < 0.05 by ANOVA LSD test). AU= arbitrary units. (e) RAW 264.7 cells were pretreated with shikonin (5 µM) for three hours and then stimulated with lipopolysaccharide (LPS) (100 ng ml−1), TNF-α (5 ng ml−1), and IFN-γ (10 ng ml−1) for 24 hours. HMGB1 release was assayed by ELISA (n=3, means ± SEM, *P < 0.05 by ANOVA LSD test). (f, g) Bone marrow macrophages (BMMs) were transfected with or without indicated shRNA for 48 hours and then stimulated with LPS (100 ng ml−1), TNF-α (5 ng ml−1), and IFN-γ (10 ng ml−1) for 24 hours. The mRNA levels of PKM2 (f) and HMGB1 release (g) were assayed (n=3, means ± SEM, *P < 0.05 by ANOVA LSD test). AU= arbitrary units.
Figure 3
Figure 3. PKM2-mediated HIF1α activation is required for HMGB1 release in activated macrophages
(a) RAW 264.7 cells (RAW) and bone marrow macrophages (BMMs) were stimulated with lipopolysaccharide (LPS) (100 ng ml−1) for 24 hours. The interaction between PKM2 and HIF1α was assayed by immunoprecipitation (IP) and immune-blot (IB). (b–f) RAW 264.7 cells and BMMs were transfected with control shRNA or PKM2 shRNA for 48 hours and then stimulated with LPS (100 ng ml−1) for six-24 hours. The mRNA levels of indicated genes (b–e) were assayed by real time PCR (n=3, means ± SEM, *P < 0.05 by ANOVA LSD test). AU= arbitrary units. The protein level of HIF1α was assayed by Western blot (f). (g–j) RAW 264.7 cells were transfected with indicated shRNA for 48 hours and then stimulated with LPS (100 ng ml−1) for 24 hours. The mRNA levels of indicated genes were assayed by real time PCR. In parallel, the extracellular levels of HMGB1 were assayed by ELISA (n=3, means ± SEM, *P < 0.05 by ANOVA LSD test). AU= arbitrary unit.
Figure 4
Figure 4. Lactate, a product of aerobic glycolysis, promotes HMGB1 acetylation and release
(a) RAW 264.7 cells were transfected with indicated shRNA for 48 hours and then stimulated with lipopolysaccharide (LPS) (100 ng ml−1) for six-24 hours. The lactate level in the culture medium was assayed (n=3, means ± SEM, *P < 0.05 versus control shRNA group by ANOVA LSD test). (b–c) RAW 264.7 cells were transfected with GRP81 shRNA and control shRNA for 48 hours and then stimulated with lactate (5 mM) for six hours. GRP81 expression (b), cell viability (c), and HMGB1 release (c) were assayed (n=3, means ± SEM, *P < 0.05 by ANOVA LSD test). (d) RAW 264.7 cells were stimulated with 3-phosphoglycerate (3PG, 2 mM) and 2-phosphoglycerate (2PG, 2 mM), phosphoenolpyruvate (PEP, 2 mM) for six hours and levels of lactate and HMGB1 release were assayed (n=3, means ± SEM, *P < 0.05 versus untreated group by ANOVA LSD test). (e) RAW 264.7 cells were stimulated with lactate (5 mM) for six hours and levels of acetylated HMGB1 were assayed. (f) RAW 264.7 cells were stimulated with LPS (100 ng ml−1) for 24 hours and the levels of acetylated HMGB1 were assayed. (g) RAW 264.7 cells were stimulated with LPS (100 ng ml−1), lactate (5 mM) and PEP (2 mM) for 24 hours. Histone deacetylase (HDAC) activity was assayed (n=3, means ± SEM, *P < 0.05 versus untreated group by ANOVA LSD test). (h-j) RAW 264.7 cells were stimulated with Trichostatin A (TSA) (2 µM) and/or LPS (100 ng ml−1) for 24 hours. HDAC activity (h) and acetylated HMGB1 (i) and HMGB1 release (j) were assayed (n=3, means ± SEM, *P < 0.05 by ANOVA LSD test). (k) RAW 264.7 cells were stimulated with lactate (5 mM, six hours) with or without anti-HMGB1 neutralizing antibody (2 µg ml−1) and levels of TNF-α release were assayed (n=3, means ± SEM, *P < 0.05 by ANOVA LSD test).
Figure 5
Figure 5. A potential PKM2 inhibitor shikonin protects mice from lethal endotoxemia and sepsis
(a) Mice (n=20 group−1) were injected with a single dose of shikonin (8 mg kg−1), followed 30 minutes later by an infusion of endotoxin (LPS, 5 mg kg−1, intraperitoneally), and were then re-treated with shikonin 12 and 24 hours later. The Kaplan-Meyer method was used to compare the differences in survival rates between groups (*, P<0.05). (b–e) In parallel experiments, the PKM2 activity in peritoneal macrophages (b) and serum levels of lactate (c), IL-1β (d), and HMGB1 (e) at indicated time points were measured (n=3–5 animals group−1, values are mean ± SEM, *, P<0.05 by ANOVA LSD test). (f) The cecal ligation and puncture (CLP) technique was used to induce intraabdominal sepsis in mice (n=20 group−1). Repeated administration of shikonin (8 mg kg−1) at 24, 48, and 72 hours after CLP significantly increased survival, as compared with vehicle group (*, P<0.05), as measured by Kaplan-Meyer test. (g–i) In parallel, the PKM2 activity in peritoneal macrophages (g) and serum levels of lactate (h) and HMGB1 (i) at indicated time points were measured (n=3–5 animals group−1, values are mean ± SEM, *, P<0.05 by ANOVA LSD test).

References

    1. Angus DC, van der Poll T. Severe sepsis and septic shock. N Engl J Med. 2013;369:840–851. - PubMed
    1. Vincent JL, et al. International study of the prevalence and outcomes of infection in intensive care units. JAMA. 2009;302:2323–2329. - PubMed
    1. Tracey KJ, et al. Anti-cachectin/TNF monoclonal antibodies prevent septic shock during lethal bacteraemia. Nature. 1987;330:662–664. - PubMed
    1. Dinarello CA, Thompson RC. Blocking IL-1: interleukin 1 receptor antagonist in vivo and in vitro. Immunol Today. 1991;12:404–410. - PubMed
    1. Wang H, et al. HMG-1 as a late mediator of endotoxin lethality in mice. Science. 1999;285:248–251. - PubMed

Publication types

MeSH terms