. 2014 Jul 14:5:4372.
doi: 10.1038/ncomms5372.

Direct induction of haematoendothelial programs in human pluripotent stem cells by transcriptional regulators

Affiliations

Direct induction of haematoendothelial programs in human pluripotent stem cells by transcriptional regulators

Irina Elcheva et al. Nat Commun. .

Abstract

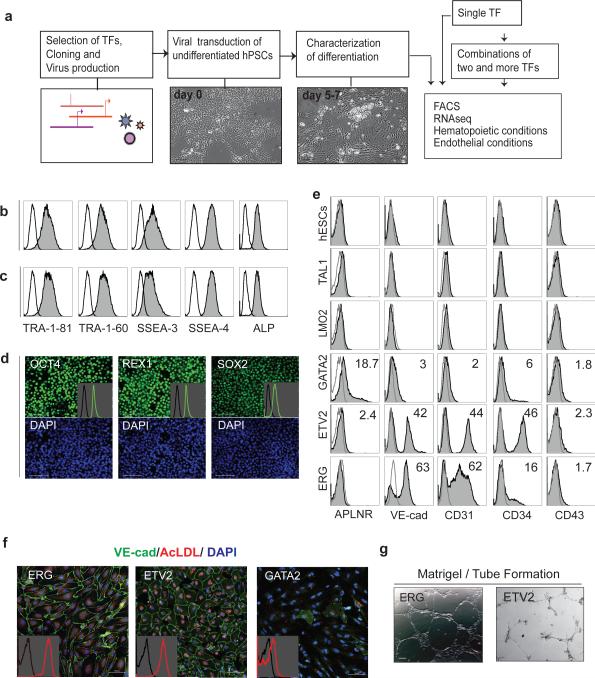
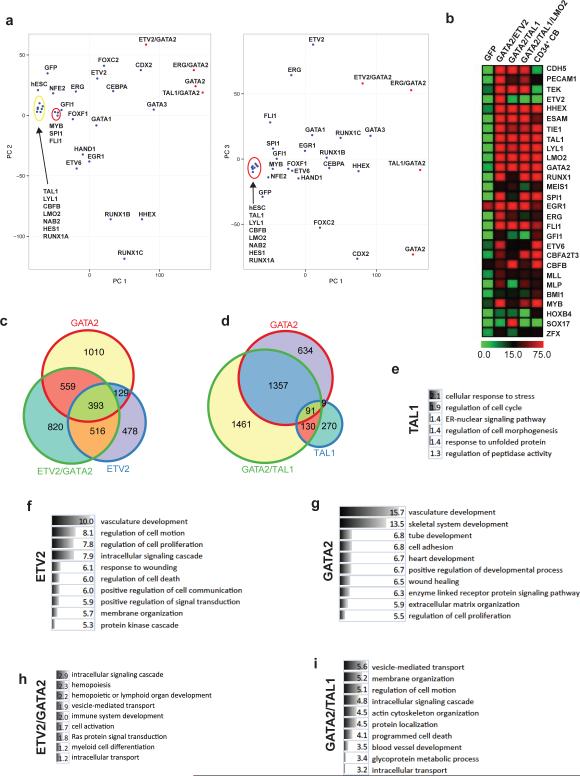
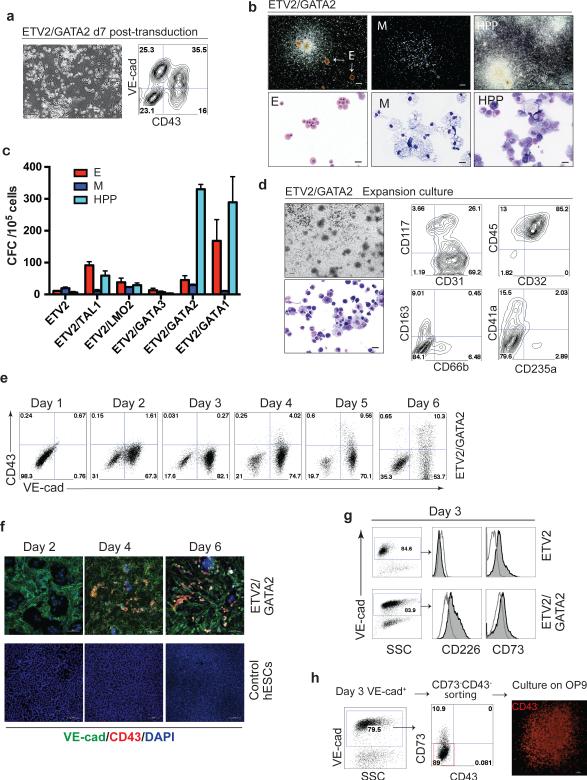
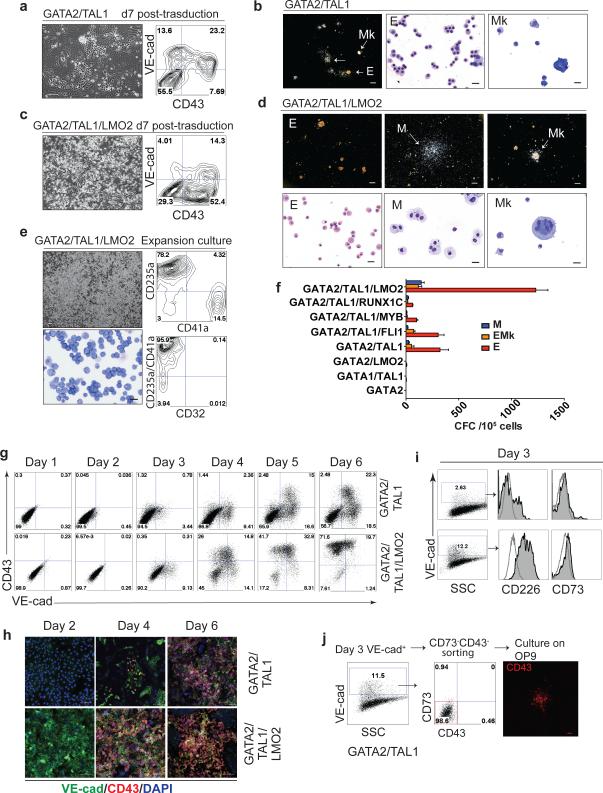
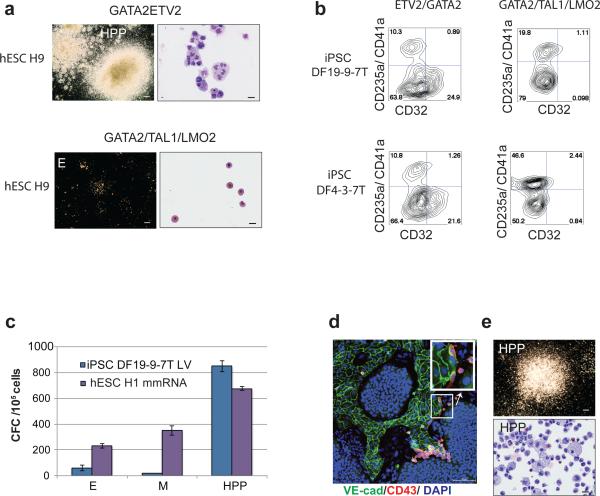
Advancing pluripotent stem cell technologies for modelling haematopoietic stem cell development and blood therapies requires identifying key regulators of haematopoietic commitment from human pluripotent stem cells (hPSCs). Here, by screening the effect of 27 candidate factors, we reveal two groups of transcriptional regulators capable of inducing distinct haematopoietic programs from hPSCs: pan-myeloid (ETV2 and GATA2) and erythro-megakaryocytic (GATA2 and TAL1). In both cases, these transcription factors directly convert hPSCs to endothelium, which subsequently transform into blood cells with pan-myeloid or erythro-megakaryocytic potential. These data demonstrate that two distinct genetic programs regulate the haematopoietic development from hPSCs and that both of these programs specify hPSCs directly to haemogenic endothelial cells. In addition, this study provides a novel method for the efficient induction of blood and endothelial cells from hPSCs via the overexpression of modified mRNA for the selected transcription factors.


Figures

Figure 1
Figure 1. Gain-of-function screening in hPSCs
(a) Schematic diagram of the screening system; (b-d) Flow cytometric and immunofluorescent analysis of expression of pluripotency markers in H1 hESCs growing on matrigel for 5 days in standard conditions in mTeSR1 medium (b) and basal growth-factor free TeSR1 medium containing 100 ng ml−1 SCF, 50 ng ml−1 TPO, and 20 ng ml−1 bFGF (c and d). Inserts in (d) show analysis of expression of indicated markers by flow cytometry; (e) Flow cytometric analysis of mesodermal, endothelial and hematopoietic markers in control hESCs and hESCs transduced with indicated TFs on day 5 post-transduction; (f,g) ETV2- and ERG-transduced cells acquire endothelial characteristics as shown by positive VE-cadherin immunostaining, AcLDL uptake (f) and formation of endothelial tubes (g). Inserts in (f) shows analysis of AcLDL uptake by flow cytometry. Scale bar, d,f,g, 100 μm.
Figure 2
Figure 2. Gene expression profiling of hESCs transduced with transcription factors
(a) Principal Component (PC) analysis of global gene expression demonstrates the differences in global gene expression in H1 hESCs transduced with indicated genes. The relative distance is collapsed to two PC1/PC2 and PC1/PC3 dimensions. hESC is non-transduced H1 hESCs control. (b) Heat map shows the expression of genes associated with HSC development, expansion and self-renewal in hESCs transduced with blood-inducing combinations and CD34+ cord blood cells. Gene expression is estimated in tpm values. (c-d) The Venn diagrams summarize the number of overlapping and selectively induced genes in hESCs transduced with ETV2, GATA2, TAL1, ETV2/GATA2, and GATA2/TAL1 TFs. Venn diagram shows differentially expressed genes as compared to control hESCs (posterior probability ≥ 0.99 as determined by EBseq analysis). There is a high overlap between ETV2 and GATA2 induced genes. TAL1 alone has little effect on gene expression, however in combination with GATA2, TAL1 causes profound changes in the transcriptome. (e-i) The classification of genes induced by indicated combinations of factors into functional categories defined by Gene Ontology (GO) Term using DAVID program. For GO analysis, each gene set was reduced to include only genes with tpm≥10 in at least 1 sample. ETV2/GATA2 and GATA2/TAL1 show genes uniquely induced by two factors together as compare to single factor-transduced cells. The all (TAL1, ETV2/GATA2) or top ten (ETV2, GATA2, GATA2/TAL1) significantly overrepresented categories with FDR below 0.05 (computed according to Benjamini-Hochberg method) are shown.
Figure 3
Figure 3. Hematopoietic differentiation of hESCs induced by ETV2 and GATA2
(a) Cell morphology and flow cytometric analysis of ETV2/GATA2-transduced H1 hESCs on day 7 post-transduction. Scale bar, 100 μm. (b) Types of hematopoietic colonies formed by hESCs on day 7 post-transduction with ETV2/GATA2. Erythroid colonies (E); macrophage colonies (M); high proliferative potential myeloid colonies (HPP). Scale bar for CFC-assay, 250 μm; cytospins, 20μm. (c) CFC potential of cells transduced with ETV2 alone and indicated TF combinations. Error bars represent s.e.m. from 3 to 5 independent experiments. (d) Phase-contrast photograph of the culture, Wright-stained cytospin and FACS analysis of ETV2/GATA2-induced hematopoietic cells grown in suspension culture for 14 days in medium supplemented with FBS and 100 ng ml−1 SCF, 10 ng ml−1 IL3, 20 ng ml−1 IL6, 10 ng ml−1 GM-CSF, 20 ng ml−1 G-CSF, and 3 u ml−1 EPO. (e) Kinetic analysis of VE-cadherin and CD43 expression during direct ETV2/GATA2 programing of H1 hESCs by flow cytometry. (f) VE-cadherin and CD43 immunofluorescent staining of untreated control hESCs and hESCs transduced with ETV2/GATA2 at different time points after transduction. Scale bars, 100 μm. (g) Expression of markers of associated with hemogenic and non-hemogenic endothelium by VE-cadherin+ cells emerging on day 3 post-transduction with indicated TFs. Histograms show expression of CD226 and CD73 by VE-cadherin-gated cells. Endothelial cells induced by ETV2 alone have CD226CD73+ phenotype associated with non-hemogenic endothelial cells, while ETV2/GATA2 induced endothelium have CD226+CD73 phenotype associated with hemogenic endothelium . (h) Hematopoietic potential of VE-cadherin+CD43CD73 endothelial cells isolated from programing cultures. On day 3 after transduction with ETV2/GATA2, VE-cadherin+CD43CD73 cells were isolated by sorting and cultured on OP9 to assess the hematopoietic potential by counting CD43+ hematopoietic colonies using immunofluorescent staining. Blue and red rectangles show position of gates used for cell sorting. Scale bar, 100 μm.
Figure 4
Figure 4. Hematopoietic differentiation of hESCs induced by GATA2 and TAL1
(a) Cell morphology and flow cytometric analysis of H1 hESCs differentiated by expression of GATA2 and TAL1 on day 7 post-transduction. (b) Types of hematopoietic colonies formed by GATA2 and TAL1 differentiated cells on day 7 post-transduction. Erythroid colonies (E); macrophage colonies (M); megakaryocytic colonies (Mk). Scale bar for CFC-assay, 250μm; for cytospins, 20μm. (c) Cell morphology and flow cytometric analysis of H1 hESCs differentiated by expression of GATA2/TAL1/LMO2 on day 7 post-transduction. (d) Types of hematopoietic colonies formed by GATA2/TAL1/LMO2 differentiated cells on day 7 post-transduction. Scale bar for CFC-assay, 250μm; for cytospins, 20μm. (e) Phenotypic characterization of GATA2/TAL1/LMO2-induced hematopoietic cells grown in SFEM serum-free medium supplemented with 100 ng ml−1 SCF, 50 ng ml−1 TPO, 3 u ml−1 EPO, and 20 ng ml−1 bFGF for 14 days. (f) CFC potential of hESCs transduced with GATA2-based combinations. Error bars represent s.e.m. from 3 experiments. (g) Kinetic analysis of VE-cadherin and CD43 expression by flow cytometry following transduction of H1 hESCs with indicated combinations of TFs. (h) VE-cadherin and CD43 immunofluorescent staining of hESCs transduced with indicated TFs at different time points after transduction. Scale bars, 100 μm. (i) Expression of markers of associated with hemogenic and non-hemogenic endothelium by VE-cadherin+ cells emerging on day 3 post-transduction with GATA2/TAL1 (upper panels) and GATA2/TAL1/LMO2 (lower panels). Histograms show expression of CD226 and CD73 by VE-cadherin-gated cells. Endothelial cells induced by GATA2/TAL1 and GATA2/TAL1/LMO2 shows CD226+CD73 phenotype associated with hemogenic endothelium . (j) Hematopoietic potential of VE-cadherin+CD43CD73 endothelial cells isolated from GATA2/TAL1 programing cultures. On day 3 after transduction with GATA2/TAL1 or ETV2/GATA2, VE-cadherin+CD43CD73 cells were isolated by sorting and cultured on OP9 to assess the hematopoietic potential by counting CD43+ hematopoietic colonies using immunofluorescent staining. Blue and red rectangles show position of gates used for cell sorting. Scale bar, 100 μm.
Figure 5
Figure 5. Direct hematopoietic programming of various hPSCs using lentiviral vectors and mmRNA
(a) CFCs developed from H9 hESCs 7 days after enforced expression of ETV2/GATA2 and GATA2/TAL1/LMO2. (b) FACS analysis of ETV2/GATA2 and GATA2/TAL1/LMO2 transduced iPSC lines DF-19-9-7T and DF-4-3-7T after expansion in suspension cultures in the presence of hematopoietic cytokines (14 day post-transduction). (c) CFC potential of DF19-9-7T hiPSCs transduced with ETV2 and GATA2 lentiviral vectors (LV) and H1 hESCs transfected with ETV2 and GATA2 mmRNA. Error bars represent s.e.m. from 3 experiments. (d) Confocal image of H1 hESC culture five days after transduction with ETV2/GATA2 mmRNA. Insert shows the digital zoom of the area outlined by white rectangle where cells are undergoing endothelial-hematopoietic transition. Scale bar 100 μm. (e) HPP CFCs induced in H1 hESCs by ETV2/GATA2 mmRNA; CFC assay scale bar, 250 μm, cytospins, 20 μm.

Similar articles

Cited by

References

    1. Davidson EH. Emerging properties of animal gene regulatory networks. Nature. 2010;468:911–920. doi:10.1038/nature09645. - PMC - PubMed
    1. Godin I, Cumano A. The hare and the tortoise: an embryonic haematopoietic race. Nat Rev Immunol. 2002;2:593–604. - PubMed
    1. Lessard J, Faubert A, Sauvageau G. Genetic programs regulating HSC specification, maintenance and expansion. Oncogene. 2004;23:7199–7209. - PubMed
    1. Teitell MA, Mikkola HK. Transcriptional activators, repressors, and epigenetic modifiers controlling hematopoietic stem cell development. Pediatr Res. 2006;59:33R–39R. doi:10.1203/01.pdr.0000205155.26315.c7. - PubMed
    1. Wilson NK, Calero-Nieto FJ, Ferreira R, Gottgens B. Transcriptional regulation of haematopoietic transcription factors. Stem Cell Res Ther. 2011;2:6. doi:10.1186/scrt47. - PMC - PubMed

Publication types

Substances

Associated data