. 2014 Nov 1:101:225-35.
doi: 10.1016/j.neuroimage.2014.07.009. Epub 2014 Jul 12.

Brain representations for acquiring and recalling visual-motor adaptations

Affiliations

Brain representations for acquiring and recalling visual-motor adaptations

Patrick Bédard et al. Neuroimage. .

Abstract

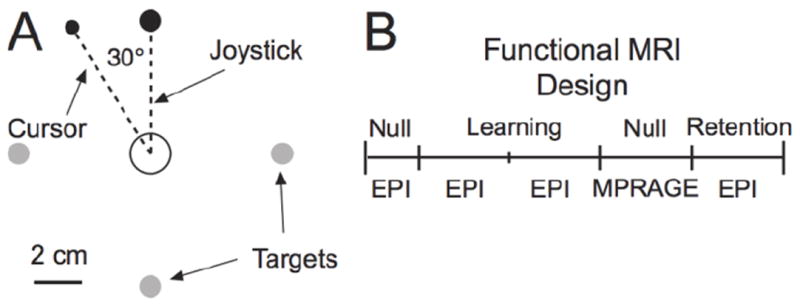
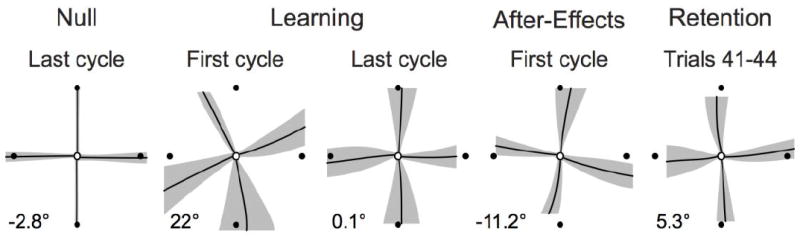
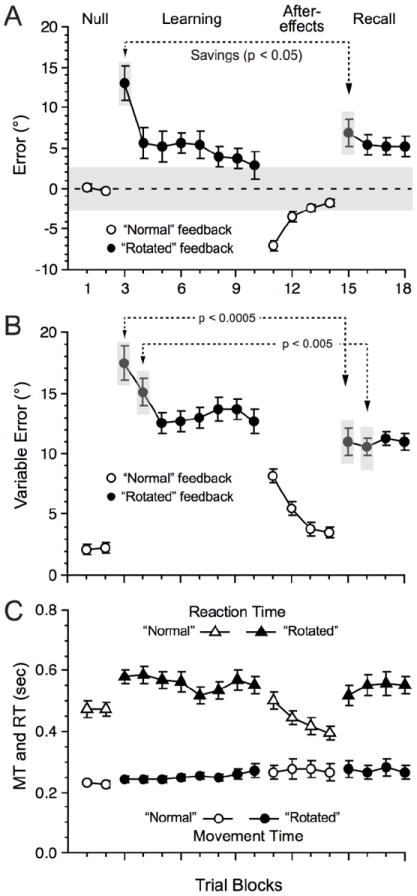
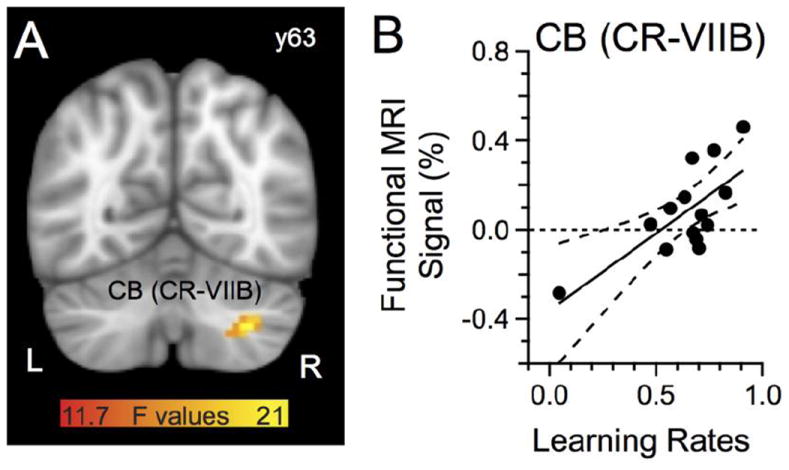
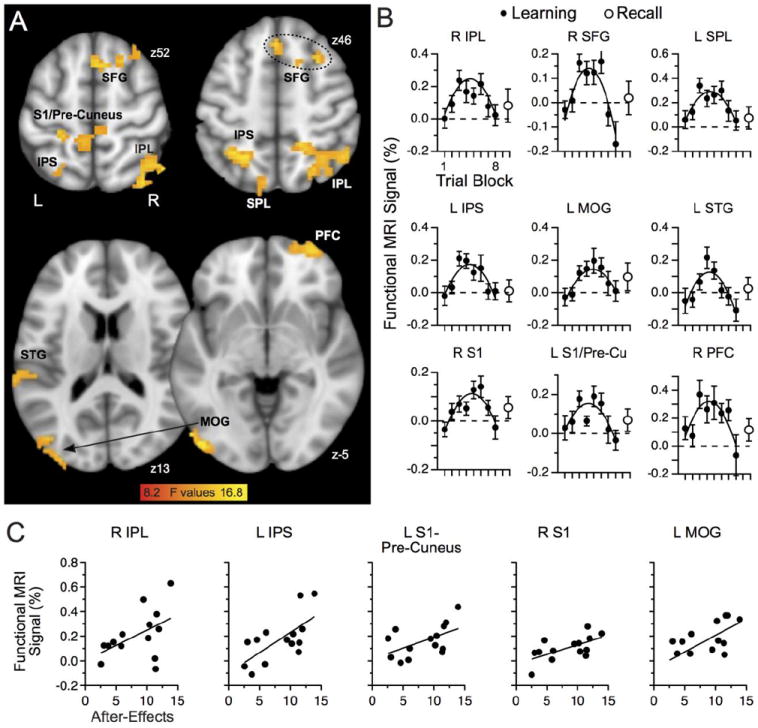
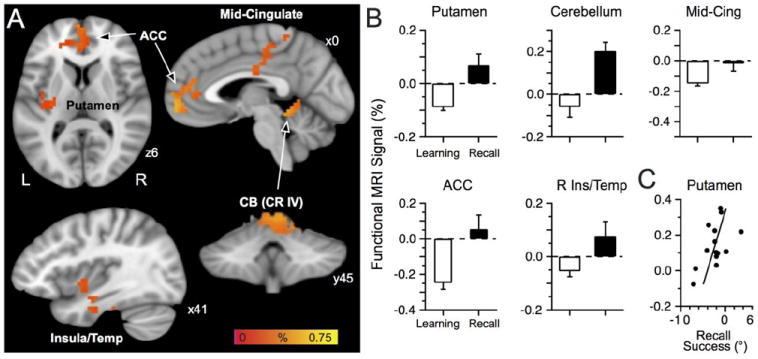
Humans readily learn and remember new motor skills, a process that likely underlies adaptation to changing environments. During adaptation, the brain develops new sensory-motor relationships, and if consolidation occurs, a memory of the adaptation can be retained for extended periods. Considerable evidence exists that multiple brain circuits participate in acquiring new sensory-motor memories, though the networks engaged in recalling these and whether the same brain circuits participate in their formation and recall have less clarity. To address these issues, we assessed brain activation with functional MRI while young healthy adults learned and recalled new sensory-motor skills by adapting to world-view rotations of visual feedback that guided hand movements. We found cerebellar activation related to adaptation rate, likely reflecting changes related to overall adjustments to the visual rotation. A set of parietal and frontal regions, including inferior and superior parietal lobules, premotor area, supplementary motor area and primary somatosensory cortex, exhibited non-linear learning-related activation that peaked in the middle of the adaptation phase. Activation in some of these areas, including the inferior parietal lobule, intra-parietal sulcus and somatosensory cortex, likely reflected actual learning, since the activation correlated with learning after-effects. Lastly, we identified several structures having recall-related activation, including the anterior cingulate and the posterior putamen, since the activation correlated with recall efficacy. These findings demonstrate dynamic aspects of brain activation patterns related to formation and recall of a sensory-motor skill, such that non-overlapping brain regions participate in distinctive behavioral events.

Keywords: Event-related functional MRI; Learning; Recall; Visual–motor adaptation.


Conflict of interest statement

Conflict of Interest: We have no conflict of interest.

Figures

Fig. 1
Fig. 1
Task schematic. A: Targets appeared one at a time at random jittered times. In the visual perturbation condition, the cursor trajectory was deviated by 30° CCW from the intended joystick trajectory. B: Experimental design illustrating the sequence of trial types. Additional details in Methods.
Fig. 2
Fig. 2
Averaged trajectories across all participants in the Null, Learning, Null, and Recall conditions. The black lines represent the average and the grey regions represent the variability of the joystick trajectories across participants (mean ± s.e.m. of all 14 participants). Note the improved trajectory from the first to the last cycle of the Learning phase. Also note that the trajectories at Recall resembled those occurring during late Learning. The numerical value (lower left of each section) reflects the group mean error for each set of trials).
Fig. 3
Fig. 3
Behavioral performance across the experiment averaged over blocks of 20 trials (mean ± s.e.m. of all 14 participants). A: Reaching error. A repeated measures, one-way ANOVA across the blocks of the Null and Learning phase yielded a significant main effect: F(9, 117) = 10.12, p < 0.0001. Post-hoc tests with the Newman-Keuls procedure (p ≤ 0.05), corrected for multiple comparisons revealed significant differences between each of block 1 and 2 and blocks 3, 4, 5, 6, 7 and also between block 3 and 4. At Recall, error (Fig 3A) was slightly, but significantly, greater (pooled across the four blocks) than Learning (last two blocks; t(13) = 3.56, p ≤ 0.005). B: Reaching variability (standard deviation). A one-way ANOVA across the blocks of the Null and Learning phase was significant, F(9, 117) = 42.9, p < 0.0001. Post-hoc tests revealed significant differences between each of block 1 and 2 compared to blocks 3 to 10; also between block 3 and blocks 4 to 10. At Recall, reaching variability was, conversely to error (Fig 3A), slightly but significantly lower at Recall than during Learning (t(13) = 3.79, p ≤ 0.005). C: MT and RT. MT remained relatively constant across all experimental phases, but the one-way ANOVA was significant, F(9, 117) = 2.55, p = 0.01. Post-hoc tests only revealed significant difference between the Null blocks and the last Learning block. Note that during the Learning phase, MT increased slightly from block 3 to block 10 (means and s.e.m. of 243 ± 10 msec vs. 268 ± 22 msec, respectively) but this increase was not statistically significant (t(13) = 1.15, p > 0.27). Concerning RT, the one-way ANOVA was significant, F(9, 117) = 7.18, p < 0.0001, and RT was lower during the Null blocks than during the Learning blocks. But there was no significant difference from late Learning to Recall (t(13) = 1.32, p > 0.21). During the learning phase RT remained constant from block 3 to block 10 (t(13) = 1.19, p > 0.26). The grey shaded area in A indicates the angle subtended by the target relative to the start position.
Fig. 4
Fig. 4
Functional MRI signal (%) correlated with rates of decreasing error. A: Cerebellum region with activation that correlated with a power function. B: Functional MRI signal (%) relationship with rates of decreasing error; one data point per subject. The dashed lines represent the 95% confidence band of the regression. The color bar represents the F statistics of the regression. L, left hemisphere. The anatomical underlay in this and subsequent figures is the MNI template provided by FSL.
Fig. 5
Fig. 5
Learning-related activation. A: Regions with quadratic fit to observed activation included frontal and parietal cortices. B: Functional MRI signal (%) across the Learning phase (black circles) and Recall phase (open circles) for regions with a significant quadratic fit. C: Regions having activation correlated with the magnitude of after-effects; one data point per participant. The color bar represents the F statistics of the regression. See Table 1 for more details.
Fig. 6
Fig. 6
Recall-related activation. A: Regions with more activation at Recall than late learning included the ACC, mid-cingulate, putamen, and cerebellum. The color bar represents the percent signal of the contrast Learning vs. Recall. B: Functional MRI signal during the late Learning phase (last two blocks pooled) and Recall (all four blocks pooled) for brain regions with a Recall-related signal. C: Regression analysis of brain activation vs. recall success revealed that the putamen activation correlated with recall success; one data point per participant.

References

    1. Andersen RA, Cui H. Intention, action planning, and decision making in parietal-frontal circuits. Neuron. 2009;63:568–58. - PubMed
    1. Bédard P, Proteau L. On the role of static and dynamic visual afferent information in goal-directed aiming movements. Exp Brain Res. 2001;138:419–431. - PubMed
    1. Bédard P, Proteau L. On-line vs. off-line utilization of peripheral visual afferent information to ensure spatial accuracy of goal-directed movements. Exp Brain Res. 2004;158:75–85. - PubMed
    1. Bédard P, Sanes JN. On a basal ganglia role in learning and rehearsing visual-motor associations. NeuroImage. 2009;47:1701–1710. - PMC - PubMed
    1. Bédard P, Sanes JN. Basal ganglia-dependent processes in recalling learned visual-motor adaptations. Exp Brain Res. 2011;209(3):385–393. - PubMed

Publication types

LinkOut - more resources