. 2014 Jul 21;206(2):245-56.
doi: 10.1083/jcb.201401091. Epub 2014 Jul 14.

Force on spindle microtubule minus ends moves chromosomes

Affiliations

Force on spindle microtubule minus ends moves chromosomes

Mary Williard Elting et al. J Cell Biol. .

Abstract

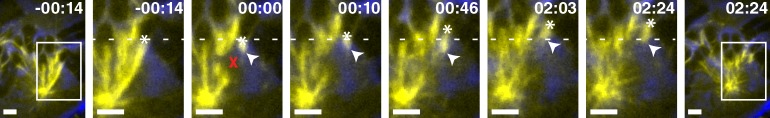
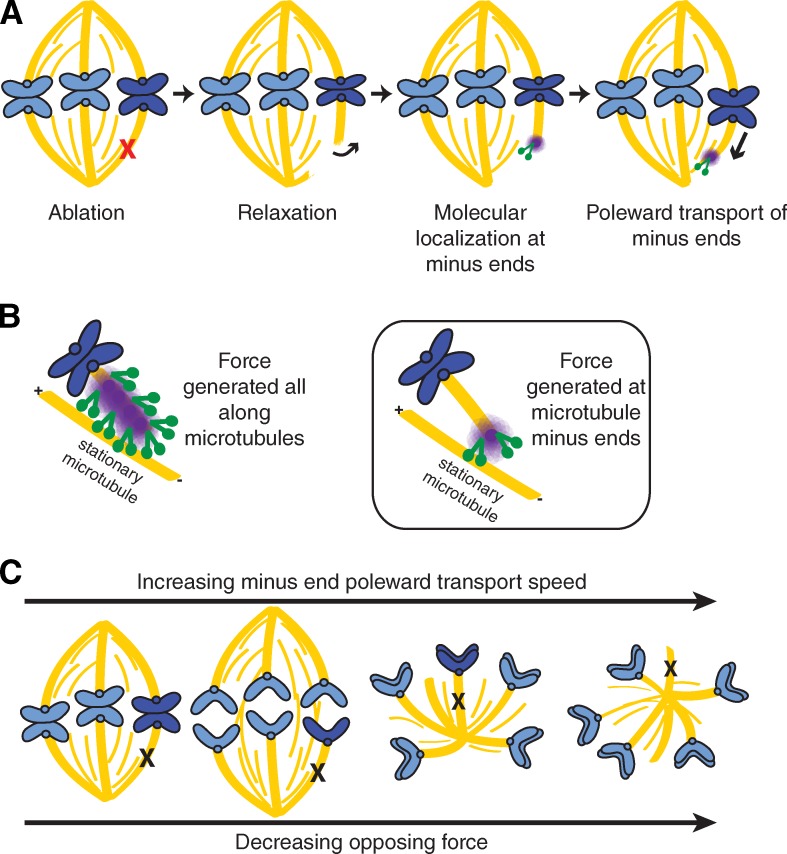
The spindle is a dynamic self-assembling machine that coordinates mitosis. The spindle's function depends on its ability to organize microtubules into poles and maintain pole structure despite mechanical challenges and component turnover. Although we know that dynein and NuMA mediate pole formation, our understanding of the forces dynamically maintaining poles is limited: we do not know where and how quickly they act or their strength and structural impact. Using laser ablation to cut spindle microtubules, we identify a force that rapidly and robustly pulls severed microtubules and chromosomes poleward, overpowering opposing forces and repairing spindle architecture. Molecular imaging and biophysical analysis suggest that transport is powered by dynein pulling on minus ends of severed microtubules. NuMA and dynein/dynactin are specifically enriched at new minus ends within seconds, reanchoring minus ends to the spindle and delivering them to poles. This force on minus ends represents a newly uncovered chromosome transport mechanism that is independent of plus end forces at kinetochores and is well suited to robustly maintain spindle mechanical integrity.


Figures

Figure 1.
Figure 1.
Microtubule severance triggers a response that rapidly pulls detached microtubules toward spindle poles. (A) To probe forces that maintain spindle poles, we challenge the spindle steady-state by detaching microtubules from poles using laser ablation. (B–F) Time-lapse live images of GFP–α-tubulin PtK2 cells (phase contrast, blue; GFP–α-tubulin, yellow). Time is in min:s, with frame captured immediately after ablation set to 00:00. Bars, 2 µm. Arrowheads mark minus ends of ablated microtubules. Dotted lines indicate the position of the kinetochore end of the ablated k-fiber (B–D and F) or bundle minus end (E) immediately before ablation. (B) Representative response of metaphase spindle to k-fiber laser ablation (marked by X). After ablation, the centromere initially relaxes, causing the ablated k-fiber stub to move upward (00:00–00:08). During this time, the k-fiber stub also rotates freely and the uncapped (and unstable) microtubule plus ends depolymerize. Then, the k-fiber stub is pulled rapidly poleward, stretching the centromere and dragging the attached chromosome poleward (00:08–02:01). Minus ends are reincorporated into the spindle (rightmost panel), and the chromosome then resumes typical metaphase oscillations (not depicted). The kinetochore whose k-fiber is ablated is marked by an asterisk and its sister by an o. See also Video 1. (C) Representative response of anaphase spindle to k-fiber laser ablation (X). After ablation, the k-fiber stub rotates freely and its attached chromatid moves upward (00:00–00:21). Upon apparent contact with a neighboring microtubule (00:21), the k-fiber stub is pulled poleward faster than typical anaphase chromatid movement (times 00:21–01:15). The kinetochore of the ablated k-fiber (*) is pulled rapidly toward the pole, passing a neighboring control chromosome (o). See also Fig. S2 and Video 2. (D) Representative response of monopolar spindle to k-fiber laser ablation (X). Immediately after ablation, the k-fiber stub rotates freely, but its attached chromosome does not move upward, consistent with a lack of force from a sister half-spindle (00:00–00:07). Then, the k-fiber stub is pulled poleward, dragging the attached chromosome by its kinetochore (*; 00:07–00:35). The kinetochore of an unmanipulated neighboring k-fiber is marked by o. See also Video 3. (E) Representative response of monopolar spindle to non–k-fiber bundle laser ablation (X). Almost immediately after ablation, the severed non–k-fiber bundle is rapidly pulled toward the pole (00:06–00:32). See also Video 4. (F) Representative response of cell to ablation (X) of the newly created microtubule minus end. After a first ablation (00:00), the k-fiber stub (kinetochore marked by asterisk) is pulled poleward (00:00–00:53). A second ablation destroys the k-fiber stub minus end (01:03), and poleward movement temporarily stops (01:03–01:10), suggesting that poleward force generation requires the minus end. A second poleward transport phase follows this pause (01:28–01:46). See also Video 7.
Figure 2.
Figure 2.
Dynamics of the poleward transport response suggest it acts rapidly and moves chromosomes robustly across different spindle architectures. (A) Change in the distance from chromosomes to the pole before and after ablation of their k-fibers in metaphase bipolar spindles. After ablation, chromosomes attached to ablated k-fibers (blue traces, n = 18) are pulled poleward, whereas neighboring control chromosomes (green traces, n = 14) continue oscillating. (B) Change in the distance from chromatids to the pole before and after ablation of their k-fibers during anaphase. Chromatids attached to ablated k-fibers (blue traces, n = 10) are pulled toward poles faster than anaphase movement of their unmanipulated sister chromatids (green traces, n = 10) before resuming normal anaphase movement around 70 s. See also Fig. S2. (C) Change in the distance from chromosomes to the pole before and after the ablation of their k-fibers in monopolar spindles. After ablation of their k-fibers, chromosomes are rapidly pulled toward poles (blue traces, n = 37) before resuming normal oscillations. (D) Zoom of traces from C displaying only from start to end of the poleward transport response of each trace, synchronized to individual response start times (0 s). (E) Change in the distance from chromosomes to the pole during repeated ablation experiments in bipolar (top) and monopolar (bottom) spindles (four example traces of each). Traces are shown in gray before the first ablation, in solid blue after the first ablation (which severs the k-fiber), and in solid red after the second ablation (which destroys the new, free minus ends). Dotted lines connect points before and after ablation. Poleward transport begins after the first ablation but temporarily stops when the k-fiber stub minus end is destroyed by the second ablation, suggesting that poleward transport requires mechanical engagement of the minus end.
Figure 3.
Figure 3.
Dynein function is required for the poleward transport response. Time-lapse live images of a metaphase GFP–α-tubulin PtK2 spindle (phase contrast, blue; GFP–α-tubulin, yellow) response to k-fiber laser ablation when dynein cargo binding is inhibited by transfection of a dominant-negative p150 fragment. After laser ablation (X), the targeted k-fiber rotates (00:00–00:10) and splays (e.g., 02:03). No significant poleward movement of the newly generated k-fiber minus ends (arrowhead) and attached chromosome (kinetochore marked by asterisk) is observed. Minus ends are not reincorporated into the spindle by 02:24 (compare with delays in Fig. S1 B) despite nearby microtubule populations (e.g., 00:46). The spindle is fragmented and multipolar, as described after transfection with this p150 fragment (Quintyne and Schroer, 2002). Dotted line indicates the position of the kinetochore end of the ablated k-fiber immediately before ablation. Time is in min:s, with frame captured immediately after ablation set to 00:00. Bars, 2 µm. See also Video 5.
Figure 4.
Figure 4.
NuMA and dynactin are recruited specifically to newly generated minus ends. (A) Live images of a GFP–α-tubulin PtK2 spindle immediately before and after k-fiber ablation at targeted sites (X). (B) Representative immunofluorescence image of NuMA, α-tubulin, and DNA (Hoescht) in cell from A, fixed after ablation. NuMA (arrowheads) localizes to new minus ends. (C) Live images of a GFP–α-tubulin PtK2 monopolar spindle (phase contrast [blue] to identify chromosome locations; α-tubulin, red) immediately before (left) and after (right) ablation of non–k-fiber bundles (each ablation site marked by white X). One k-fiber is also ablated (gray X). (D) Representative immunofluorescence image of NuMA, α-tubulin, and kinetochores (CREST) in two planes of same cell from C, fixed after ablation. NuMA (arrowheads) localizes to new minus ends. In Plane 1, new minus ends are not yet reincorporated into the spindle; in Plane 2, the new minus ends appear to have moved poleward along another microtubule bundle (note contact between the microtubule bundles at the new NuMA-marked minus ends). (E) Live images of a GFP–α-tubulin PtK2 spindle immediately before and after k-fiber ablation at targeted sites (X). (F) Representative immunofluorescence images of NuMA, dynactin subunit p150, and α-tubulin in cell from E, fixed after ablation. Arrowheads mark NuMA and p150 recruited to new minus ends. The ablated k-fiber on the left has associated with other microtubules before fixation, whereas the minus ends of the ablated k-fiber on the right remain unattached. (G) Line scan analysis of NuMA, dynactin subunit p150, and α-tubulin intensity along dashed line in F. NuMA and p150 colocalize at new microtubule minus ends, and loss of tubulin intensity confirms ablation. Representative example of five ablations in four cells. Bars: (A–E) 2 µm; (F) 1 µm.
Figure 5.
Figure 5.
Dynactin and NuMA identify new minus ends within seconds and escort them to spindle poles. (A and E) Representative time-lapse live images of PtK2 cells expressing GFP-Arp1A (A) or GFP-NuMA (E). Arp1A and NuMA (arrowheads) are recruited to the sites of ablation (X) within seconds and move rapidly and processively poleward. GFP-Arp1A and GFP-NuMA puncta move poleward until they are indistinguishable from poles. Time is in min:s, with frame captured immediately after ablation set to 00:00. See also Videos 8 and 10. (B and F) Kymographs along poleward path of GFP-Arp1A (B) or GFP-NuMA (F) puncta, between dashed lines in A and E. Note that the spindle pole itself (bright signal along bottom of kymograph) moves upward during minus end poleward transport, consistent with a reactive force on the spindle pole as the ablated k-fiber is pulled downward via a pole-connected track. (C) Representative time-lapse live images of cells expressing mCherry-tubulin and GFP-Arp1A reveal that recruited Arp1A (arrowheads) localizes at and moves with new microtubule minus ends after ablation (at X). The kinetochore of the ablated k-fiber is marked by an asterisk and a neighboring non-ablated kinetochore is marked by o. See also Video 9. Bars, 2 µm. (D) Kymograph along poleward path between dashed lines in C of ablated mCherry-tubulin k-fiber and GFP-Arp1A puncta. (G) Distance of GFP-NuMA puncta from ablation site as puncta move processively poleward after ablation. In some cases, stationary GFP-NuMA is detectable at the ablation site for up to 40 s before it moves poleward (see also Fig. S4). Red trace indicates the mean (error bars represent SEM) of 43 individual responses (blue traces). On average, the recruited GFP-NuMA first appears ∼0.5 µm farther away from the pole than the site of ablation, which is expected given an ablation area of ∼1 µm (see Materials and methods).
Figure 6.
Figure 6.
Forces on new microtubule minus ends move chromosomes and maintain spindle organization. (A) Model for rapid identification and organization of new spindle microtubule minus ends. NuMA (purple) and dynein/dynactin (green) rapidly localize to new microtubule minus ends after ablation (red X). Once dynein comes into contact with neighboring microtubules, it walks processively poleward along them, pulling the new minus ends as cargo and moving the attached chromosome (dark blue chromosome). (B) Imaging and biophysical analysis suggest that poleward transport is powered by force generation at minus ends of cargo microtubules. (C) Comparing the magnitudes of spindle forces. In all spindle structures studied, the poleward transport force overpowers other forces on chromosomes and/or microtubule bundles to move them toward poles. However, the speed of poleward movement increases as opposing forces decrease. Thus, the poleward transport force dominates but is tuned to other spindle forces, allowing it to maintain pole architecture without disrupting spindle integrity.

References

    1. Begg, D.A., and Ellis G.W.. 1979. Micromanipulation studies of chromosome movement. I. Chromosome-spindle attachment and the mechanical properties of chromosomal spindle fibers. J. Cell Biol. 82:528–541 10.1083/jcb.82.2.528 - DOI - PMC - PubMed
    1. Bird, A.W., and Hyman A.A.. 2008. Building a spindle of the correct length in human cells requires the interaction between TPX2 and Aurora A. J. Cell Biol. 182:289–300 10.1083/jcb.200802005 - DOI - PMC - PubMed
    1. Brugués, J., Nuzzo V., Mazur E., and Needleman D.J.. 2012. Nucleation and transport organize microtubules in metaphase spindles. Cell. 149:554–564 10.1016/j.cell.2012.03.027 - DOI - PubMed
    1. Burbank, K.S., Mitchison T.J., and Fisher D.S.. 2007. Slide-and-cluster models for spindle assembly. Curr. Biol. 17:1373–1383 10.1016/j.cub.2007.07.058 - DOI - PubMed
    1. Cameron, L.A., Yang G., Cimini D., Canman J.C., Kisurina-Evgenieva O., Khodjakov A., Danuser G., and Salmon E.D.. 2006. Kinesin 5–independent poleward flux of kinetochore microtubules in PtK1 cells. J. Cell Biol. 173:173–179 10.1083/jcb.200601075 - DOI - PMC - PubMed

Publication types

MeSH terms