. 2014 Jul 28;211(8):1525-31.
doi: 10.1084/jem.20140570. Epub 2014 Jul 14.

Gata6 regulates aspartoacylase expression in resident peritoneal macrophages and controls their survival

Affiliations

Gata6 regulates aspartoacylase expression in resident peritoneal macrophages and controls their survival

Emmanuel L Gautier et al. J Exp Med. .

Abstract

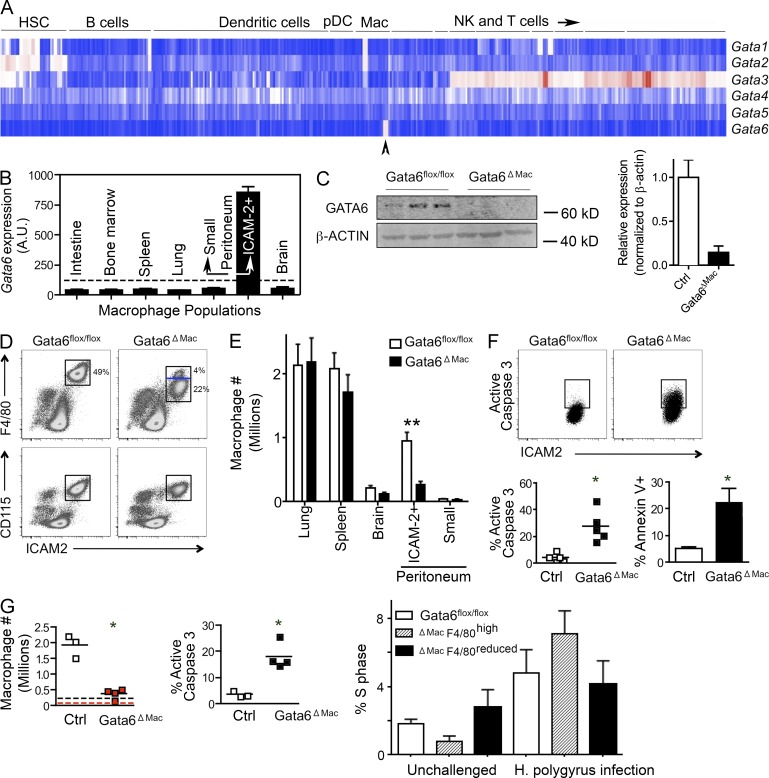
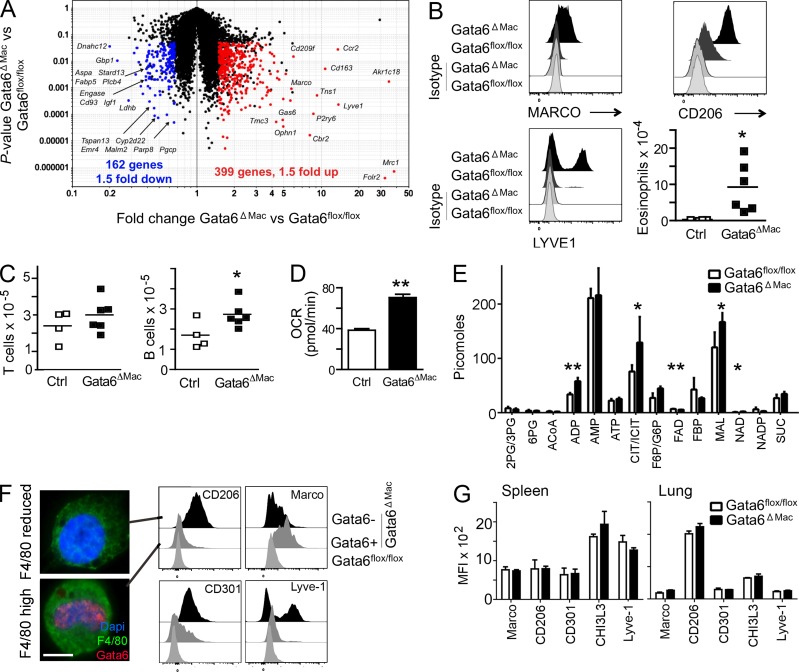
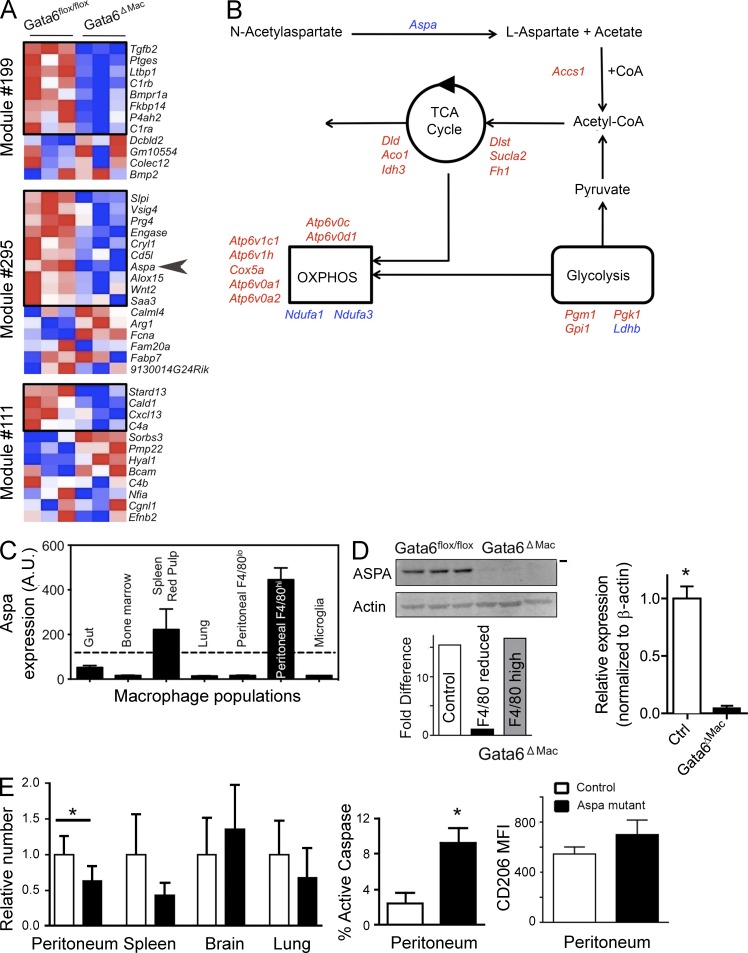
The transcription factor Gata6 regulates proliferation and differentiation of epithelial and endocrine cells and cancers. Among hematopoietic cells, Gata6 is expressed selectively in resident peritoneal macrophages. We thus examined whether the loss of Gata6 in the macrophage compartment affected peritoneal macrophages, using Lyz2-Cre x Gata6(flox/flox) mice to tackle this issue. In Lyz2-Cre x Gata6(flox/flox) mice, the resident peritoneal macrophage compartment, but not macrophages in other organs, was contracted, with only a third the normal number of macrophages remaining. Heightened rates of death explained the marked decrease in peritoneal macrophage observed. The metabolism of the remaining macrophages was skewed to favor oxidative phosphorylation and alternative activation markers were spontaneously and selectively induced in Gata6-deficient macrophages. Gene expression profiling revealed perturbed metabolic regulators, including aspartoacylase (Aspa), which facilitates generation of acetyl CoA. Mutant mice lacking functional Aspa phenocopied the higher propensity to death and led to a contraction of resident peritoneal macrophages. Thus, Gata6 regulates differentiation, metabolism, and survival of resident peritoneal macrophages.


Figures

Figure 1.
Figure 1.
Gata6 deficiency decreases peritoneal macrophage density and induces apoptosis. (A) Expression of mRNA for the GATA family of transcription factors within the resting hematopoietic system profiled by the Immunological Genome Project. Arrowhead points to peritoneal macrophage. (B) Signal intensity of gene expression for Gata6 from array data comparing resident macrophages from multiple organs. Dotted line, cutoff representing positive expression after data normalization. (C) Immunoblot for Gata6 on sorted macrophages, in which all ICAM-2+ macrophages were collected from each genotype. (D) Gata6+ macrophages quantified after cell counts and gating during flow cytometric analysis on cells expressing F4/80, ICAM-2, and CD115. Blue line in gate delineates loss of F4/80 surface intensity in most Gata6ΔMac macrophages. (E) Macrophage counts in various organs are plotted. (F) Percent macrophages expressing active caspase 3 or Annexin V. (G) Peritoneal macrophages quantified in mice infected with H. polygyrus. Enumeration of these macrophages plotted in control Gata6flox/flox mice (black) or Gata6ΔMac mice (red); baselines for each strain shown as dotted line in same color. Percent macrophages positive for active caspase 3 after H. polygyrus infection are plotted, and S phase was analyzed in unchallenged and infected mice. Data are derived from 2–8 experiments, with 2–5 replicates per group, performed for each part of the figure. Means ± SEM are shown. *, P < 0.05; **, P < 0.001 relative to controls using two-tailed Student’s t tests. Statistical significance in S phase analysis is not depicted, but all S phase analyses are statistically significant (one-way ANOVA) comparing unchallenged control mice to infected mice, P < 0.05, but differences between genotypes in the same condition are not significant.
Figure 2.
Figure 2.
Gene expression changes and alternative activation of Gata6ΔMac macrophages. (A) Scatter plots depict mRNA transcripts significantly decreased (left, blue) or increased (right, red) in Gata6flox/flox (Ctrl) versus Gata6ΔMac mice. (B) Expression of macrophage polarization and activation markers and eosinophil counts in the peritoneum. (C) Peritoneal B1-a and T lymphocyte counts. (D) Oxygen consumption rates (OCR) of Gata6flox/flox and Gata6ΔMac mice. (E) Mass spectrometric analysis of metabolites. (F) As shown in Fig. 1 D (blue line in flow cytometry gate), Gata6ΔMac peritoneal macrophages were sorted into two populations based on a retention or reduction of the originally high levels of F4/80, then stained for nuclear Gata6. Bar, 5 µm. Various markers on Gata6flox/flox (light gray histograms) and Gata6ΔMac macrophages with preserved expression of Gata6 (Gata6+, from F4/80high gate; gray histograms) and Gata6ΔMac with efficient deletion of Gata6 (Gata6 from F4/80reduced gate; black histograms) were compared. (G) Analysis of similar markers on spleen or lung macrophages. Data in the figure summarize results from three or more independent experiments with two to five replicates per experimental group. Metabolic analysis was performed using five separate pools of sorted macrophages for each genotype. *, P < 0.05; **, P < 0.001 relative to controls, assessed using two-tailed Student’s t tests.
Figure 3.
Figure 3.
Gata6 regulates aspartylcyclase expression that in turn affects peritoneal macrophage survival. (A) Heat map depicts pattern of expression of mRNA transcripts within modules earlier predicted to be controlled by Gata6. Transcripts within black boxes indicate those that are selectively expressed in peritoneal macrophages relative to other macrophages (Gautier et al., 2012). Arrowhead delineates Aspa. Data are compiled from three independent experiments. (B) Generalized schematic image of metabolic pathways and the expression of various mRNA transcripts in the pathways by Gata6ΔMac peritoneal macrophages. Red color depicts mRNA transcripts significantly up-regulated and blue depicts those significantly down-regulated. (C) Signal intensity of gene expression for Aspa from array data comparing resident macrophages from multiple organs. Dotted line, cutoff representing positive expression after data normalization. (D) Immunoblot for aspartoacylase (ASPA) in control Gata6flox/flox versus Gata6ΔMac mice. Each lane represents a distinct experiment in which pooled macrophages of the depicted genotype were sorted, with acquisition of all ICAM-2+ macrophages sorted from the respective genotypes. Bar on right represents 37-kD molecular weight marker. Real-time quantitative PCR from a single experiment from sorted macrophages pooled from four to seven mice (control vs. Gata6-deficient, respectively) was used; Aspa mRNA transcripts are shown as fold differences between sorted macrophage groups. (E) Macrophage counts in different organs and percent active caspase 3 in control versus Aspa (Nur7) mutant peritoneal macrophages. Far right bar graph shows CD206 MFI in peritoneal macrophages. Two experiments were conducted, with n = 9–10 for peritoneal analyses and n = 4–5 for other organs. *, P < 0.05 relative to control, determined by two-tailed Student’s t tests.

References

    1. Clausen, B.E., Burkhardt C., Reith W., Renkawitz R., and Förster I.. 1999. Conditional gene targeting in macrophages and granulocytes using LysMcre mice. Transgenic Res. 8:265–277 10.1023/A:1008942828960 - DOI - PubMed
    1. Davies, L.C., Jenkins S.J., Allen J.E., and Taylor P.R.. 2013. Tissue-resident macrophages. Nat. Immunol. 14:986–995 10.1038/ni.2705 - DOI - PMC - PubMed
    1. Gause, W.C., Wynn T.A., and Allen J.E.. 2013. Type 2 immunity and wound healing: evolutionary refinement of adaptive immunity by helminths. Nat. Rev. Immunol. 13:607–614 10.1038/nri3476 - DOI - PMC - PubMed
    1. Gautier, E.L., Shay T., Miller J., Greter M., Jakubzick C., Ivanov S., Helft J., Chow A., Elpek K.G., Gordonov S., et al. . Immunological Genome Consortium. 2012. Gene-expression profiles and transcriptional regulatory pathways that underlie the identity and diversity of mouse tissue macrophages. Nat. Immunol. 13:1118–1128 10.1038/ni.2419 - DOI - PMC - PubMed
    1. Gautier, E.L., Ivanov S., Lesnik P., and Randolph G.J.. 2013. Local apoptosis mediates clearance of macrophages from resolving inflammation in mice. Blood. 122:2714–2722 10.1182/blood-2013-01-478206 - DOI - PMC - PubMed

Publication types

Associated data