. 2014 Oct;24(10):1603-12.
doi: 10.1101/gr.170753.113. Epub 2014 Jul 14.

T-cell receptor repertoires share a restricted set of public and abundant CDR3 sequences that are associated with self-related immunity

Affiliations

T-cell receptor repertoires share a restricted set of public and abundant CDR3 sequences that are associated with self-related immunity

Asaf Madi et al. Genome Res. 2014 Oct.

Abstract

The T-cell receptor (TCR) repertoire is formed by random recombinations of genomic precursor elements; the resulting combinatorial diversity renders unlikely extensive TCR sharing between individuals. Here, we studied CDR3β amino acid sequence sharing in a repertoire-wide manner, using high-throughput TCR-seq in 28 healthy mice. We uncovered hundreds of public sequences shared by most mice. Public CDR3 sequences, relative to private sequences, are two orders of magnitude more abundant on average, express restricted V/J segments, and feature high convergent nucleic acid recombination. Functionally, public sequences are enriched for MHC-diverse CDR3 sequences that were previously associated with autoimmune, allograft, and tumor-related reactions, but not with anti-pathogen-related reactions. Public CDR3 sequences are shared between mice of different MHC haplotypes, but are associated with different, MHC-dependent, V genes. Thus, despite their random generation process, TCR repertoires express a degree of uniformity in their post-genomic organization. These results, together with numerical simulations of TCR genomic rearrangements, suggest that biases and convergence in TCR recombination combine with ongoing selection to generate a restricted subset of self-associated, public CDR3 TCR sequences, and invite reexamination of the basic mechanisms of T-cell repertoire formation.


Figures

Figure 1.
Figure 1.
Analysis of the TCRβ repertoire of 28 C57BL/6 mice reveals a highly shared subset of CDR3 aa sequences present at relatively high frequencies. (A) Boxplot presentation of sharing between pairs of mice separated into non-immunized, immunized, and mixed (immunized/non-immunized) pairs; no significant differences are seen between the groups. (B) The number of CDR3 aa sequences found in each sharing category; 2.5 × 10⁵ sequences (∼69%) are private (found in only one mouse); 289 sequences (∼0.08%) are public (found in all 28 mice). (C) Mean frequencies of all CDR3 aa sequences as a function of their sharing level. Each black dot represents the mean frequency of a single aa sequence in all the mice that share this sequence. The red dots show the median value for each sharing category. The colored dots refer to the four sequences shown in Figure 2B. (D) Normalized cumulative frequencies of the sequences from C, in each sharing category. Private CDR3 sequences account for 19% ± 5% of all sequences in each sample; the 289 public sequences account for 10% ± 5% of all sequences in each sample.
Figure 2.
Figure 2.
Convergent recombination continuously increases as a function of sharing. (A) Convergent recombination of all CDR3 sequences as a function of sharing level. Each black dot represents the total number of nt sequences coding for the same CDR3 aa sequence (summed across all mice in which this sequence is found). The red dots show the mean value for each sharing category. The colored dots refer to the four sequences shown in B. (B) The frequencies of nt sequences that encode four selected CDR3 aa sequences: CASSLGGQNTLYF (purple, found in n = 28 mice); CASSLGGNQDTQYF (blue, n = 27); CASSDNANSDYT (orange, n = 7); and CGANRGLDTQYF (green, n = 3). Sequences are marked also in A and in Figure 1C. Each color in the bars of each panel represents a different nt sequence.
Figure 3.
Figure 3.
Public CDR3 sequences differ from private sequences in a number of characteristics. (A) The average length (nt) of private (shared by one to three mice) and public (shared by 26–28 mice) CDR3 sequences. Error bars, SE (P < 8.5 × 10⁻⁸, comparing the mean length of CDR3 nt sequences shared by n = 3 and by n = 26 mice). (B,C) The mean number of nt insertions (B, P < 2.2 × 10⁻¹⁶) and nt deletions (C, no significant difference between groups) summed over the V-D and D-J junctions, in private and public sequences. Error bars, SE. (D) Frequencies of V segments in private (red) and public (blue) sequences. (E) Frequencies of J segments in private (red) and public (blue) sequences. Segments in D and E are ordered by the ratio of their frequencies in private vs. public sequences. Error bars, SD. (All V segments except V7 and all J segments except J1.1 and J1.7 showed significant difference P < 0.05).
Figure 4.
Figure 4.
Annotated CDR3 sequences associated with self-related antigens feature a high level of sharing. (A) Frequencies of 124 annotated TCR sequences that were found in our data set. The frequency of each sequence (rows) in each mouse in our data set (columns) is shown (log10 scale, color bar on the left; gray color: sequence not found). Annotated sequences are grouped into four functional categories, according to the model in which they were detected (see Supplemental Table S2). (B) Sharing distributions of the annotated sequences, according to their functional category. (C,D) Comparison of annotated CDR3 aa sequences of the different functional categories, in terms of mean frequency in the 28 tested mice (C) and mean number of nt insertions in the VD and DJ junctions (D).
Figure 5
Figure 5
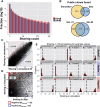
Simulations of the VDJ recombination process provide a measure for the impact of biases on sharing levels. (A) The fraction of CDR3 aa sequences found in each sharing category, in two implementations of simulation of the biased VDJ recombination process (see Methods for details). Both simulation A (red) and simulation B (blue) show a similar trend to that observed in the data (Fig. 1B), where 0.08% and 0.05% of CDR3 sequences are public, respectively. (B) A modest overlap of public CDR3-types is found between simulation and data, with only 91 CDR3 aa sequences found to be public in both (top plot). Higher overlap in public sequences exists between independent iterations of the simulation (bottom). (C) Sharing is well correlated between two independent iterations of simulation A. Only a very small number of CDR3 sequences differ by more than 10 in their sharing level between the two runs of the simulation. (D) A comparison of sharing level between simulation (y-axis) and data (x-axis). Each dot represents one CDR3 aa sequence. (Red region) 6% of the sequences show much lower sharing in the data (formula image). (Blue region) 1.15% of the sequences show much higher sharing in the data (formula image). (E) Measured (vertical dashed line) and simulated (red bars, histograms of 100 random runs of simulation A) sharing levels of four selected CDR3 aa sequences from each region in D. (Top) Neutral, showing similar sharing in simulations and data (purple circles in D, formula image); (middle) positive, showing much higher sharing in data vs. simulation (blue triangles in D, formula image); (bottom) negative (red squares in D, formula image) showing much lower sharing in the data. Two sequences in each row are taken from the annotated group of sequences shown in Figure 4.
Figure 6.
Figure 6.
Differences in MHC restriction are associated with more diverse V gene usage. (A) V segment usage of two public CDR3 aa sequences. Weighted mean frequency of V segment usage for each sequence was calculated for different MHC-restricted T-cell groups: CD4+ T cells from C57BL/6 mice (left, MHC-II, H2b haplotype, n = 28); CD4+ T cells from C3H.SW mice (second left, H2b, n = 3); CD4+ T cells of C3H.HeSnJ mice (second right, H2k, n = 2); and CD8+ T cells from C57BL/6 mice (right, MHC-I, H2b, n = 2). V segments are indicated by the color bar on the right. (B) Average correlations in V segment usage calculated between all 289 public CDR3 aa sequences in our C57BL/6 H2b strain data set and the three other MHC-restricted T-cell groups as in A. Error bars, SEM (see Supplemental Material for details).

References

    1. Argaet VP, Schmidt CW, Burrows SR, Silins SL, Kurilla MG, Doolan DL, Suhrbier A, Moss DJ, Kieff E, Sculley TB, et al. . 1994. Dominant selection of an invariant T cell antigen receptor in response to persistent infection by Epstein-Barr virus. J Exp Med 180: 2335–2340 - PMC - PubMed
    1. Bousso P, Casrouge A, Altman JD, Haury M, Kanellopoulos J, Abastado JP, Kourilsky P. 1998. Individual variations in the murine T cell response to a specific peptide reflect variability in naive repertoires. Immunity 9: 169–178 - PubMed
    1. Burnet FM. 1976. A modification of Jerne’s theory of antibody production using the concept of clonal selection. CA Cancer J Clin 26: 119–121 - PubMed
    1. Casrouge A, Beaudoing E, Dalle S, Pannetier C, Kanellopoulos J, Kourilsky P. 2000. Size estimate of the αβ TCR repertoire of naive mouse splenocytes. J Immunol 164: 5782–5787 - PubMed
    1. Cohen IR. 1992. The cognitive principle challenges clonal selection. Immunol Today 13: 441–444 - PubMed

Publication types

Substances

Associated data