. 2014 Jul 22;111 Suppl 3(Suppl 3):10789-95.
doi: 10.1073/pnas.1400828111. Epub 2014 Jul 14.

Spatial interactions and cooperation can change the speed of evolution of complex phenotypes

Affiliations

Spatial interactions and cooperation can change the speed of evolution of complex phenotypes

Natalia L Komarova. Proc Natl Acad Sci U S A. .

Abstract

Complex traits arise from the interactions among multiple gene products. In the case where the complex phenotype is separated from the wild type by a fitness valley or a fitness plateau, the generation of a complex phenotype may take a very long evolutionary time. Interestingly, the rate of evolution depends in nontrivial ways on various properties of the underlying stochastic process, such as the spatial organization of the population and social interactions among cells. Here we review some of our recent work that investigates these phenomena in asexual populations. The role of spatial constraints is quite complex: there are realistic cases where spatial constrains can accelerate or delay evolution, or even influence it in a nonmonotonic fashion, where evolution works fastest for intermediate-range constraints. Social interactions among cells can be studied in the context of the division-of-labor games. Under a range of circumstances, cooperation among cells can lead to a relatively fast creation of a complex phenotype as an emerging (distributed) property. If we further assume the presence of cheaters, we observe the emergence of a fully mutated population of cells possessing the complex phenotype. Applications of these ideas to cancer initiation and biofilm formation in bacteria are discussed.

Keywords: mutations; stochastic modeling.


Conflict of interest statement

The authors declare no conflict of interest.

Figures

Fig. 1.
Fig. 1.
Examples of fitness landscapes: (A) fitness valley, (B) fitness plateau, and (C) fitness foothills. The horizontal axis shows the number of mutations acquired by a cell, and the vertical axis schematically shows the corresponding fitness values. In this example, m = 5 mutations correspond to the advantageous complex phenotype.
Fig. 2.
Fig. 2.
A schematic of one update of the Moran process. (A) A mass-action process, where the probabilities of divisions and deaths are independent of spatial locations (9, 10). (B and C) Spatial Moran process in 1D (13) and 2D (14). (D) The hierarchical model (12, 15). Filled circles represent stem cells and empty circles, differentiated cells. Following a differentiated cell death, a differentiated cell divides (Left), a stem cell divides asymmetrically (Center), or two differentiated cell death events are balanced by two symmetric divisions of stem cells, one proliferation event and one differentiation event (Right).
Fig. 3.
Fig. 3.
Three dynamical regimes of fitness valley/plateau crossing: (A) nearly deterministic regime, (B) stochastic tunneling, and (C) sequential fixation. Simulations are performed for a mass-action Moran process with m = 4 mutations, a 50 × 50 grid, and neutral intermediate mutants. Wild types are shown in black, intermediate one-hit, two-hit, and three-hit mutants are shown in blue, green, and pink, respectively. The advantageous four-hit mutant is shown in red. The mutation rates are (A) u = 10−2, (B) u = 10−4, and (C) u = 10−5.
Fig. 4.
Fig. 4.
After ref. (6): Spatial configuration of the Moran process for the case of (A) mass-action and (B) nearest-neighbor spatial process. In the presence of spatial structure, islands of intermediate mutants are observed. The chosen parameters were grid size N = 50 × 50, m = 2, intermediate mutants were neutral, u = 10−4.
Fig. 5.
Fig. 5.
Cooperating and cheating phenotypes. (A) A mutation diagram in the absence of cheaters, depicting cooperation between partially mutated cooperators, in the case of m = 2. Wild-type genes are denoted by lowercase letters, and cooperators by uppercase letters. (B) Adding the possibility of cheaters: the cheaters are denoted by uppercase letters with asterisks. The simplest case of m = 1 is presented. (C) For the case m = 2, all of the types are cataloged, and their fitness in the absence and in the presence of cooperation is identified.
Fig. 6.
Fig. 6.
After ref. (7): Distribution of times until the complex phenotype reaches 90% of the total population, based on repeated runs of the computer simulation. (A) Scenario where wild types do not benefit from shared goods. Time until emergence of the m-hit mutant is longest for the sequential evolution scenario. Cooperator–cheater dynamics significantly speed up the emergence of the m-hit mutant. In this case, even before the m-hit mutant arises, the complex phenotype arises as an emerging property among cooperating individuals. (B) Scenario where wild types do benefit from shared goods. In this case, the complex phenotype cannot become dominant as an emergent property among cooperating individuals. Nevertheless, cooperator–cheater dynamics significantly accelerate the emergence of the m-hit mutant compared with the sequential evolution scenario. Parameters were chosen as follows: grid size = 100 × 100; m = 5; R = 0.15; R+ = 0.5; R = 0.135; D = 0.1; f = 1/70; u = 3.17 × 10⁻³; M = 100.
Fig. 7.
Fig. 7.
The mechanism by which cooperation and cheating promote evolution of complex phenotypes, illustrated for the case m = 2. One neighborhood of cooperation is shown. (A) The most abundant types in the quasi-stationary state in the presence of cooperation are (i) full and partial cheaters of fitness R+, (ii) partial cooperators of fitness R+ − f. Full cooperators have a lower fitness of R+ 2f and are not shown. (B) Because cooperators are maintained at relatively low levels determined by the mutation–selection balance, some cooperator mutants occasionally go extinct from the neighborhood of cooperation. Here we show the scenario where product B becomes absent. (C) As a consequence, partial cheaters A*b also plunge. In the alternative scenario where product A stochastically disappears, partial cheaters aB* will plunge (not shown). The only type that survives is the fully mutated cheater, A*B*.
Fig. 8.
Fig. 8.
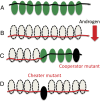
A schematic showing cooperator and cheater resistant mutations that arise in prostate cancers. (A) Cancer cells (green ovals) are proliferating under high androgen levels (black horizontal line). (B) Androgen ablation therapy reduces the androgen level, eliminating cancer cells (cancer cells unable to growth are shown as dashed ovals). (C) A cooperator mutant (black oval) synthesizes androgen locally, enabling the growth of neighboring cells. (D) A cheater mutant (black oval) has a reduced activation threshold for the androgen receptor.

References

    1. Lander ES, Schork NJ. Genetic dissection of complex traits. Science. 1994;265(5181):2037–2048. - PubMed
    1. Ayroles JF, et al. Systems genetics of complex traits in Drosophila melanogaster. Nat Genet. 2009;41(3):299–307. - PMC - PubMed
    1. Serra MC, Haccou P. Dynamics of escape mutants. Theor Popul Biol. 2007;72(1):167–178. - PubMed
    1. Weinreich DM, Chao L. Rapid evolutionary escape by large populations from local fitness peaks is likely in nature. Evolution. 2005;59(6):1175–1182. - PubMed
    1. Weissman DB, Feldman MW, Fisher DS. The rate of fitness-valley crossing in sexual populations. Genetics. 2010;186(4):1389–1410. - PMC - PubMed

Substances