. 2014 Jul 29;111(30):10911-6.
doi: 10.1073/pnas.1410933111. Epub 2014 Jul 14.

Toward performance-diverse small-molecule libraries for cell-based phenotypic screening using multiplexed high-dimensional profiling

Affiliations

Toward performance-diverse small-molecule libraries for cell-based phenotypic screening using multiplexed high-dimensional profiling

Mathias J Wawer et al. Proc Natl Acad Sci U S A. .

Abstract

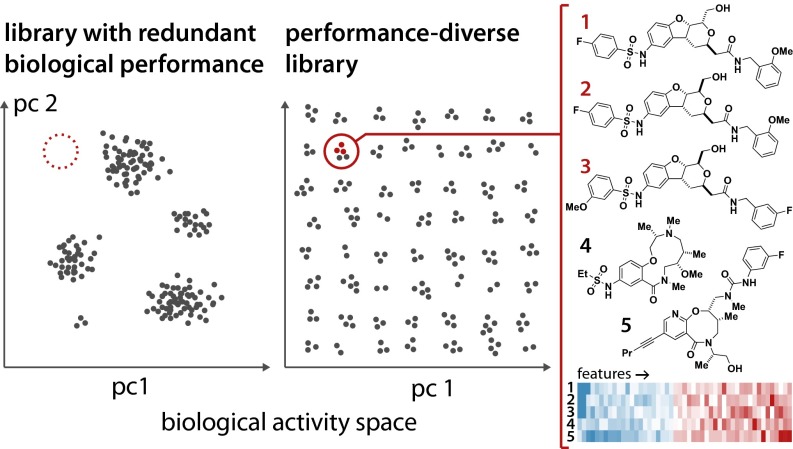
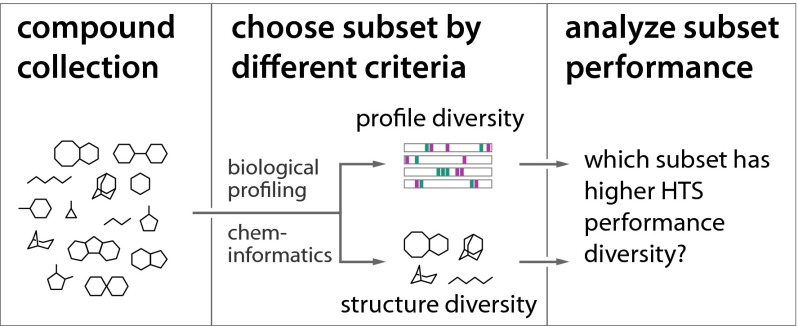
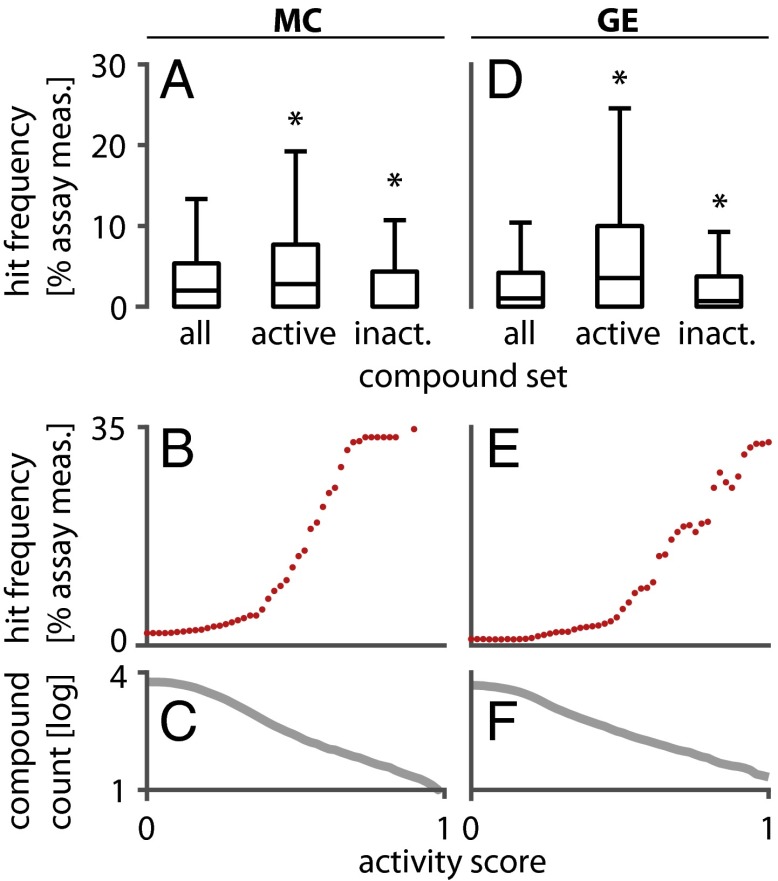
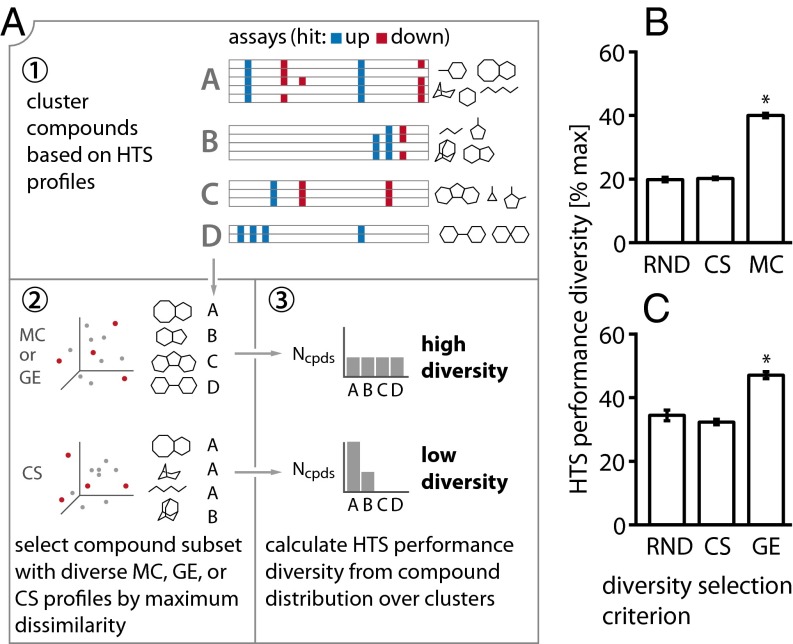
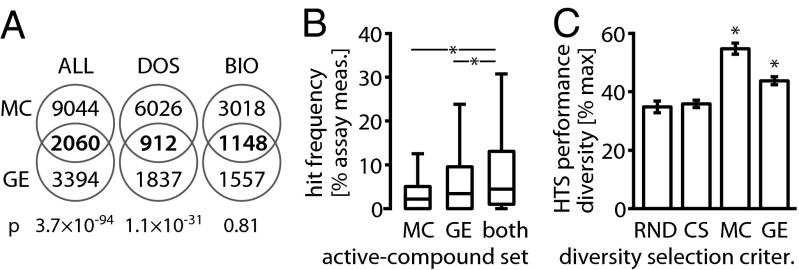
High-throughput screening has become a mainstay of small-molecule probe and early drug discovery. The question of how to build and evolve efficient screening collections systematically for cell-based and biochemical screening is still unresolved. It is often assumed that chemical structure diversity leads to diverse biological performance of a library. Here, we confirm earlier results showing that this inference is not always valid and suggest instead using biological measurement diversity derived from multiplexed profiling in the construction of libraries with diverse assay performance patterns for cell-based screens. Rather than using results from tens or hundreds of completed assays, which is resource intensive and not easily extensible, we use high-dimensional image-based cell morphology and gene expression profiles. We piloted this approach using over 30,000 compounds. We show that small-molecule profiling can be used to select compound sets with high rates of activity and diverse biological performance.

Keywords: biological activity; biological performance diversity; chemical diversity; chemical similarity.


Conflict of interest statement

The authors declare no conflict of interest.

Figures

Fig. 1.
Fig. 1.
A performance-diverse library should cover bioactivity space with uniformly distributed sets of compounds. Shown are schematic distributions of performance-redundant (Left) and performance-diverse (Right) libraries of equal size in a hypothetical 2D projection of a high-dimensional biological activity space (pc: principal component). The diverse library probes a wider bioactivity space with compounds of diverse biological function. For example, the region highlighted in red is unpopulated in the redundant library (Left). In the performance-diverse library (Right), it would be populated by a small group of compounds having similar performance characteristics. To illustrate, the five compounds on the right are a subset of the 19,164 diversity-oriented synthesis-derived compounds (DOS). They represent a cluster of 14 compounds that were found to elicit a gene expression signature not seen among other members of the DOS set or the known bioactive molecules and confirmed screening hits (BIO). The structures of the five compounds illustrate that not all of the members of a subset need to be structurally similar. However, having clear SAR among biologically similar compounds (structures 1–3) can greatly increase confidence in identified hits and allow rapid follow-up studies.
Fig. 2.
Fig. 2.
We compared compound selection criteria based on HTS performance diversity. Starting with a compound collection, we selected diverse subsets by either biological profiling (MC or GE; main text) or chemical structure. We then compared these subsets with respect to their performance diversity across many HTS assays.
Fig. 3.
Fig. 3.
Sets of compounds that are active in MC and GE profiling are enriched for HTS hits. (A) Boxplots showing the distribution of HTS hit frequencies (HF, fraction of HTS assay measurements in which a compound scored as a hit) for compound sets in the MC study. Compared with all tested compounds, the HF is significantly higher for compounds active in the MC assay [median(HFall) = 1.96%; median(HFact) = 2.78%; one-sided Wilcoxon P = 4.5 × 10⁻¹⁷]. Likewise, the HF is significantly lower for compounds inactive in our MC assay [median(HFinact) = 0.00%, P = 1.5 × 10⁻²⁷]. (B and C) Compounds with higher activity in the MC assay have higher HF. HF (B) and compound numbers on a log10 scale (C) are plotted for all compounds that exceed a given activity score (SI Appendix). (D) Boxplots of HFs for compound sets in the GE study. The set of active compounds for the GE assay is enriched for HTS hits [(D) median(HFall) = 0.99%; median(HFact) = 3.52%; P = 2.2 × 10⁻²⁸] whereas the set of inactive compounds is depleted for HTS hits [median(HFinact) = 0.67%, P = 1.0 × 10⁻⁴]. (E and F) Compounds with higher activity in the GE assay have higher hit frequencies.
Fig. 4.
Fig. 4.
Biological profiling can support the selection of performance-diverse compound collections. (A) Conceptual outline of diversity experiment. We first clustered a test collection of compounds based on their HTS profiles (step 1). From the same test collection, we selected compound subsets based on MC (or GE) diversity and CS diversity, using a maximum dissimilarity strategy (step 2). The compounds in each subset were annotated with the HTS clusters determined in step 1. Based on the distribution of compounds over clusters, we then determined for each subset the HTS performance diversity (step 3). A subset with high performance diversity would contain compounds that are equally spread over many clusters. A subset with low diversity would contain a large fraction of compounds that fall into only a few HTS clusters. (B and C) Results for the subset size that achieved the highest HTS performance diversity across all selection methods, using a random compound selection (RND) as baseline (results on all subset sizes in SI Appendix, Fig. S2). Asterisks indicate significant diversity increases over RND. (B) Results for the MC study (test-collection size, n = 7,154 compounds; subset size, nsub = 1,399). Selecting compounds with diverse MC profiles led to significantly higher HTS performance diversity than random selection (Wilcoxon rank-sum P = 2.9 × 10−165). (C) Results for the GE study (n = 1,363; nsub = 463). GE diversity selection led to higher HTS performance diversity than random selection (P = 2.9 × 10−165). For both the MC and the GE test collection, selection based on chemical structure diversity did not notably increase HTS performance diversity over the random control.
Fig. 5.
Fig. 5.
MC and GE profiling have overlapping yet distinct hit sets. (A) Venn diagrams of the MC and GE hit sets. Although the majority of compounds are identified by only one of the methods, low P values (Fisher’s exact test) indicate a nonrandom overlap between two hit sets. Both MC and GE identify a large fraction of the BIO collection as hits; thus even high overlap is not significant (SI Appendix, Table S5). (B) Boxplots of HTS hit frequencies (HF, defined in Fig. 3) for active compounds tested in both the MC and the GE study. MC, hits identified based on cell-morphology profiles; GE, hits identified based on gene expression profiles; both, hits identified by both MC and GE. The intersection of the sets of active compounds from the MC and GE assay shows even stronger enrichment for compounds with high HF [median(HFboth) = 4.41%] than either set of actives alone [median(HFMC) = 2.14%; one-sided Wilcoxon PMC = 1.4 × 10⁻¹⁴; median(HFGE) = 3.39%; PGE = 1.9 × 10⁻³]. This indicates that the MC and GE assays tend to agree on compounds that are active in multiple HTS assays and possibly even promiscuous (SI Appendix, Table S6). Asterisks indicate significant HF increases. (C) When direct comparison was made on the intersection of the MC and GE test collections (n = 904), we observed higher HTS performance diversity than random selection for selection based on both MC (Wilcoxon P = 2.9 × 10−165) and GE profiles (P = 7.1 × 10−165) when selecting about a third of the test collection (nsub = 320). Asterisks indicate a significant diversity increase over RND.

References

    1. Bai RL, et al. Halichondrin B and homohalichondrin B, marine natural products binding in the vinca domain of tubulin. Discovery of tubulin-based mechanism of action by analysis of differential cytotoxicity data. J Biol Chem. 1991;266(24):15882–15889. - PubMed
    1. Paull KD, Lin CM, Malspeis L, Hamel E. Identification of novel antimitotic agents acting at the tubulin level by computer-assisted evaluation of differential cytotoxicity data. Cancer Res. 1992;52(14):3892–3900. - PubMed
    1. Hughes TR, et al. Functional discovery via a compendium of expression profiles. Cell. 2000;102(1):109–126. - PubMed
    1. Lamb J, et al. The Connectivity Map: Using gene-expression signatures to connect small molecules, genes, and disease. Science. 2006;313(5795):1929–1935. - PubMed
    1. Feng Y, Mitchison TJ, Bender A, Young DW, Tallarico JA. Multi-parameter phenotypic profiling: Using cellular effects to characterize small-molecule compounds. Nat Rev Drug Discov. 2009;8(7):567–578. - PubMed

Publication types

MeSH terms