. 2014 Jul 29;111(30):E3091-100.
doi: 10.1073/pnas.1411679111. Epub 2014 Jul 14.

Stromal response to Hedgehog signaling restrains pancreatic cancer progression

Affiliations

Stromal response to Hedgehog signaling restrains pancreatic cancer progression

John J Lee et al. Proc Natl Acad Sci U S A. .

Abstract

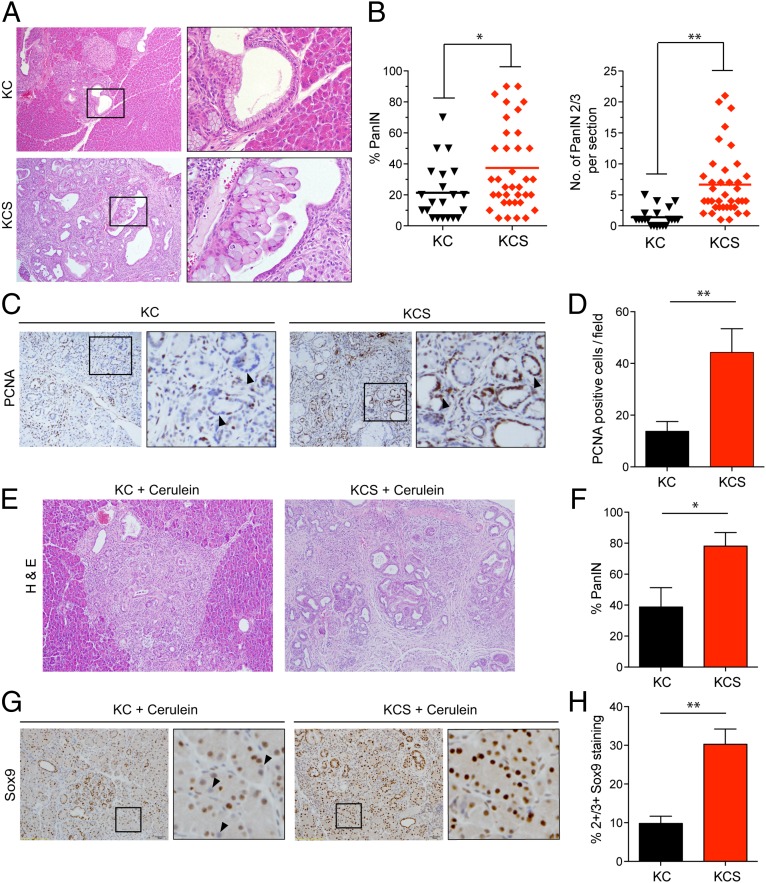
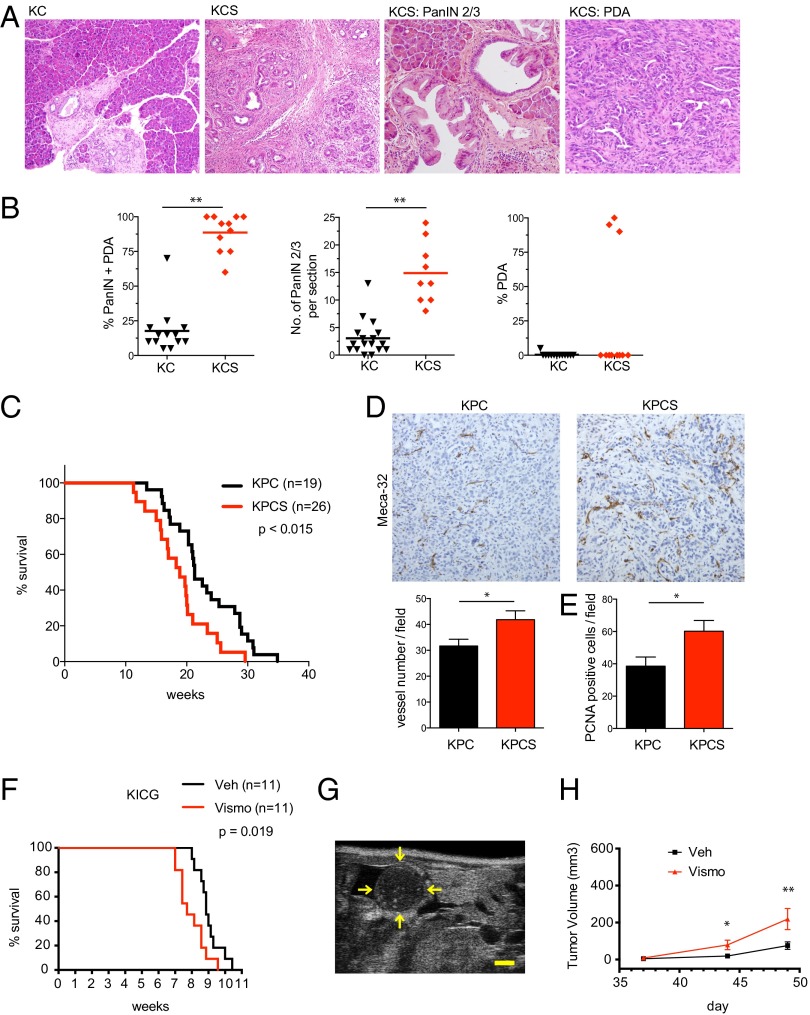
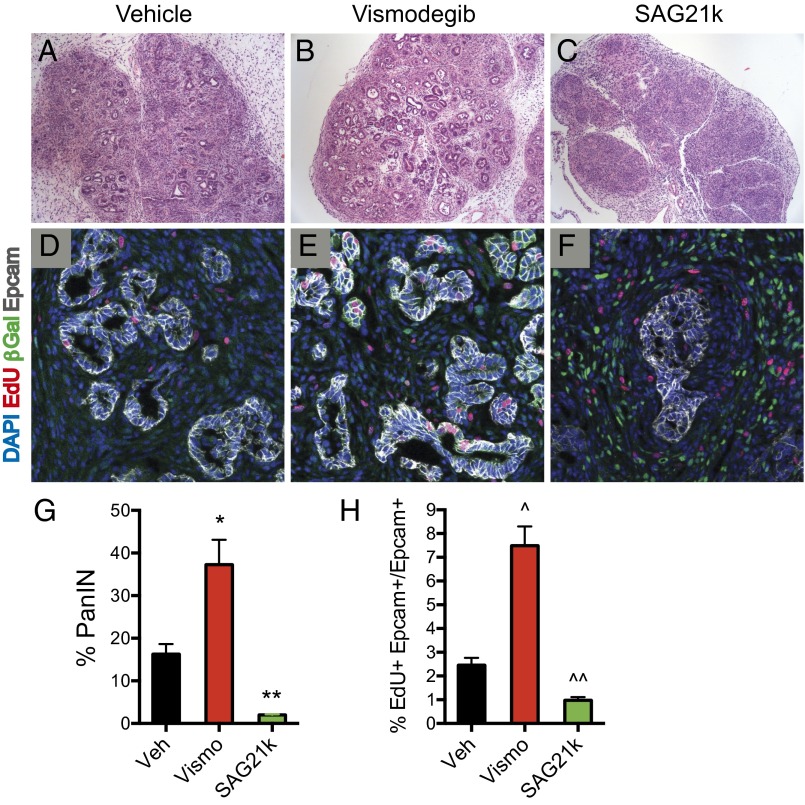
Pancreatic ductal adenocarcinoma (PDA) is the most lethal of common human malignancies, with no truly effective therapies for advanced disease. Preclinical studies have suggested a therapeutic benefit of targeting the Hedgehog (Hh) signaling pathway, which is activated throughout the course of PDA progression by expression of Hh ligands in the neoplastic epithelium and paracrine response in the stromal fibroblasts. Clinical trials to test this possibility, however, have yielded disappointing results. To further investigate the role of Hh signaling in the formation of PDA and its precursor lesion, pancreatic intraepithelial neoplasia (PanIN), we examined the effects of genetic or pharmacologic inhibition of Hh pathway activity in three distinct genetically engineered mouse models and found that Hh pathway inhibition accelerates rather than delays progression of oncogenic Kras-driven disease. Notably, pharmacologic inhibition of Hh pathway activity affected the balance between epithelial and stromal elements, suppressing stromal desmoplasia but also causing accelerated growth of the PanIN epithelium. In striking contrast, pathway activation using a small molecule agonist caused stromal hyperplasia and reduced epithelial proliferation. These results indicate that stromal response to Hh signaling is protective against PDA and that pharmacologic activation of pathway response can slow tumorigenesis. Our results provide evidence for a restraining role of stroma in PDA progression, suggesting an explanation for the failure of Hh inhibitors in clinical trials and pointing to the possibility of a novel type of therapeutic intervention.

Keywords: Sonic hedgehog; cancer therapy; cerulein; hedgehog agonist; tumor stroma.


Conflict of interest statement

The authors declare no conflict of interest.

Figures

Fig. 1.
Fig. 1.
Accelerated PanIN formation following Shh loss. (A–D) Analysis of pancreata from KC and KCS mice euthanized at 6 mo of age. (A) Representative histologic images. The boxed regions show PanIN-1A lesions in a KC mouse (Upper) and PanIN-2 in a KCS mouse (Lower). (B) Quantification of percentage of pancreas occupied by PanIN (Left), and number of high-grade PanIN-2/3 lesions per section (Right); *P < 0.02; **P < 0.001. The line indicates the mean value. (C) Immunohistochemistry for PCNA. Boxed regions are magnified at Right. Arrowheads indicate negatively and positively stained nuclei of ductal epithelial cells from KC mice (Left) and KCS mice (Right), respectively. (D) The number of PCNA-positive cells per field (n = 10), from a total of five mice per group was quantified; *P < 0.01. Error bars indicate SEM. (E–H) Eight-week-old KC (n = 4) and KCS (n = 8) mice were treated with cerulein (six hourly injections per day for two consecutive days), and pancreata were collected 1 mo later. (E) Representative histology. (F) Quantification of percentage of PanIN; *P < 0.03. (G) Immunohistochemistry for Sox9 (boxed region magnified at Right; arrowheads indicate negatively stained nuclei in a KC mouse pancreas). (H) Quantification of Sox9 staining (four mice per group, 10 high-power fields (hpfs) per pancreas). The percentage of nuclei scoring as 2+/3+ in staining intensity is plotted. Error bars indicate SEM; **P < 0.001.
Fig. 2.
Fig. 2.
Loss of Hh response promotes PDA development. (A and B) KC and KCS mice were euthanized at age 55 wk. (A) Representative histology of pancreata. (B) Quantification of percentage of PanIN and PDA (Left), number of high-grade PanIN2/3 (Center), and percentage of PDA (Right) in aged KC (n = 13) and KCS (n = 11) mice. The line indicates the mean value. **P < 0.001. (C–E) KPC and KPCS mice were euthanized upon signs of illness (Materials and Methods). (C) Kaplan–Meier analysis showing time to euthanization. All animals had verified PDA. (D) Immunohistochemistry for Meca32; chart (Lower) shows quantification of staining from 10 hpf from five pancreata per group; *P < 0.035. Error bars indicate SEM. (E) Immunohistochemistry for PCNA reveals increased proliferation in KPCS pancreata compared with KPC control mice; *P < 0.03. Error bars indicate SEM. (F) Kaplan–Meier analysis demonstrates that vismodegib treatment (red) starting on day 35 decreases survival in KICG mice compared with vehicle (black). (G) Transverse B-mode ultrasound image of a representative 2.5-mm pancreatic cancer focus in the body/tail region of the pancreas. The yellow arrows denote outline of the tumor surface. (Scale bar: 1 mm.) (H) Vismodegib treatment starting on day 35 accelerates growth of tumors as measured by ultrasound imaging. Total volumes of tumors detected per mouse in each treatment group are shown. A significant difference in median tumor size was measured on day 44 (*P = 0.029; n = 16 per group) and was further increased by day 49 (**P = 0.027; n = 12). There was no significant difference on day 37 (P = 0.296; n = 16 per group). Error bars indicate SEM.
Fig. 3.
Fig. 3.
Hh response augments the number of Gli1-expressing stromal cells in cerulein-enhanced oncogenesis. (A) Schema for cerulein studies. Four-week-old ICG or KICG were given six hourly doses of cerulein on days 0 and 1. On days 0 through day 8 mice were given either vehicle, vismodegib, or SAG21k. Pancreata were harvested on day 8, 4 h after the last dose of Hh pathway modulating agent. (B–D and H) ICG mice do not form PanIN lesions in the setting of cerulein-induced pancreatitis. In these animals, vismodegib does not alter significantly the number of Gli1+ cells. However, SAG21k increases the amount of Gli1+ cells by 180-fold (*P < 0.0001, n = 6). Error bars indicate SEM. (E–G and I) In contrast, PanIN lesions are induced in KICG mice, associated with an 81-fold increase in Gli1+ cells observed in vehicle-treated KICG mice compared with vehicle-treated ICG controls (**P = 0.0001, n = 6). Vismodegib resulted in a nonsignificant decrease in Gli1+ cells in KICG mice (Vismo vs. Veh in I, ***P = 0.063, n = 6) whereas SAG21k resulted in a prominent increase (SAG21k vs. Veh in I, ****P < 0.0001, n = 6). Error bars indicate SEM.
Fig. 4.
Fig. 4.
Hh response regulates stromal composition during cerulein-enhanced oncogenesis. (A–I) Confocal images of pancreata of cerulein-treated KICG mice are shown. (A and B) Vismodegib decreased the expression of αSMA, an established marker for desmoplasia in PDA. (C) Conversely, SAG21k increased αSMA expression. (D–F) Expression of Col I, another marker for desmoplasia, was decreased by vismodegib and increased by SAG21k. (G and H) Pancreata from vehicle- and vismodegib-treated mice exhibit cells expressing CD45, suggestive of hematopoietic origin, dispersed in stromal areas between PanIN lesions. (I) In contrast, CD45+ cells are concentrated around globular PanIN structures in SAG21k-treated mice. In all drug-treatment conditions shown, there is no overlap between Gli1+ and CD45+ cells.
Fig. 5.
Fig. 5.
Hh response suppresses PanIN formation and proliferation. (A–C and G) H&E sections of pancreata from KICG mice given cerulein show PanIN lesions. Vismodegib-treated mice showed 37% of the pancreas occupied by PanIN lesions compared with 16% for vehicle-treated controls (*P = 0.016, n = 4 each). In contrast, SAG21k-treated mice showed only 2% of the pancreas occupied by PanIN lesions along with increased overall fibrosis (**P = 0.001, vehicle vs. SAG21k, n = 4). Error bars indicate SEM. (D–F and H) Representative confocal images of PanIN lesions in pancreata of KICG mice are shown. Vismodegib increases the percentage of proliferating PanIN cells (EdU+ Epcam+/Epcam+) to 7.5% compared with 2.5% for vehicle treatment (^P = 0.0004, n = 5 each). Conversely, SAG21k reduces proliferation percentage to 1.0% (^^P = 0.002, n = 5). Error bars indicate SEM.
Fig. 6.
Fig. 6.
Hh response suppresses expression of the pancreatic progenitor marker Pdx1 in PanIN lesions. (A–C) Confocal images of pancreata from KICG mice show nuclear expression of the ductal epithelial marker Sox9 in all PanIN cells. Vismodegib or SAG21k does not alter expression in PanIN lesions. (D–G) In contrast, nuclear Pdx1 expression is observed in a fraction of total PanIN cells in vehicle- and vismodegib-treated mice (n = 6 each), 7.0% and 8.5%, respectively. White arrows display Pdx1 expression. Furthermore, SAG21k dramatically reduces Pdx1 expression to 0.2% of PanIN cells (Vehicle vs. SAG21k, *P = 0.008, n = 6 each). Error bars indicate SEM.

References

    1. Howlader N, et al. SEER Cancer Statistics Review, 1975-2010. Rockville, MD: National Cancer Institute; 2013.
    1. Anonymous StatBite. U.S. pancreatic cancer rates. J Natl Cancer Inst. 2010;102(24):1822. - PubMed
    1. Conroy T, et al. Groupe Tumeurs Digestives of Unicancer PRODIGE Intergroup FOLFIRINOX versus gemcitabine for metastatic pancreatic cancer. N Engl J Med. 2011;364(19):1817–1825. - PubMed
    1. Von Hoff DD, et al. Increased survival in pancreatic cancer with nab-paclitaxel plus gemcitabine. N Engl J Med. 2013;369(18):1691–1703. - PMC - PubMed
    1. Hebrok M, Kim SK, Melton DA. Notochord repression of endodermal Sonic hedgehog permits pancreas development. Genes Dev. 1998;12(11):1705–1713. - PMC - PubMed

Publication types

MeSH terms

Substances