. 2014 Sep;3(9):1055-65.
doi: 10.5966/sctm.2013-0214. Epub 2014 Jul 14.

Targeting cancer stem cell plasticity through modulation of epidermal growth factor and insulin-like growth factor receptor signaling in head and neck squamous cell cancer

Affiliations

Targeting cancer stem cell plasticity through modulation of epidermal growth factor and insulin-like growth factor receptor signaling in head and neck squamous cell cancer

Hui Sun Leong et al. Stem Cells Transl Med. 2014 Sep.

Abstract

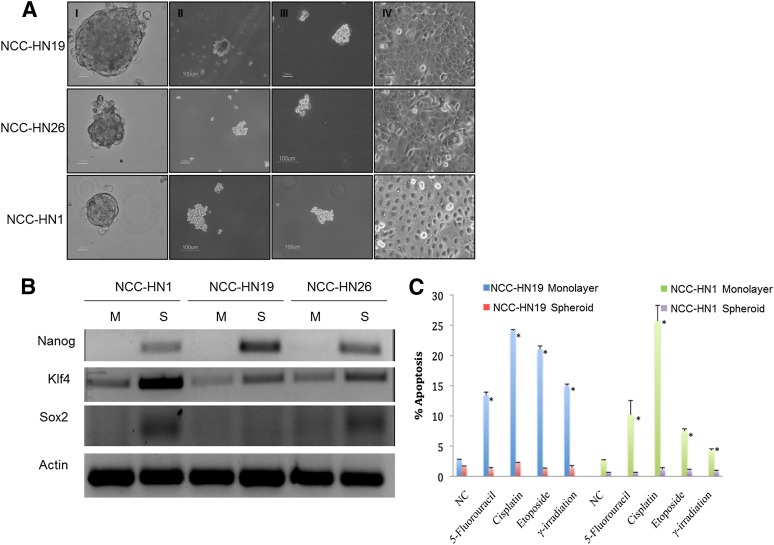
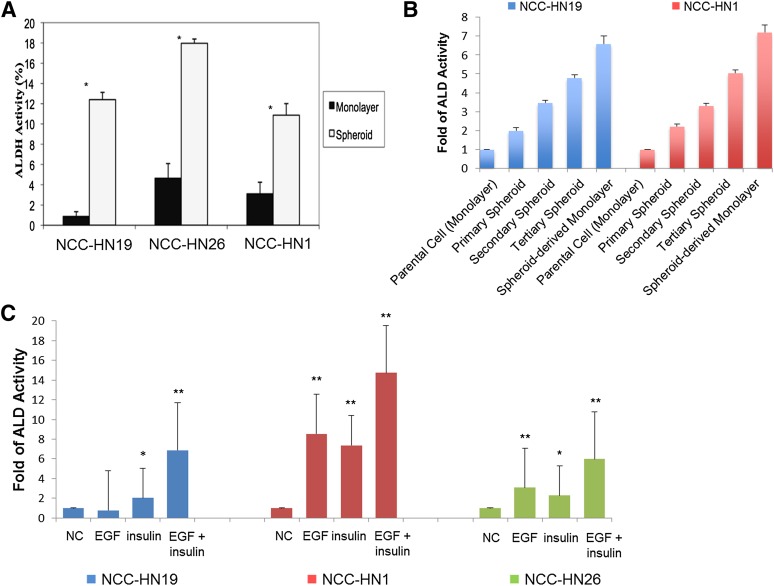
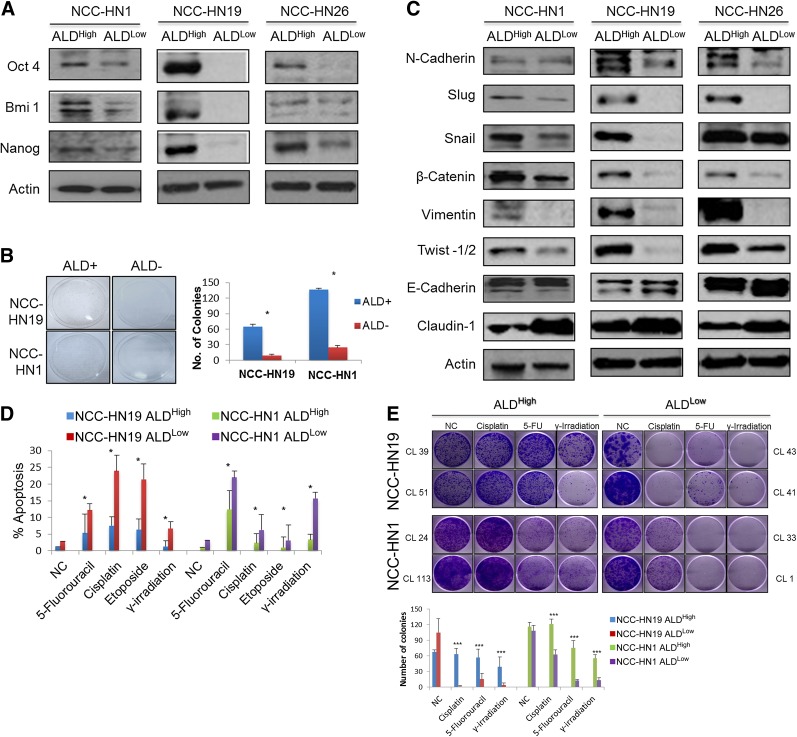
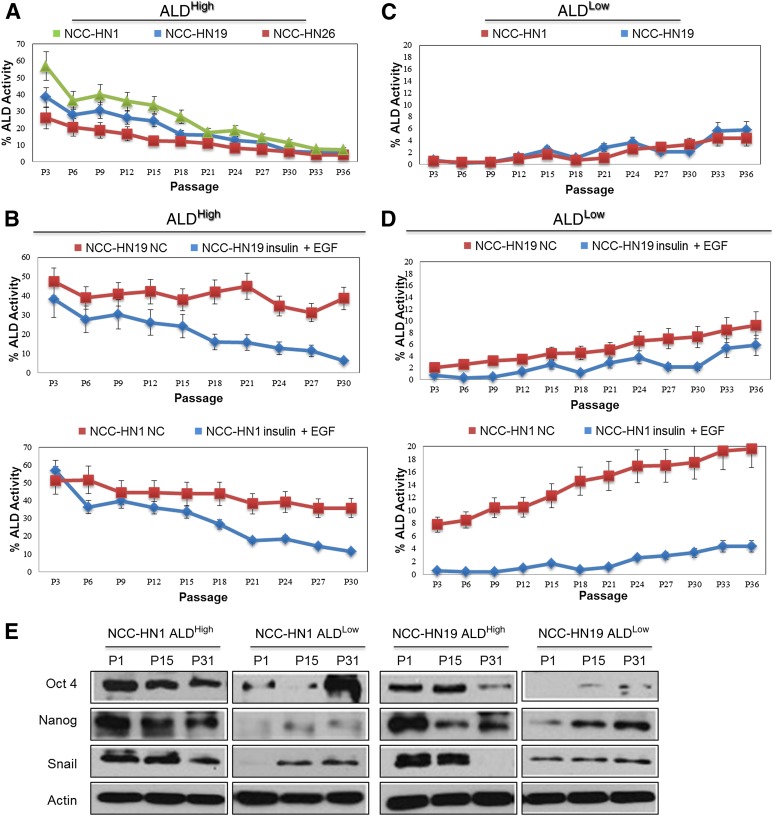
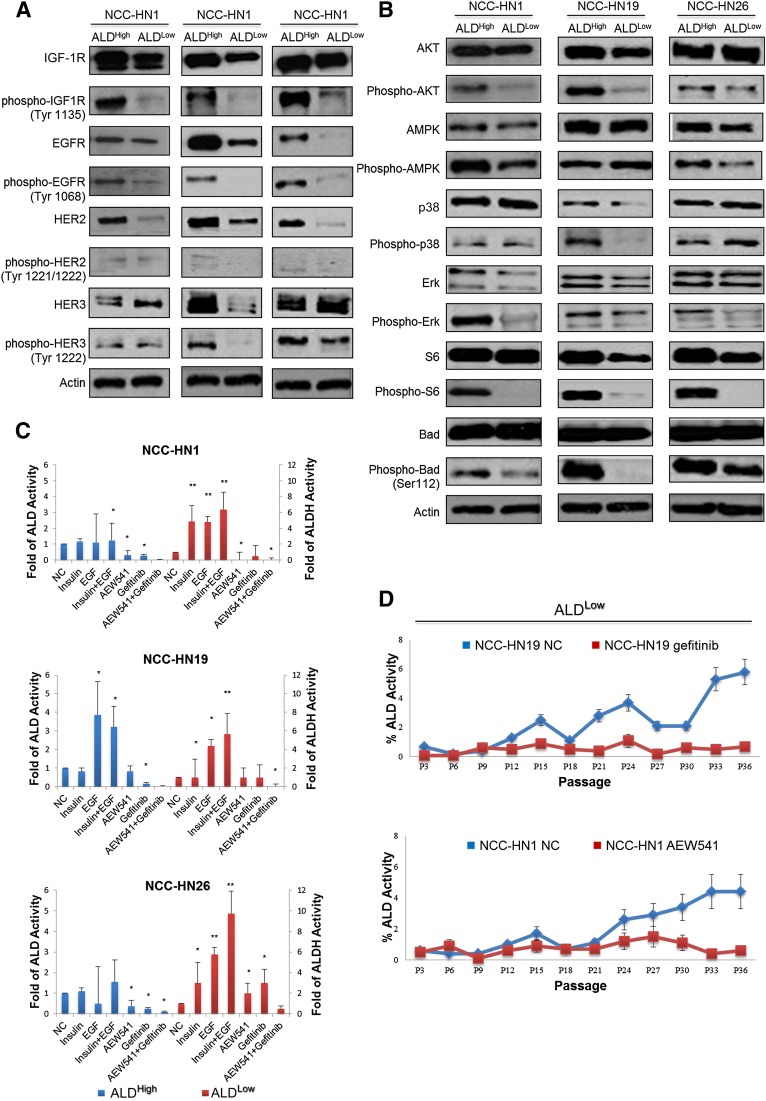
Emerging data suggest that cancer stem cells (CSCs) exist in equilibrium with differentiated cells and that stochastic transitions between these states can account for tumor heterogeneity and drug resistance. The aim of this study was to establish an in vitro system that recapitulates stem cell plasticity in head and neck squamous cell cancers (HNSCCs) and identify the factors that play a role in the maintenance and repopulation of CSCs. Tumor spheres were established using patient-derived cell lines via anchorage-independent cell culture techniques. These tumor spheres were found to have higher aldehyde dehydrogenase (ALD) cell fractions and increased expression of Kruppel-like factor 4, SRY (sex determining region Y)-box 2, and Nanog and were resistant to γ-radiation, 5-fluorouracil, cisplatin, and etoposide treatment compared with monolayer culture cells. Monolayer cultures were subject to single cell cloning to generate clones with high and low ALD fractions. ALDHigh clones showed higher expression of stem cell and epithelial-mesenchymal transition markers compared with ALDLow clones. ALD fractions, representing stem cell fractions, fluctuated with serial passaging, equilibrating at a level specific to each cell line, and could be augmented by the addition of epidermal growth factor (EGF) and/or insulin. ALDHigh clones showed increased EGF receptor (EGFR) and insulin-like growth factor-1 receptor (IGF-1R) phosphorylation, with increased activation of downstream pathways compared with ALDLow clones. Importantly, blocking these pathways using specific inhibitors against EGFR and IGF-1R reduced stem cell fractions drastically. Taken together, these results show that HNSCC CSCs exhibit plasticity, with the maintenance of the stem cell fraction dependent on the EGFR and IGF-1R pathways and potentially amenable to targeted therapeutics.

Keywords: Aldehyde dehydrogenase; Cancer stem cell; Epidermal growth factor receptor; Head and neck squamous cell cancer; Insulin-like growth factor-1 receptor.


Figures

Figure 1.
Figure 1.
Tumor spheres generated from HNSCC cells demonstrated CSC properties. (A): Phase-contrast microscopy images of HNSCC primary cell lines are shown. Panels I–III show first, second, and third generation sphere cultures formed after re-plating as described. Panel IV shows adherent cells grown as monolayer cultures after re-plating from tertiary sphere culture. Scale bar represents 100 μm. (B): RT-PCR shows increased expression of stem cell markers Nanog, Klf4, and Sox2 in tumor spheres compared to monolayer cultures. (C): Graph showing percentage apoptosis after treatment with 5-fluorouracil (3 μM for NCC-HN19, 0.1 μM for NCC-HN1), cisplatin (3.5 μM for NCC-HN19, 3.0 μM for NCC-HN1), etoposide (2 μM for NCC-HN19, 6 μM for NCC-HN1), or γ-irradiation (2 Gy for NCC-HN19, 4 Gy for NCC-HN1). These show that tumor spheres are more resistant compared to monolayer cultures All drug and irradiation treatments were run in three independent experiments, and standard deviation is indicated (∗, p < .05). Abbreviations: M, monolayer; NC, negative control (untreated); S, spheroid.
Figure 2.
Figure 2.
ALD-positive (ALD+) cells were concentrated in HNSCC tumor spheres and after treatment with growth factors. (A): Graph showing percentage of ALD+ cells in monolayer and tumor sphere cultures. Error bars indicate one standard deviation obtained from three independent experiments (∗, p < .05). (B): Graph showing percentage of ALD+ cells in serial passages of first, second, and third generation tumor spheres, and subsequent monolayer culture of third generation spheroids, showing progressive concentration of the CSC population. (C): Graph showing percentage of ALD+ cells in monolayer cultures after addition of EGF and/or insulin, with increased levels of ALD+ cells after growth factor addition. ALD levels were normalized to untreated controls and standard deviation is indicated (∗, p < .05, ∗∗, p < .01, ∗∗∗, p < .001). Abbreviations: ALD/ALDH, aldehyde dehydrogenase; EGF, epidermal growth factor; NC, negative control (untreated).
Figure 3.
Figure 3.
ALD+ cells have characteristicsof CSCs, show features of epithelial-mesenchymal transition and are resistant to cytoxic therapy. (A): Western blots showing that ALDHigh cells have higher expression of stem cell markers Oct4, Bmi1, Nanog, compared to ALDLow cells with actin loading control. (B): Plating assays and graph showing number of surviving colonies showing that ALDHigh cells demonstrated higher clonogenic capacity compared to ALDLow cells. In this experiment, ALDHigh and ALDLow cells were isolated by FACS sorting, plated at equal density and cultured for 21 days. Surviving cells were stained with crystal violet (∗, p < .05). (C): Western blots of E-M-T markers showing that ALDHigh cells show features of E-M-T compared to ALDLow cells. ALDHigh cells expressed more mesenchymal markers, N-Cadherin, Slug, Snail, b-Catenin, Vimentin, and Twist-½; whereas ALDLow cells expressed more of epithelial markers, E-Cadherin and Claudin-1. (D): Graph showing percentage apoptosis after treatment with various cytotoxic treatments. These show that ALDHigh clones are more resistant compared to ALDLow clones. All drug and irradiation treatments were run at IC50 dose of their respective parental cell lines, and standard deviation from three independent experiments is indicated (∗, p < .05). (E): Plating assays and graph showing number of surviving colonies showing that ALDHigh cells are significantly more resistant to various cytotic drugs and γ-irradiation as compared to ALDLow cells. In this experiment, ALDHigh and ALDLow cells were plated at equal density, treated at IC50 dose of their respective parental cell lines for 48 hours and cultured for 21 days. Surviving cells were stained with crystal violet and number of colonies were calculated, standard deviation from three independent experiments is indicated (∗∗∗, p < .0001). Western blots were performed on clones with the most extreme ALD fractions, so for ALDHigh cells NCC-HN1 Clone 24, NCC-HN19 Clone 39 and NCC-HN26 Clone 79 were used while for ALDLow cells NCC-HN1 Clone 33, NCC-HN19 Clone 43 and NCC-HN26 Clone 56 were used. For drug assays, two clones per cell line were used as indicated, and each cell line experiment was performed in triplicate, with data showing the average and standard deviation of these. Abbreviations: ALD, aldehyde dehydrogenase; ALDHigh, clones with high ALD+ fraction; ALDLow, clones with low ALD+ fraction; NC, negative control (untreated).
Figure 4.
Figure 4.
ALD+ cellular fractions demonstrate phenotypic plasticity and are dependent on IGF1R and EGFR pathways. Graph showing ALD+ fractions where: (A): ALDHigh cells were passaged in normal media. ALD+ fractions reduced gradually over time in culture, and reached baseline ALD+ level, NCC-HN19 (5.5%±SD 0.15), NCC-HN26 (4.1%±SD 0.06) and NCC-HN1 (7.3%±SD 0.06), after 30-36 passages. (B): ALDHigh cells from NCC-HN19 (top) and NCC-HN1 (bottom) were passaged in high EGF and IGF-containing media. ALD+ fractions were maintained at higher levels as compared to untreated cultures. (C): ALDLow cells were passaged in normal media. ALD+ fractions increased gradually over time and reached baseline levels: NCC-HN19 (5.8%±SD 0.20) and NCC-HN1 (4.4%±SD 0.06), after 30-36 passages. (D): ALDLow cells from NCC-HN19 (top) and NCC-HN1 (bottom) were passaged in high EGF and IGF-containing media. ALD+ fractions were maintained at higher levels as compared to untreated cultures. (E): Western blots showing variation in stem cell markers (Oct4, Nanog) and EMT marker (Snail) with ALD+ fractions during passaging of ALDHigh and ALDLow clones, where the level of these markers correlate with ALD+ levels. ALD+ fractions were determined every three passages by flow cytometry. All experiments were performed in triplicates on the following clones: ALDHigh cells: NCC-HN1 Clone 24, NCC-HN19 Clone 39, and NCC-HN26 Clone 79 and ALDLow cells NCC-HN1 Clone 33, NCC-HN19 Clone 43, and NCC-HN26 Clone 56 were used. Average values were shown with standard deviation from three independent experiments as indicated. Note that the scale used in each graph differ to demonstrate the impact in greater detail. Western blots were also performed on the same clones as those used for the serial passaging. Abbreviations: ALD, aldehyde dehydrogenase; ALDHigh, clones with high ALD+ fraction; ALDLow, clones with low ALD+ fraction; EGF, epidermal growth factor; P, passage.
Figure 5.
Figure 5.
IGF and/or EGF addiction underlies the maintenance of ALD+ cellular fractions. Western blots showing activation of EGF-R, IGF-1R, HER2, HER3 (with actin loading control) (A) and downstream signal transduction pathway in ALDHigh cells, particularly PI3K/AKT and ERK signaling (with actin loading control) (B). (C): Graph showing ALD+ fractions in ALDHigh cells treated with Gefitinib and/or AEW541, ALDLow cells after addition of EGF, FGF, and insulin. These demonstrate a significant reduction in ALD+ fractions in ALDHigh after addition of the drugs and increasing levels of ALD+ cells in ALDLow after addition of growth factors, respectively. ALDEFLUOR assays were performed 3 days after treatment and the ALDH levels were normalized to untreated controls and standard deviation is indicated (∗, p < .05, ∗∗, p < .01). (D): Graph showing ALD+ fractions where ALDLow cells were cultured with media containing Gefitinib or AEW541. ALD+ fractions did not increase to baseline levels when maintained in drug enriched media, compared to untreated controls. ALD+ fractions were determined every 3 passages by flow cytometry, and all experiments were performed in triplicates and average values were shown. Western blots were performed on clones with the most extreme ALD fractions, so for ALDHigh cells NCC-HN1 Clone 24, NCC-HN19 Clone 39, and NCC-HN26 Clone 79 were used while for ALDLow cells NCC-HN1 Clone 33, NCC-HN19 Clone 43, and NCC-HN26 Clone 56 were used. For drug assays, two clones per cell line were used as indicated, and each cell line experiment was performed in triplicate, with data showing the average and standard deviation of these. Abbreviations: ALD/ALDH, aldehyde dehydrogenase; ALDHigh, clones with high ALD+ fraction; ALDLow, clones with low ALD+ fraction; EGF, epidermal growth factor; EGFR, epidermal growth factor receptor; NC, negative control (untreated).

References

    1. Hammerman PS, Jänne PA, Johnson BE. Resistance to epidermal growth factor receptor tyrosine kinase inhibitors in non-small cell lung cancer. Clin Cancer Res. 2009;15:7502–7509. - PubMed
    1. Ferlay J, Shin H, Bray F, et al. Estimates of worldwide burden of cancer in 2008: GLOBOCAN 2008. Int J Cancer. 2010;127:2893–2917. - PubMed
    1. Vermorken JB, Specenier P. Optimal treatment for recurrent/metastatic head and neck cancer. Ann Oncol. 2010;21(suppl 7):vii252–vii261. - PubMed
    1. Medema JP. Cancer stem cells: the challenges ahead. Nat Cell Biol. 2013;15:338–344. - PubMed
    1. Wicha MS, Liu S, Dontu G. Cancer stem cells: An old idea—A paradigm shift. Cancer Res. 2006;66:1883–1890. - PubMed

Publication types

MeSH terms