. 2014 Jul 14:5:4324.
doi: 10.1038/ncomms5324.

3D niche microarrays for systems-level analyses of cell fate

Affiliations

3D niche microarrays for systems-level analyses of cell fate

A Ranga et al. Nat Commun. .

Abstract

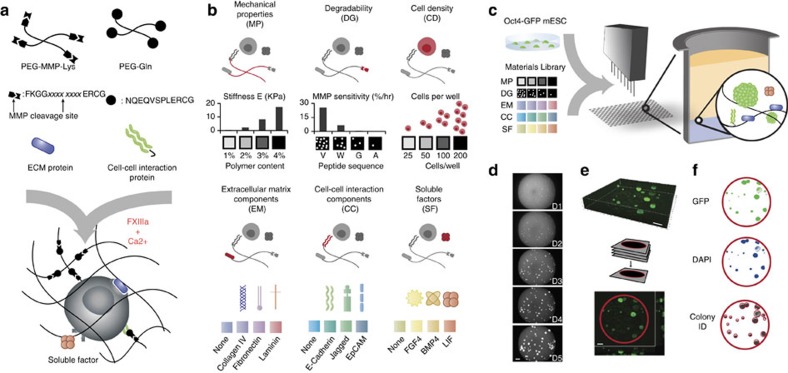
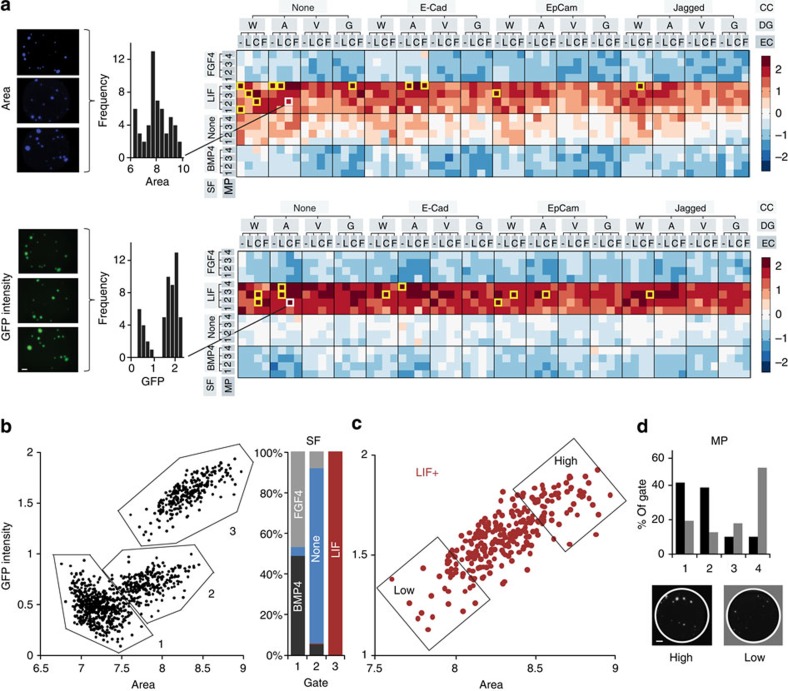
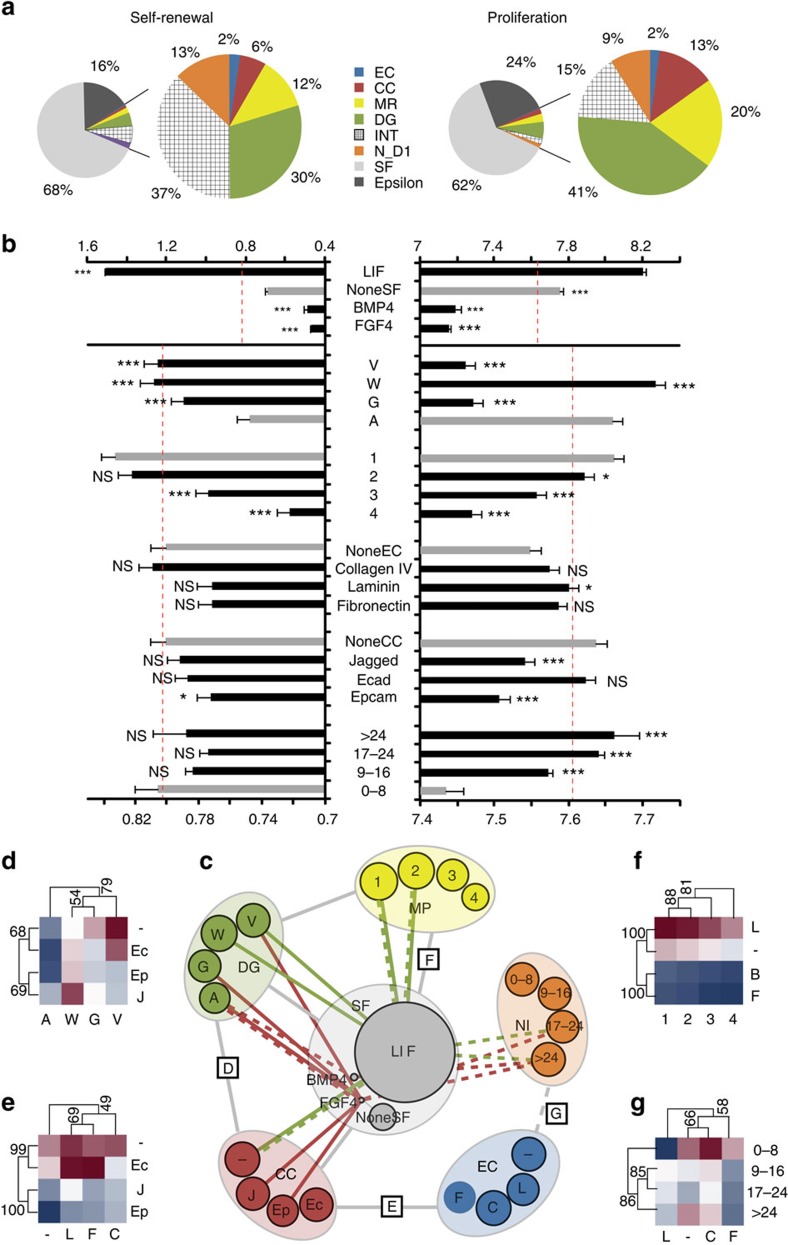
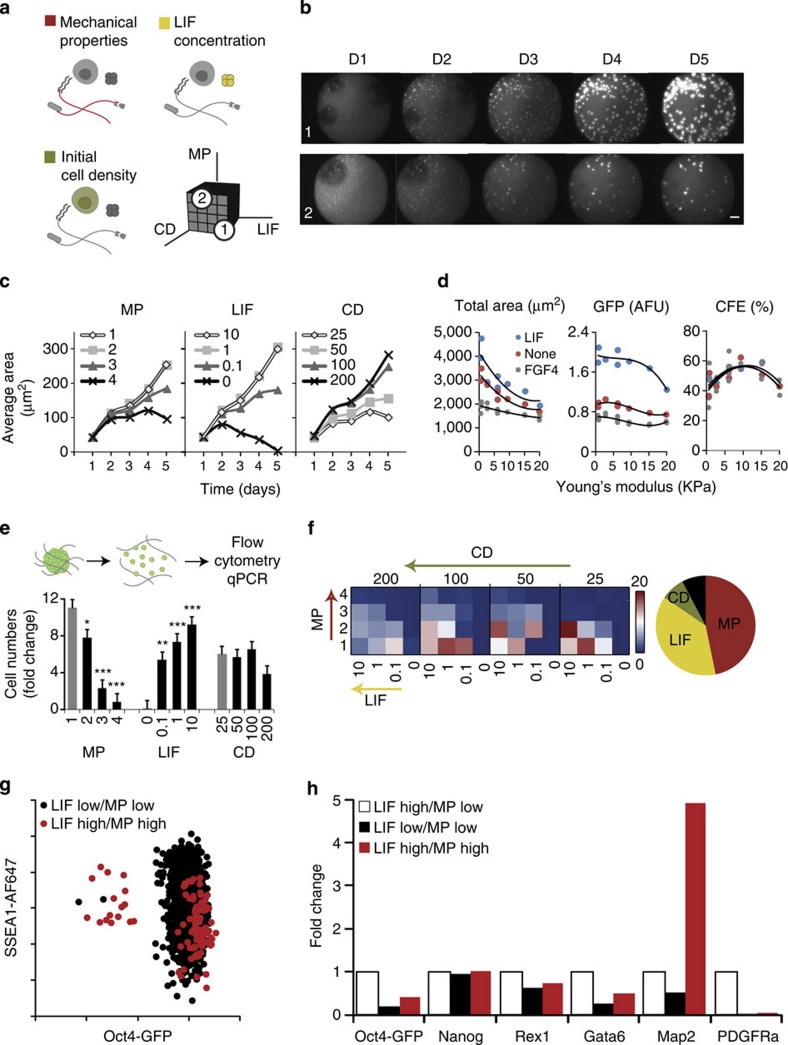
The behaviour of mammalian cells in a tissue is governed by the three-dimensional (3D) microenvironment and involves a dynamic interplay between biochemical and mechanical signals provided by the extracellular matrix (ECM), cell-cell interactions and soluble factors. The complexity of the microenvironment and the context-dependent cell responses that arise from these interactions have posed a major challenge to understanding the underlying regulatory mechanisms. Here we develop an experimental paradigm to dissect the role of various interacting factors by simultaneously synthesizing more than 1,000 unique microenvironments with robotic nanolitre liquid-dispensing technology and by probing their effects on cell fate. Using this novel 3D microarray platform, we assess the combined effects of matrix elasticity, proteolytic degradability and three distinct classes of signalling proteins on mouse embryonic stem cells, unveiling a comprehensive map of interactions involved in regulating self-renewal. This approach is broadly applicable to gain a systems-level understanding of multifactorial 3D cell-matrix interactions.


Figures

Figure 1
Figure 1. 3D combinatorial screening from a modular materials library.
(a) Enzymatically mediated cross-linking scheme, where xxxx xxxx represents specific peptide sequence. (b) Components of the combinatorial toolbox are assembled from biologically relevant factors in categorized form. Stiffness and MMP sensitivity of the matrix are set within the experimentally measured ranges shown (n=3 replicates). (c) Experimental process consists of combining the components library with reporter cells using robotic mixing and dispensing technology into 1,536-well plates (n=3 replicates). (df) Automated microscopy and image processing to determine colony size and GFP intensity. Average cell density per well is set by the initial cell concentration used in the experiment, and exact initial cell density for each well is determined retrospectively by imaging. Examples of a set of images tracking colony growth in a single well over the course of a 5-day experiment (d) 3D confocal reconstruction (e) and image segmentation are shown (f). Scale bar, 200 μm.
Figure 2
Figure 2. ESC proliferation and self-renewal by input conditions.
(a) Image analysis is carried out for each well in DAPI and GFP channels, triplicates of each unique experimental condition are analysed and represented as heat maps. Data is log-transformed, normalized and centred about the mean. Yellow boxes denote top 10 conditions out of the 1,024 unique conditions. (V, W, G, A: degradabilities in decreasing order of MMP sensitivity; –, L, C, F: none, laminin, collagen IV, fibronectin; 1, 2, 3, 4: mechanical properties categories, in increasing stiffness). (b) Gating of all unique conditions and identification of soluble factor composition within these gates. (c) Selection of LIF(+) population, gating for high- and low-area GFP populations and (d) analysis of mechanical properties distribution within these two populations. Scale bar, 200 μm.
Figure 3
Figure 3. Systems-level analyses at multiple scaling levels.
(a) Role of factor categories and (b) of individual factors within categories in overall response. Grey bars represent baseline or control condition and dashed red line represents overall mean. (c) Network interaction map for significantly interacting categories. Grey lines indicate interactions shared by both area and GFP intensity, while green lines represents interactions present only for GFP intensity. Interactions having the most (green) and least (red) effect on proliferation (solid line) and self-renewal (dashed line) are indicated (top and bottom five interacting partners per category). (dg) Examples of all pairwise interactions between two categories are shown as clustered heat maps, with minimum and maximum values within each heat map defining the colour range. (df) Interactions for area and (g) GFP intensity. Numbers along cluster branches indicate support level. Error bars represent s.e.m. V, W, G, A: degradabilities in decreasing order of MMP sensitivity; –, L, C, F: none, laminin, collagen, fibronectin; 1, 2, 3, 4: mechanical properties categories, in increasing stiffness; NI: number of cells per well at Day 1. Error bars represent s.e.m. All pairwise differences were computed using the Tukey–Kramer method. ***P<0.001, **P<0.01, *P<0.05.
Figure 4
Figure 4. Downstream cell assays are compatible with 3D gel microarray approach.
(a) In a targeted screen, 4 levels of 3 factors are combined for a total of 64 unique conditions with multiple replicates. Mechanical properties are varied from 200 to 2,000 Pa (Young’s modulus E), LIF concentration varied from 103 to 10 U ml−1 (with negative control 0 U ml−1) and cell density varied from 25 to 200 cells per μl. (b) Images are taken every day, allowing for the observation of the evolution of colony growth over time in all conditions—here two selected conditions are shown: both start with an initial cell density of 200 cellsper μl; for condition 1: LIF=103 U ml−1, MP=200 Pa (soft); for condition 2: LIF=10 U ml−1, MP=2,000 Pa (stiff). (c) After image analysis, measures such as average colony area can be assessed over time. (d) Average colony area, GFP intensity and colony-forming efficiency are shown as a function of the measured stiffness for three soluble factor regimes. (e) Dissociation of the hydrogel matrices in each well allows a quantification and phenotyping of cells by flow cytometry and other downstream assays. (f) Heatmap representation indicating a clear trend towards a graded bidirectional influence of LIF and MP, an observation reinforced by the global analysis. (g) Differences between specific conditions of interest can be further investigated by analysis of surface marker expression or (h) PCR analysis of genes involved in self-renewal and differentiation into early germ layer. Fold change here is with respect to the baseline LIF high/MP low condition (n=3 biological replicates). Scale bar, 200 μm. Error bars represent s.e.m. All pairwise differences were computed using the Tukey–Kramer method. ***P<0.001, **P<0.01, *P<0.05.

References

    1. Uemura M. et al.. Matrigel supports survival and neuronal differentiation of grafted embryonic stem cell-derived neural precursor cells. J. Neurosci. Res. 88, 542–551 (2010). - PubMed
    1. Kleinman H. K. & Martin G. R. Matrigel: basement membrane matrix with biological activity. Semin. Cancer Biol. 15, 378–386 (2005). - PubMed
    1. Yamada K. M. & Cukierman E. Modeling tissue morphogenesis and cancer in 3D. Cell 130, 601–610 (2007). - PubMed
    1. Barker N. et al.. Clevers, Lgr5(+ve) stem cells drive self-renewal in the stomach and build long-lived gastric units in vitro. Cell Stem Cell 6, 25–36 (2010). - PubMed
    1. Mei Y. et al.. Combinatorial development of biomaterials for clonal growth of human pluripotent stem cells. Nat. Mater. 9, 768–778 (2010). - PMC - PubMed

Publication types

Substances