

Robust synchronization of coupled circadian and cell cycle oscillators in single mammalian cells
- PMID: 25028488
- PMCID: PMC4299496
- DOI: 10.15252/msb.20145218
Robust synchronization of coupled circadian and cell cycle oscillators in single mammalian cells
Abstract
Circadian cycles and cell cycles are two fundamental periodic processes with a period in the range of 1 day. Consequently, coupling between such cycles can lead to synchronization. Here, we estimated the mutual interactions between the two oscillators by time-lapse imaging of single mammalian NIH3T3 fibroblasts during several days. The analysis of thousands of circadian cycles in dividing cells clearly indicated that both oscillators tick in a 1:1 mode-locked state, with cell divisions occurring tightly 5 h before the peak in circadian Rev-Erbα-YFP reporter expression. In principle, such synchrony may be caused by either unidirectional or bidirectional coupling. While gating of cell division by the circadian cycle has been most studied, our data combined with stochastic modeling unambiguously show that the reverse coupling is predominant in NIH3T3 cells. Moreover, temperature, genetic, and pharmacological perturbations showed that the two interacting cellular oscillators adopt a synchronized state that is highly robust over a wide range of parameters. These findings have implications for circadian function in proliferative tissues, including epidermis, immune cells, and cancer.
Keywords: cell cycle; circadian cycle; single cells; synchronization; time‐lapse imaging.
© 2014 The Authors. Published under the terms of the CC BY 4.0 license.
Figures
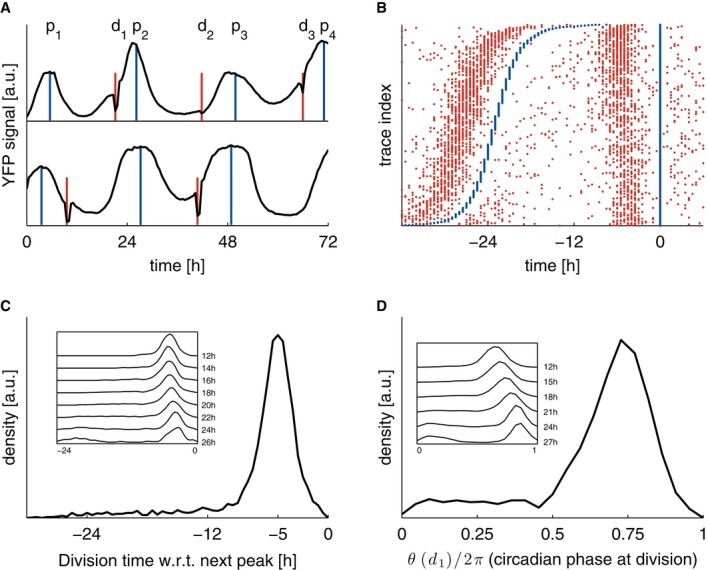
Single-cell time traces showing the circadian YFP signal (black, identified maxima in blue denoted as p), together with cell division events (nuclear envelope breakdown, red, denoted as d). The top trace is typical and shows three divisions before the circadian peaks, the second trace shows an early first division.
Raster plot showing 3,160 traces (with at least two circadian peaks) aligned on the second circadian peak (blue), and sorted according to the interval between the first and second circadian peaks. Divisions (red) show a clear tendency to occur, on average, 5 h before the circadian peaks. A sparse group of early division events associated usually with longer circadian intervals is also visible.
Division times measured with respect to the subsequent circadian peak show a unimodal distribution centered at −5 h. Inset: longer circadian intervals correlate with mitosis occurring, on average, closer to the next peak (also visible in B).
Circadian phases at division (normalized division times) show a unimodal distribution. Inset: longer circadian intervals correlate with mitosis occurring at later circadian phases.
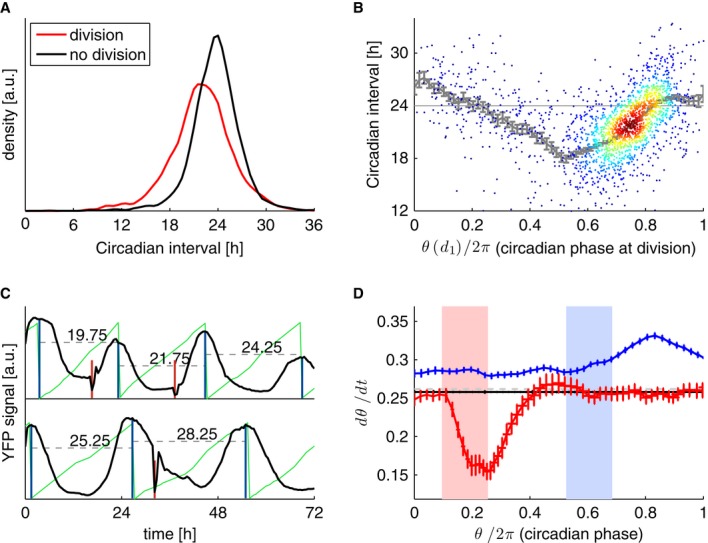
Circadian intervals with divisions (p1,d1,p2) last 21.95 ± 3.8 h (n = 1,926) and are significantly shorter (P < 10−16, t-test) compared to circadian intervals with no divisions (p1, p2) lasting 23.7 ± 3.1 h (n = 2,748).
Duration of circadian interval as a function of circadian phase (θ) at division. The latter is estimated from interpolating between the two maxima. Running mean and standard errors are indicated in gray.
Estimation of the instantaneous circadian phase from the wave forms using a hidden Markov model (Supplementary Information). The instantaneous phase (thin green lines, zero phase is defined as the maximum of the waveform) shows a distortion when comparing short circadian intervals (top trace) with longer ones. Note also the slowdown of the phase progression after an early division (shown in red, bottom).
Instantaneous circadian phase velocity as a function of the circadian phase for intervals without divisions (black) shows that in cells with early divisions (within the pink interval, n = 103), the circadian phase progression is slowed down around and after the division (red), compared to circadian intervals with no divisions (n = 2,748, horizontal black line). In contrast, cells with late divisions within the light blue interval (n = 234) show a globally shifted velocity and a speedup in circadian phase progression after and around the division (blue). Standard error of the mean for the instantaneous frequency at each time is indicated. For better visualization, the three velocity profiles are normalized (centered) by the nearly flat velocity profile (not shown) in division-free intervals. The gray line corresponds to 2π/24.
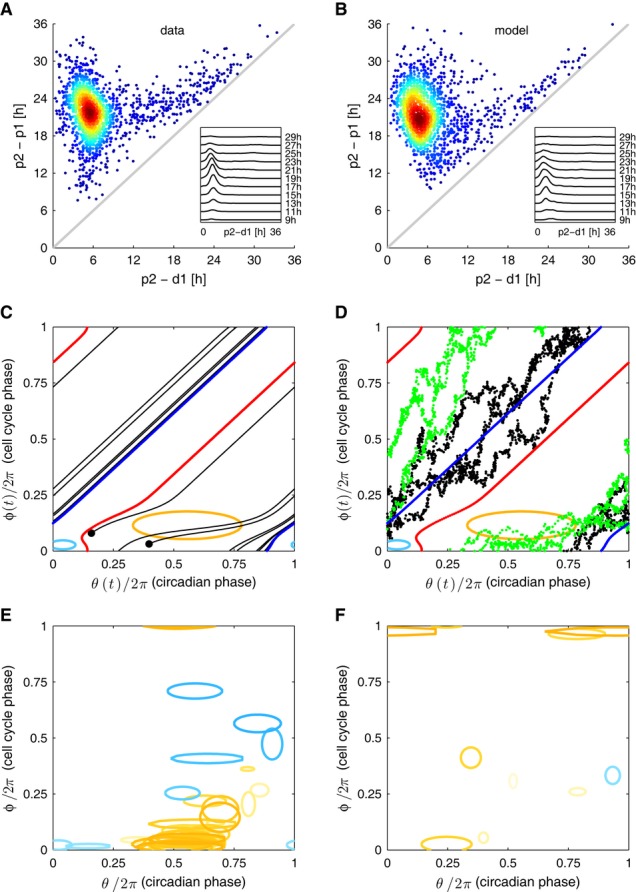
A, B Data versus model. Circadian intervals with divisions (p1,d1,p2) as a function of the shorter subinterval (d1,p2) from the data (A) and well reproduced by the fit (B). Outliers represent a minority of cells dividing early in the circadian cycle, and the tendency of cells to divide nearer the peak for long intervals is also reproduced.
C A generic stochastic model of two interacting phases (θ: circadian phase, θ = 0 is the circadian Rev-Erbα-YFP peak; φ: cell cycle phase, φ = 0 at mitosis) is fit to data, giving an estimate for the coupling functions. Phase portrait (noise terms set to zero) of the best-fit solution shows 1:1 mode locking. The blue (red) curves represent the attractor (repeller), and the black lines are representative trajectories (initial conditions shown as black dots). Regions inside the ellipses represent the influence of the cell cycle on circadian phase: significant speedup of the circadian phase occurs close to, or shortly after, cell division (yellow), while slowdown occurs for earlier circadian phases (light blue). The contours correspond to |K1*G1| or |K2*G1| = 2 [rad/h], and the reverse couplings (K3 and K4) are not shown since they are very small. Estimated parameters are given in Supplementary Tables M1–M5.
D Stochastic simulations explain why longer circadian intervals coincide with later divisions (Figs1D and 2B). Trajectories with long circadian intervals (black) divide late in the circadian cycle and thus tend to have short (d,p) intervals. Trajectories with short circadian intervals (green) tend to divide early in the circadian cycle and tend to have longer (d,p) intervals.
E Coupling functions obtained describing the influence of the cell cycle phase on the circadian phase for 36 independent optimizations show consistency in the location of the acceleration of circadian phase due to the cell cycle (orange), while the slowdown is more variable and weaker in magnitude (light blue). Here 29 (7) out of 42 (30) positive (negative) Gaussians with values above 2 [rad/h] are plotted.
F Coupling functions describing the influence of the circadian phase on the cell cycle are smaller and not consistently located in phase space. Here 7 (1) out of 38 (34) positive (negative) Gaussians with values above 2 [rad/h] are plotted.
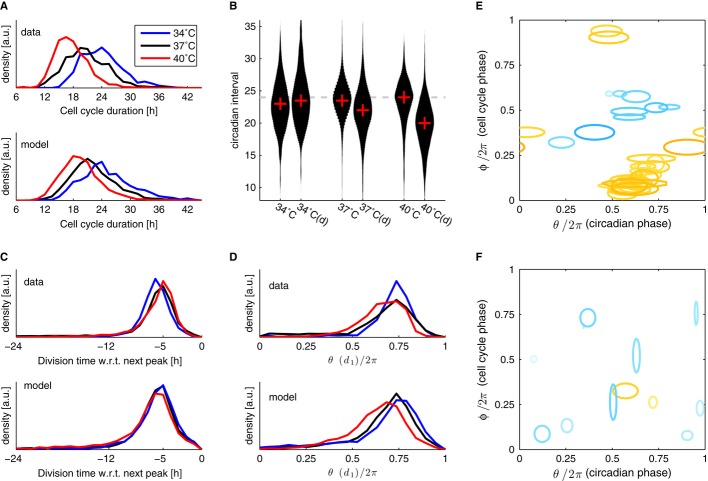
A The cell cycle duration (interval between divisions) scales with temperature.
B Circadian intervals are temperature compensated (slight overcompensation, Q10 = 0.9) in the absence of division (columns labeled 34, 37 and 40°C), and decrease with increasing temperature in presence of divisions (columns labeled 34, 37 and 40°C (d)). Width of the black areas indicates density of traces (histograms); the crosses indicate the median.
C Division times with respect to the next peak are not affected by temperature: divisions occur, on average, 5 h before the circadian YFP peaks at all temperatures.
D Circadian phases at division (normalized division times) show unimodal distributions at all temperatures. Division phases at 40°C are significantly phase advanced compared to 37°C (P < 10−7, Kolmogorov–Smirnov test, K–S). Division phases at 34°C show a small but significant (P < 10−9, K–S test) phase delay compared to 37°C.
E, F Fitting data from all three temperatures together: only the intrinsic periods of the cell cycle were allowed to change, coupling parameters were shared among the three temperatures (obtained parameters are summarized in Supplementary Table M1). (E) Coupling functions obtained describing the influence of the cell cycle phase onto the circadian phase for 38 independent optimizations show consistency in the location of the acceleration of circadian phase due to the cell cycle (orange), while the slowdown (light blue) is more variable and weaker in magnitude. The contours are as in Fig3. Here 27 (9) out of 41 (35) positive (negative) Gaussians with values above 2 [rad/h] are plotted. (F) Coupling functions describing the influence of the circadian phase onto the cell cycle are small (only 12 out of the 76 Gaussians are above threshold) and not consistently located in phase space. Here 2 (10) out of 4 (72) positive (negative) Gaussians with values above 2 [rad/h] are plotted.
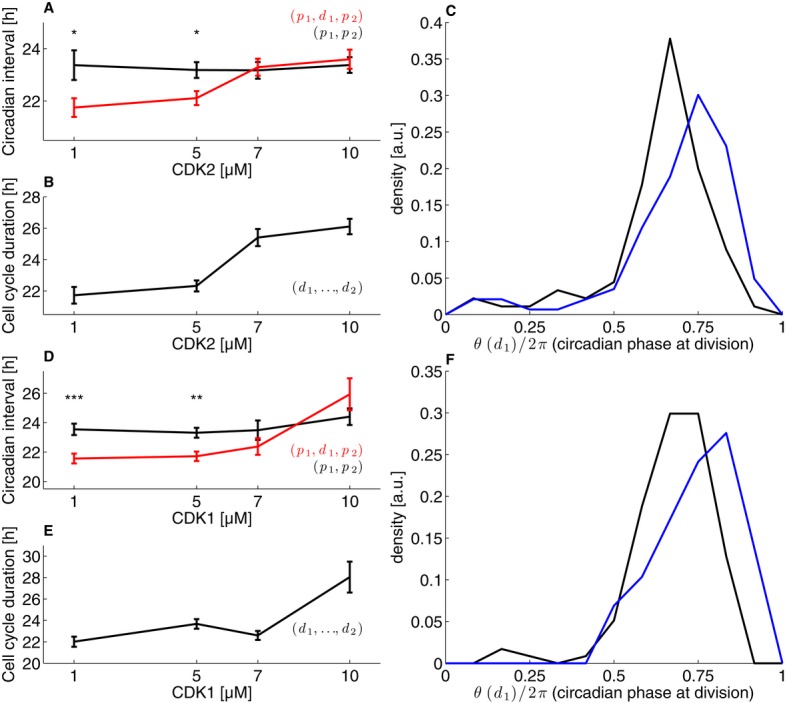
Mean circadian intervals as a function of CDK2 inhibitor concentration for intervals with division (red) and without (black) show that intervals with division lengthen as the cell cycle duration lengthen. The error bars show the standard error on the mean.
Mean cell cycle duration as a function of CDK2 inhibitor concentration.
The distribution of normalized division times (circadian phase at division) at 1 μM CDK2 inhibitor (black) and 10 μM (blue) shows a significant shift (P < 1.2 × 10⁻⁵, K–S test) toward later phases.
As in (A) for the CDK1 inhibitor.
As in (B) for the CDK1 inhibitor.
As in (C) for the CDK1 inhibitor (P < 0.003, K–S test).
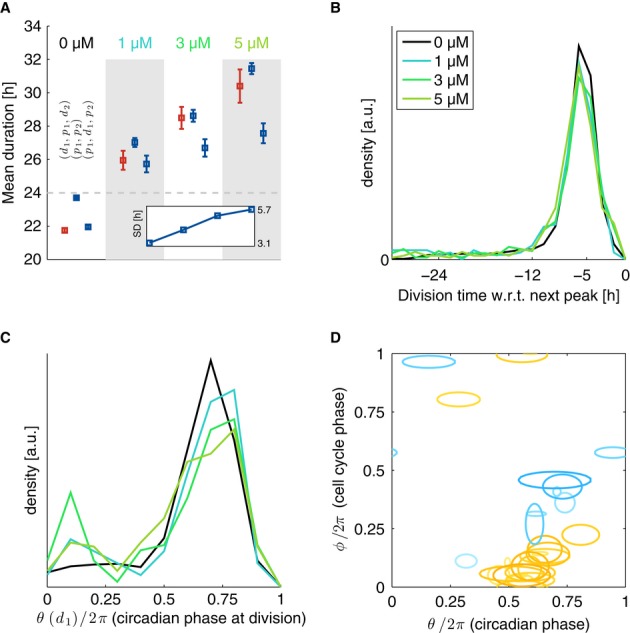
Dose dependency of cell cycle durations (d1,p1,d2), circadian intervals without division (p1,p2) and circadian intervals with divisions (p1,d1,p2). Inset: dose dependency of the standard deviation (SD) of circadian intervals (p1,p2).
Temporal synchronization of the two cycles is equally tight at all Longdaysin concentrations and indistinguishable from the control condition.
Normalized division times (circadian phase at division) show that Longdaysin-treated cells have more early divisions compared to control.
Coupling function estimated from the stochastic model (n = 31 independent optimizations) for 1,3 and 5 μM Longdaysin is similar to ones obtained in control (Fig3). Models for all concentrations are fit independently (obtained parameters are summarized in Supplementary Table M3). Contours are as in Figs3 and 4. Here 17 (9) out of 35 (27) positive (negative) Gaussians with values above 2 [rad/h] are plotted.
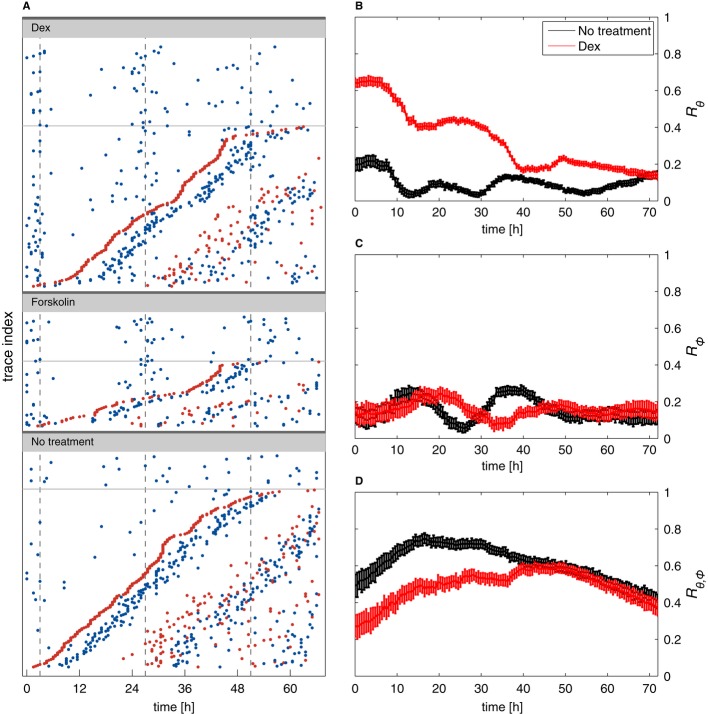
A Raster plots (each line is a cell trace) for cells treated with dexamethasone (Dex), forskolin, and untreated controls. Circadian peaks are in blue and division in red. Traces without division are in the upper parts of the panels above the thin lines. For cells with divisions, traces are sorted from bottom to top according to the time of the first division. This shows that cell divisions occur uniformly and are not affected by the phase resetting and that the second circadian peaks follow division after both dexamethasone and forskolin.
B–D Synchronization indices over time in dexamethasone-treated cells (red) and controls (black). A value of zero for an index coincides with fully random phases while a value of 1 describes perfect synchronization. The circadian synchronization index Rθ (B) is initially much higher in dex-treated cells, as expected. Synchrony rapidly decays due to divisions (as visible in A, non-dividing cells clearly stay more synchronized). The cell cycle synchronization index (C) Rϕ is low throughout the recordings, indicating that dexamethasone treatment, and thus circadian phase synchronization, does not synchronize the cell cycle (also visible in A since the first divisions do not line up vertically). The synchronization index Rθ,ϕ (D) measuring synchronization of the circadian and cell cycles indicates that dexamethasone treatment transiently reduces synchrony of the two cycles. The initial increase (t < 15 h) in both conditions mostly reflects larger uncertainties in the estimated phases for early times (Supplementary Information). Error bars indicate standard deviations.
References
-
- Brown WR. A review and mathematical analysis of circadian rhythms in cell proliferation in mouse, rat, and human epidermis. J Invest Dermatol. 1991;97:273–280. - PubMed
-
- Brown SA, Ripperger J, Kadener S, Fleury-Olela F, Vilbois F, Rosbash M, Schibler U. PERIOD1-associated proteins modulate the negative limb of the mammalian circadian oscillator. Science. 2005;308:693–696. - PubMed
-
- Chambard JC, Lefloch R, Pouyssegur J, Lenormand P. ERK implication in cell cycle regulation. Biochim Biophys Acta. 2007;1773:1299–1310. - PubMed
Publication types
MeSH terms
Substances
LinkOut - more resources
Full Text Sources
Other Literature Sources
Research Materials
