. 2014 Aug 29;289(35):24680-90.
doi: 10.1074/jbc.M114.566174. Epub 2014 Jul 15.

Peptide-dependent conformational fluctuation determines the stability of the human leukocyte antigen class I complex

Affiliations

Peptide-dependent conformational fluctuation determines the stability of the human leukocyte antigen class I complex

Saeko Yanaka et al. J Biol Chem. .

Abstract

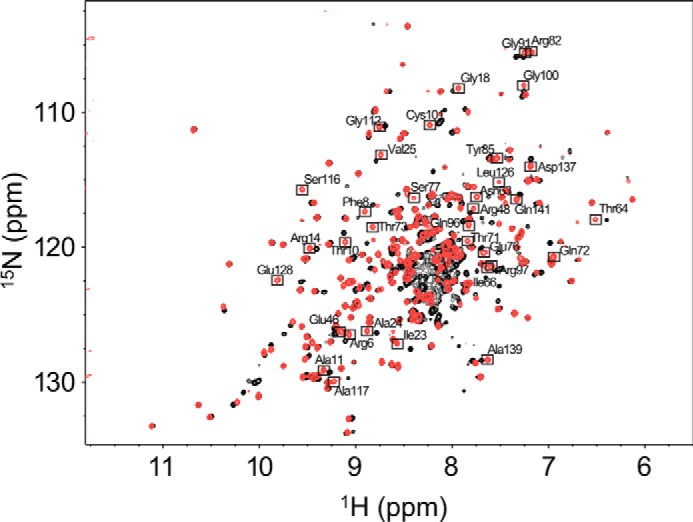
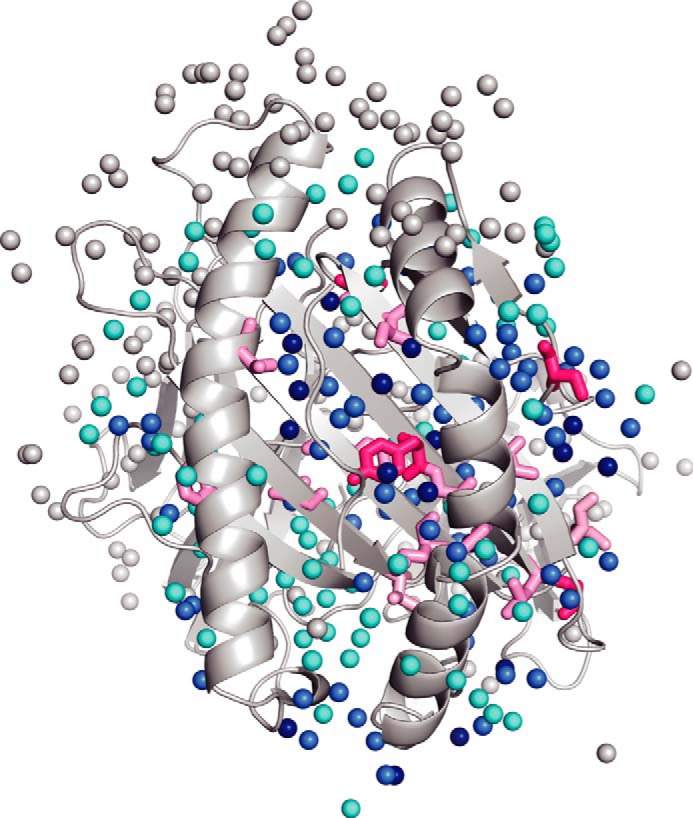
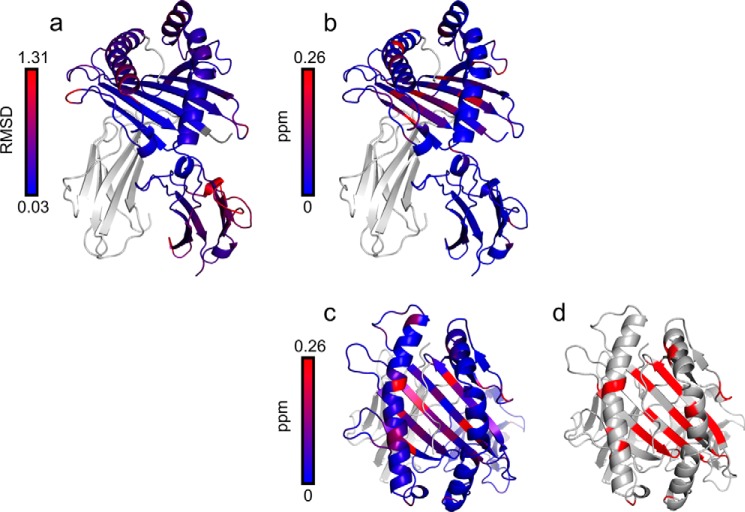
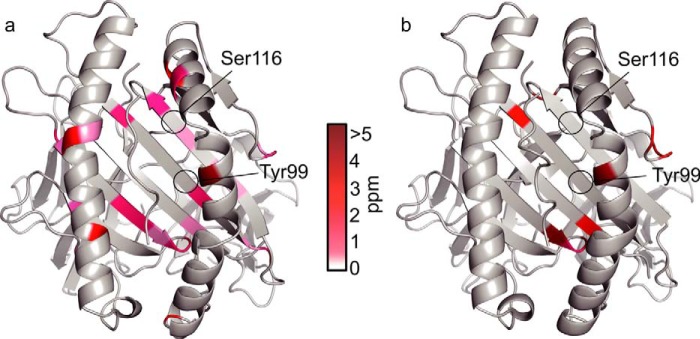
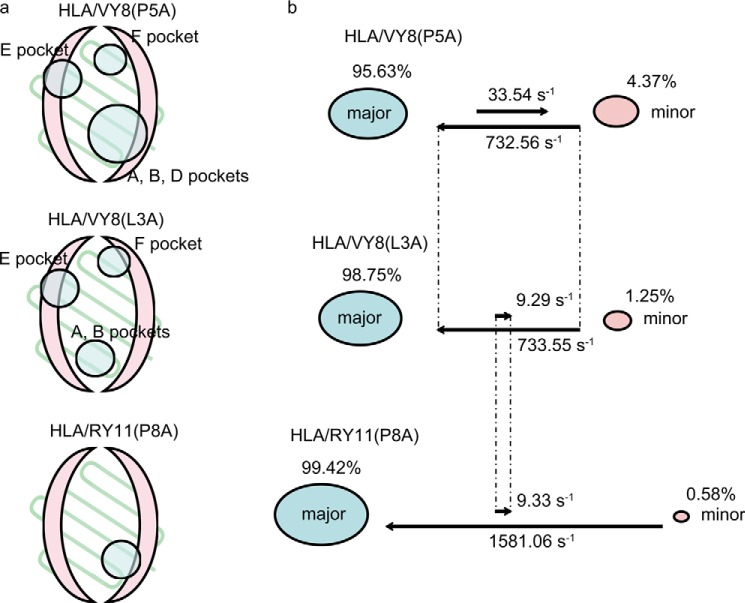
In immune-mediated control of pathogens, human leukocyte antigen (HLA) class I presents various antigenic peptides to CD8(+) T-cells. Long-lived peptide presentation is important for efficient antigen-specific T-cell activation. Presentation time depends on the peptide sequence and the stability of the peptide-HLA complex (pHLA). However, the determinant of peptide-dependent pHLA stability remains elusive. Here, to reveal the pHLA stabilization mechanism, we examined the crystal structures of an HLA class I allomorph in complex with HIV-derived peptides and evaluated site-specific conformational fluctuations using NMR. Although the crystal structures of various pHLAs were almost identical independent of the peptides, fluctuation analyses identified a peptide-dependent minor state that would be more tightly packed toward the peptide. The minor population correlated well with the thermostability and cell surface presentation of pHLA, indicating that this newly identified minor state is important for stabilizing the pHLA and facilitating T-cell recognition.

Keywords: Major Histocompatibility Complex (MHC); Nuclear Magnetic Resonance (NMR); Protein Dynamic; Protein Stability; Thermodynamics.


Figures

FIGURE 1.
FIGURE 1.
Similarity of the crystal structures of HLA/VY8 and HLA/RY11. a, the crystal structures of HLA/VY8 (red; PDB code 1A1N) and HLA/RY11 (blue; PDB code 4LNR) superposed using the HLA heavy chain. The structure of β2-microglobulin is shown in gray. b, closed view around the peptide-binding domain in the structures of HLA/VY8 (red) and HLA/RY11 (blue). The regions around the B and F pockets are circled, and hydrogen bonds important for peptide recognition involving Tyr-99 and Ser-116 are represented as dashed lines.
FIGURE 2.
FIGURE 2.
HSQC spectra of HLA/VY8 and HLA/VY8(P5A). The 1H,15N TROSY HSQC spectra of HLA/VY8 and HLA/VY8(P5A) are shown in black and red, respectively. The resonances of HLA/VY8(P5A) that do not overlap with those of HLA/VY8 are boxed with the assignments.
FIGURE 3.
FIGURE 3.
Conformational fluctuations of HLA/VY8(P5A). a, chemical shift differences (Δω) between the major and minor states plotted on the crystal structure of HLA/VY8 as a continuous color scheme from gray to red. The positions around Tyr-99 and Ser-116, which are important for peptide recognition, are circled. b, relaxation dispersion profiles for Ser-116 and Tyr-99 recorded at 14.1 tesla (black) and 17.6 tesla (red). c, the van't Hoff plot for the fluctuations of pHLA between the major and minor states. The best-fit curve is shown as a solid line. The determinant factor (R2) is 0.99.
FIGURE 4.
FIGURE 4.
The water molecules around the fluctuating residues. Water molecules are shown as spheres in the HLA/VY8 structure. The fluctuating hydrophobic residues are shown as sticks in the same color scheme as in Fig. 2. Dark blue, blue, and cyan waters are located within 3.2, 6.4, and 9.6 Å from the fluctuating residues, respectively.
FIGURE 5.
FIGURE 5.
Similarity in the solution structures of HLA/VY8(P5A), HLA/VY8(L3A), and HLA/RY11(P8A). 1H,15N TROSY HSQC spectra of HLA/VY8(P5A), HLA/VY8(L3A), and HLA/RY11(P8A) are shown in red, purple, and blue, respectively. Residues showing relatively large chemical shift differences in the peptide binding groove are shown in the inset.
FIGURE 6.
FIGURE 6.
The chemical shift differences of HLA/VY8(L3A) and HLA/RY11(P8A) from HLA/VY8(P5A). The chemical shift differences ((ΔδH)2+(ΔδN/5)2)1/2 between HLA/VY8(P5A) and HLA/RY11(P8A) and between HLA/VY8(P5A) and HLA/VY8(P3A) are shown as blue bars in the upper and lower graphs, respectively. The gray background shows the unassigned residues in HLA/VY8(L3A) and HLA/RY11(P8A). The yellow and red boxes in the middle indicate the secondary structural components observed in the crystal structure of HLA/VY8.
FIGURE 7.
FIGURE 7.
Comparison of the r.m.s.d. differences and chemical shift differences. a, the r.m.s.d. for each residue in the crystal structures of HLA/VY8 and HLA/RY11 are shown. b and c, the chemical shift differences between HLA/VY8(P5A) and HLA/VY8(L3A) are shown from different angles. d, the residues showing relaxation dispersions in HLA/VY8(P5A) and HLA/VY8(P3A) are shown in red.
FIGURE 8.
FIGURE 8.
Conformational fluctuations of HLA/VY8(L3A) and HLA/RY11(P8A). Chemical shift differences (Δω) are plotted on the crystal structures of HLA/VY8 (a) and HLA/RY11 (b) in the same manner as in Fig. 3a.
FIGURE 9.
FIGURE 9.
Fluctuating regions in three pHLA complexes. a, fluctuating regions in HLA/VY8(P5A), HLA/VY8(L3A), and HLA/RY11(P8A) are shown as schematic drawings. The α-helices and β-strands in the peptide binding domain are shown in pink and light green, respectively. The fluctuating regions are circled with the name of the pockets. b, the kinetic rates and the populations of the major and minor states are visualized for the three pHLA complexes.
FIGURE 10.
FIGURE 10.
Correlation between minor populations, stability, and T-cell activity decay rate. The left, middle, and right graphs show the minor populations, melting temperatures, and T-cell activity decay rates of the three pHLAs. The formula y = a × exp(−b × t) was used to calculate the T-cell activity decay rate with previously reported data (15), where t represents the time for activity measurement, and log b was determined as the decay rate.
FIGURE 11.
FIGURE 11.
The pHLA transient induced-fit model. A schematic illustration of pHLA fluctuation is shown. The HLA heavy chain is shown in pink, and the peptide and β2-microglobulin are represented as a trapezoid and a circle, respectively. Water molecules are shown as light blue circles.

References

    1. Goulder P. J., Walker B. D. (2012) HIV and HLA class I: an evolving relationship. Immunity 37, 426–440 - PMC - PubMed
    1. Streeck H., Nixon D. F. (2010) T cell immunity in acute HIV-1 infection. J. Infect. Dis. 202, S302–S308 - PMC - PubMed
    1. Garcia-Lora A., Algarra I., Garrido F. (2003) MHC class I antigens, immune surveillance, and tumor immune escape. J. Cell. Physiol. 195, 346–355 - PubMed
    1. Singer D. S., Mozes E., Kirshner S., Kohn L. D. (1997) Role of MHC class I molecules in autoimmune disease. Crit. Rev. Immunol. 17, 463–468 - PubMed
    1. Goulder P. J., Altfeld M. A., Rosenberg E. S., Nguyen T., Tang Y., Eldridge R. L., Addo M. M., He S., Mukherjee J. S., Phillips M. N., Bunce M., Kalams S. A., Sekaly R. P., Walker B. D., Brander C. (2001) Substantial differences in specificity of HIV-specific cytotoxic T cells in acute and chronic HIV infection. J. Exp. Med. 193, 181–194 - PMC - PubMed

Publication types

Substances