

doi: 10.1186/gm568.
eCollection 2014.
Development and validation of a new high-throughput method to investigate the clonality of HTLV-1-infected cells based on provirus integration sites
Affiliations
- PMID: 25028597
- PMCID: PMC4097847
- DOI: 10.1186/gm568
Item in Clipboard
Development and validation of a new high-throughput method to investigate the clonality of HTLV-1-infected cells based on provirus integration sites
Genome Med.
.
Abstract
Transformation and clonal proliferation of T-cells infected with human T-cell leukemia virus type-I (HTLV-1) cause adult T-cell leukemia. We took advantage of next-generation sequencing technology to develop and internally validate a new methodology for isolating integration sites and estimating the number of cells in each HTLV-1-infected clone (clone size). Initial analysis was performed with DNA samples from infected individuals. We then used appropriate controls with known integration sites and clonality status to confirm the accuracy of our system, which indeed had the least errors among the currently available techniques. Results suggest potential clinical and biological applications of the new method.
Figures
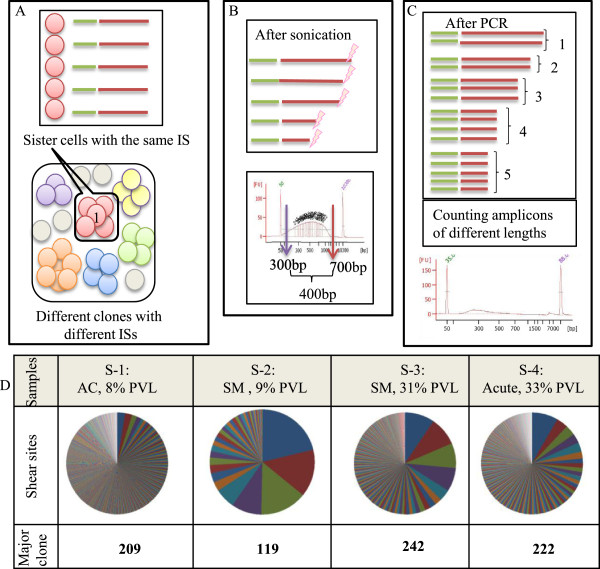
Estimating clone size by ‘shear sites’. Also see Additional file 2: Figure S2 for a simple image from an integration site and its shear sites. (A) Depicted is the complex population of uninfected cells (grey circles) together with infected clones (circles of different colors). A clone is shown as a group of sister cells (circles of the same color) having the same integration site (IS). Different clones are distinguishable based on differing integration sites, and thus the number of integration sites represents the number of infected clones. For example, the six different unique integration sites refer to six unique clones. (B) Genomic DNA fragmented by sonication generates random shear sites (fragments of different length). Fragment size, measured by an Agilent Bioanalyzer, ranged from 300 to 700 bp. This size range can theoretically provide approximately 400 variations. (C) The size distribution of fragments decreased following amplification by integration-site-specific PCR. From the deep sequencing data, the original number of starting fragments could be estimated by removing PCR duplicates and counting fragments with different lengths. For example, five different lengths of PCR amplicons represent five infected sister cells. (D) We analyzed four samples, including (S-1: asymptomatic carrier (AC), (8% PVL)), (S-2: smoldering (SM), (9% PVL)), (S-3: smoldering, (31% PVL)), and (S-4: acute, (33% PVL)). Using our method, the clone sizes were quantified by considering only shear sites. The first major clone (the largest clone) of each sample was mapped to (chr 11-41829319 (+)), (chr 15: 59364370 (+)), (chr 4-563543 (-)), and (chr X - 83705328 (-)), respectively. The shear site variations of each major clone were 209, 119, 242, and 222, respectively. Different colors on the pie graphs indicate different integration sites, and the size of each piece represents the clone size.
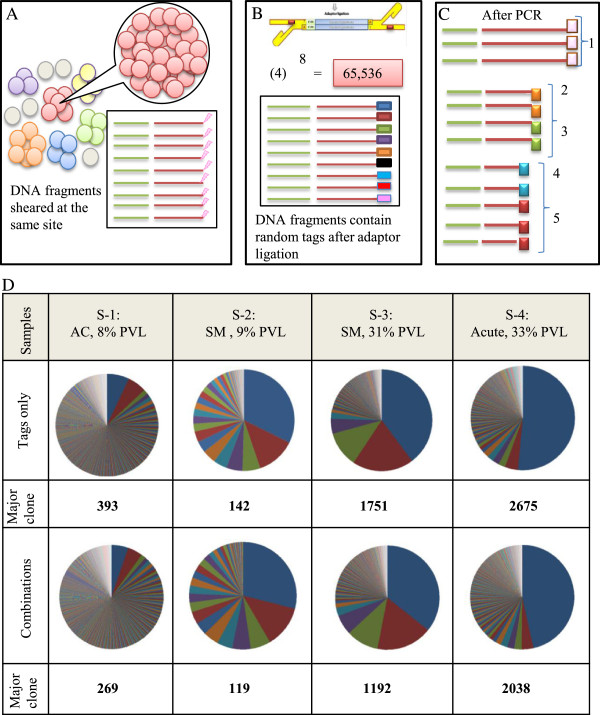
Measuring clone size using the tag system. (A) The depiction above shows that shear site variations are not able to cover all sister cells in large clones. As the number of the sister cells in a given clone increases, the probability of DNA shearing at the same site increases. (B) Prior to PCR, we incorporated 8-bp random tags into each DNA fragment to uniquely mark them. Random tags could theoretically provide approximately 65,536 variations. The number of potential variations is expected to amply cover large numbers of the sister cells. (C) The tag information was used to remove PCR duplicates and to estimate the original number of starting fragments. If the fragments had the same shear sites but different tags, they were counted separately. For example, here five different combinations of tags and shear sites represent five infected cells. (D) Samples: S-1, S-2, S-3, and S-4 were analyzed by the final optimal condition (Bowtie parameters: -v 3 - - best, and filtering condition: (merging approach) JT-10). Clone size was measured by tags only or by the combination of shear sites and tags. The covered variations were (393,142, 1751, and 2675) and (269, 119, 1192, and 2038), respectively.
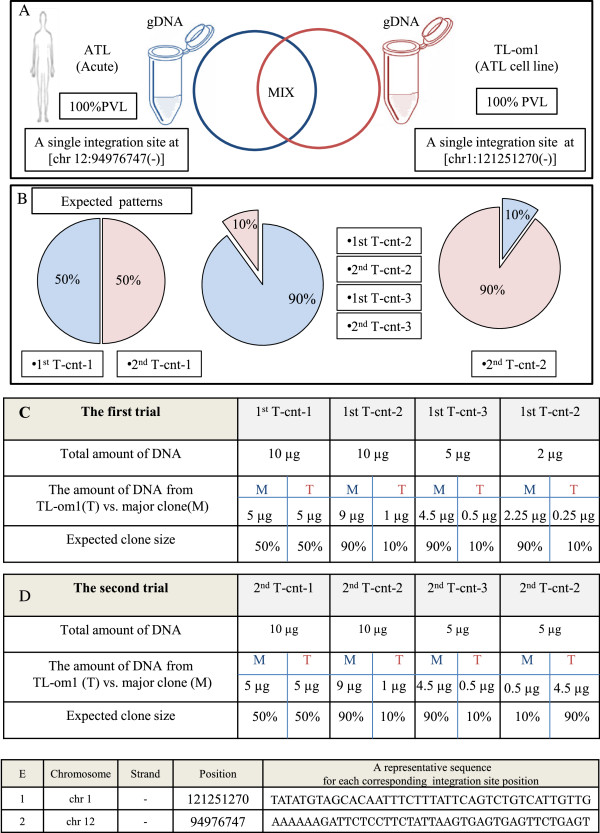
Preparing the control system. (A) The control system was designed by mixing sonicated genomic DNA (gDNA) of TL-Om1 with that of an ATL patient in proportions of 50:50 and 90:10. TL-Om1 is a standard ATL cell line with 100% PVL and a known single integration site at (chr1:121251270(-)). The patient sample was from an acute type of ATL with 100% PVL and a single integration site at (chr 12:94976747(-)). (B) The expected clonality patterns: (50% vs. 50%), (90% vs. 10%), and (10% vs. 90%) were generated by mixing gDNA from an ATL sample with that from TL-Om1. (C, D) Full details of the first trial’s and the second trial’s samples including: name of samples, total amount of DNA (μg), the amount of DNA (μg) from TL-Om1 (T) vs. major clone (M), and expected clone size are provided. (E) Integration site position of TL-Om1 and the major clone of ATL sample.
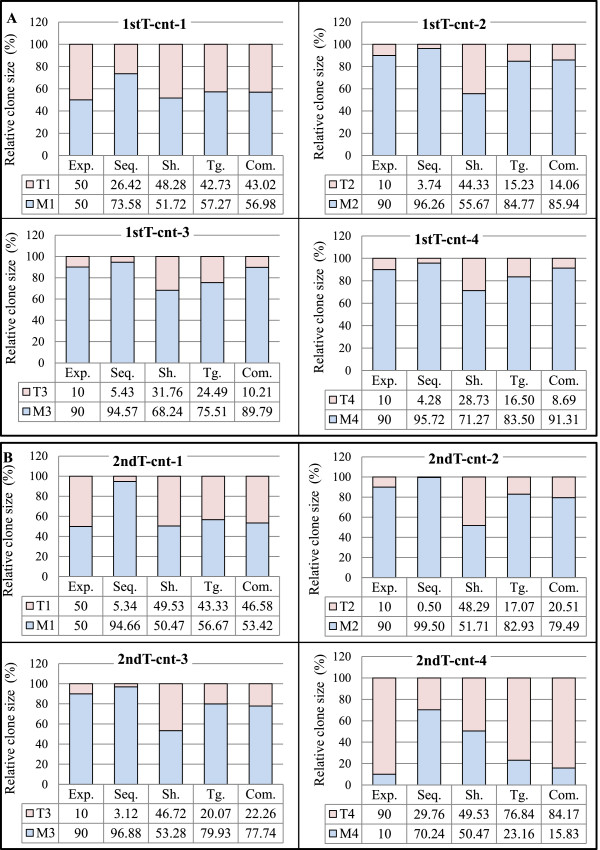
Validation of the tag system. For each control sample, both the expected and the experimentally observed patterns of raw sequence reads, shear sites, and the combination of tags and shear sites are represented in the bar graphs. Abbreviations: Com.: Combinations, Exp.: expected pattern, Seq.: raw sequencing data without removing PCR duplicates, Sh.: Shear sites, Tg.: Tags. (A) Clone size data of the first trial samples: Data were obtained considering the final optimal conditions: (Bowtie parameters: -v 3 - - best, and filtering condition: (merging approach) JT-10). (B) Clone size data of the second trial samples: Data were obtained considering the final optimal conditions: (Bowtie parameters: -v 3 - - best, and filtering condition: (merging approach) JT-10-1%). See Additional file 1: Figure S4 for information on merging approach.
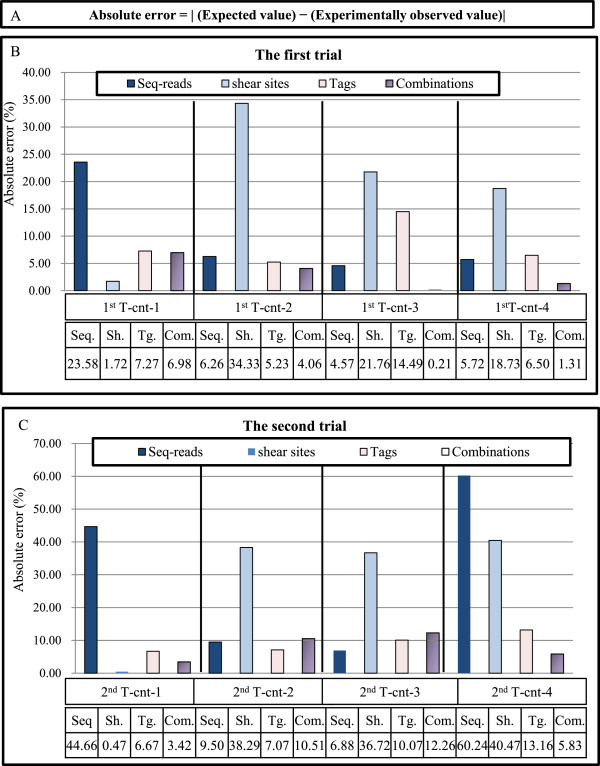
Evaluating the accuracy of the clonality analysis. (A) Absolute error is calculated by subtracting the expected values from the experimentally observed values. (B, C) The accuracy of the method is evaluated by calculating the absolute error of the clone size estimation of the control samples (see Figure 3). The y axis represents the percentage of absolute errors in different conditions including: (1) raw sequencing reads without removing duplicated PCR, (2) only shear sites, (3) only tags, and (4) the combination of tags and shear sites. The absolute errors of the final optimal condition: the first trial: (Bowtie parameters: -v 3 - - best, and filtering condition: (merging approach) JT-10), and the second trial: (Bowtie parameters: -v 3 - - best, and filtering condition: (merging approach) JT-10-1%) are presented in this figure. Please refer to Additional file 1: Figure S6 for the absolute errors in all examined conditions. (B) The absolute errors of the first trial. (C) The absolute errors of the second trial. See Additional file 1: Figure S4 for information on merging approach.
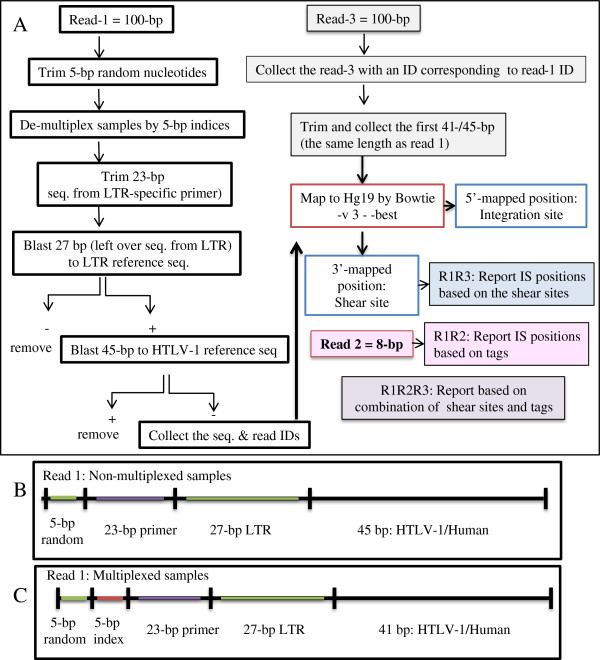
In-silico analysis work flow. (A) Illumina HiSeq 2000 platform outputs raw data of (Read-1 = 100 bp), (Read-3 = 100 bp), and (Read-2 = 8 bp). Data were analyzed according to this work flow after checking quality with the FastQC tool. In the case of Read-1, the first 5 bp were trimmed, and the next 5 bp were used to de-multiplex indexed samples. The downstream 23 bp, which correspond to the LTR primer (F2), were then removed. The next 27 bp were subjected to a blast search against the LTR reference sequence. For the blast search reads, the remaining 41/45 bp were subjected to a blast search against an HTLV-1 reference sequence. Reads were confirmed to be from HTLV-1 was removed, and the sequences and IDs from the remaining reads which considered as human, were collected. Subsequently, Read-3 with IDs corresponding to Read-1’s IDs were collected. The first 41/45 bp of Read-3 were trimmed and collected to have the same length as Read-1. The paired sequences of Read-1 and Read-3 (same lengths) were mapped against hg19 by Bowtie with -v 3 - -best parameters. The 5′-mapped positions were considered to be integration sites and the 3′-mapped positions as shear sites. Read-2 information was used to retrieve the clone size based on tags. Finally, the clone size was computed by combining tag and shear site information. All the analyses were done by our own Perl scripts, which resulted in the following reports. Report R1R3: the distribution of unique shear sites per integration site. Report R1R2: the distribution of unique tags per integration site. Report R1R2R3: the distribution of unique tags and shear sites per integration site. (B, C) The structure of Read-1 for the non-multiplexed and multiplexed samples.
References
-
- Matsuoka M, Jeang K-T. Human T-cell leukaemia virus type 1 (HTLV-1) infectivity and cellular transformation. Nat Rev Cancer. 2007;7:270–280. - PubMed
LinkOut - more resources
Full Text Sources
Other Literature Sources
