. 2014:2014:427298.
doi: 10.1155/2014/427298. Epub 2014 Jun 17.

Protective effects of Ginkgo biloba extract EGb 761 against noise trauma-induced hearing loss and tinnitus development

Affiliations

Protective effects of Ginkgo biloba extract EGb 761 against noise trauma-induced hearing loss and tinnitus development

Konstantin Tziridis et al. Neural Plast. 2014.

Abstract

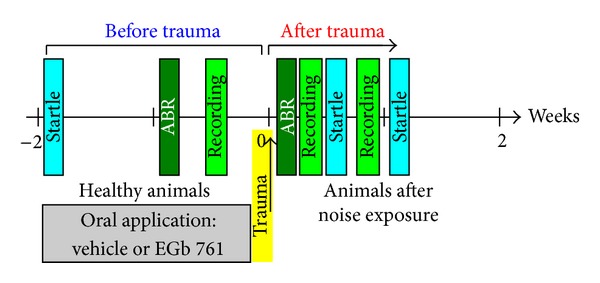
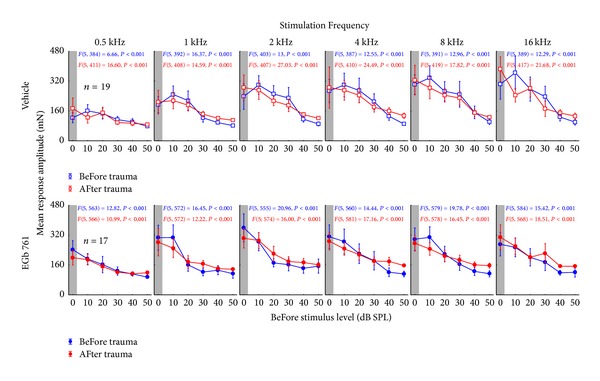
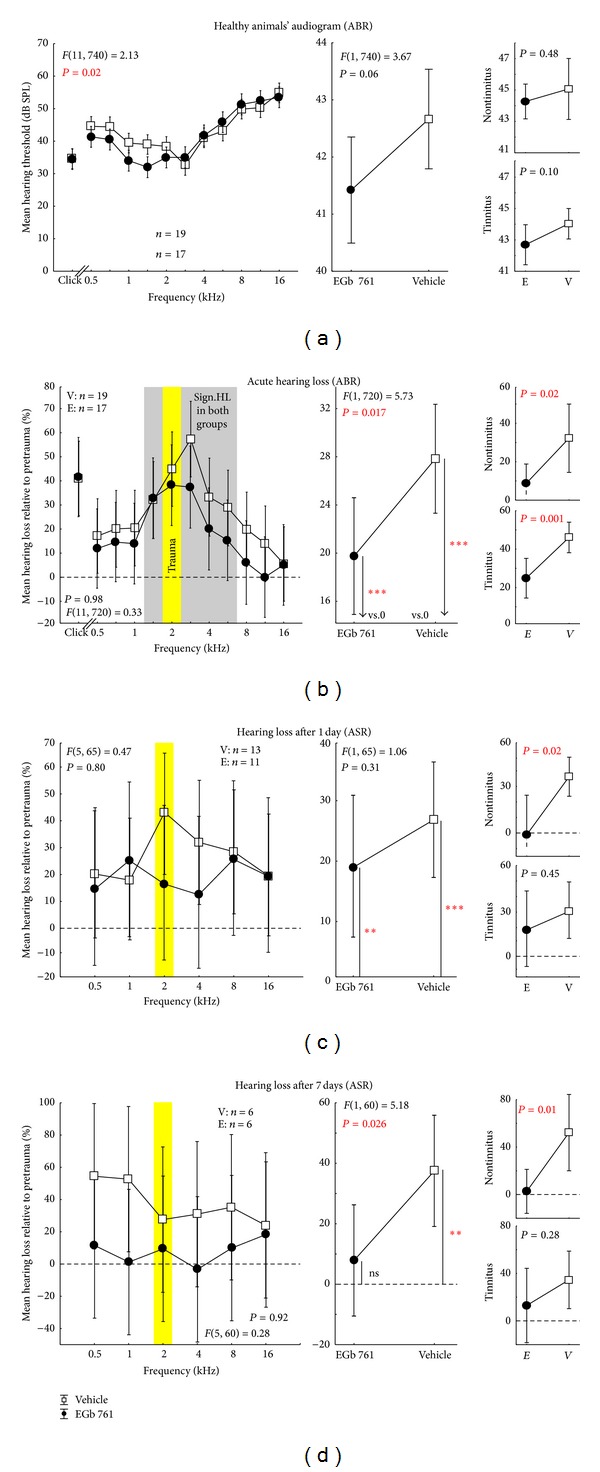
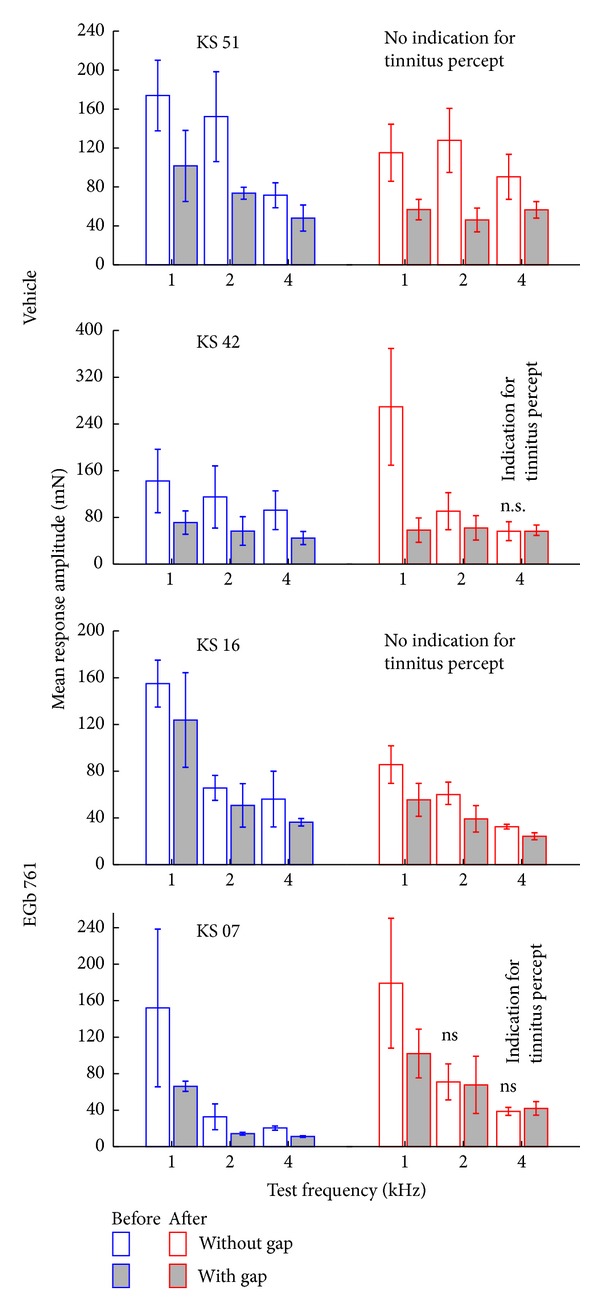
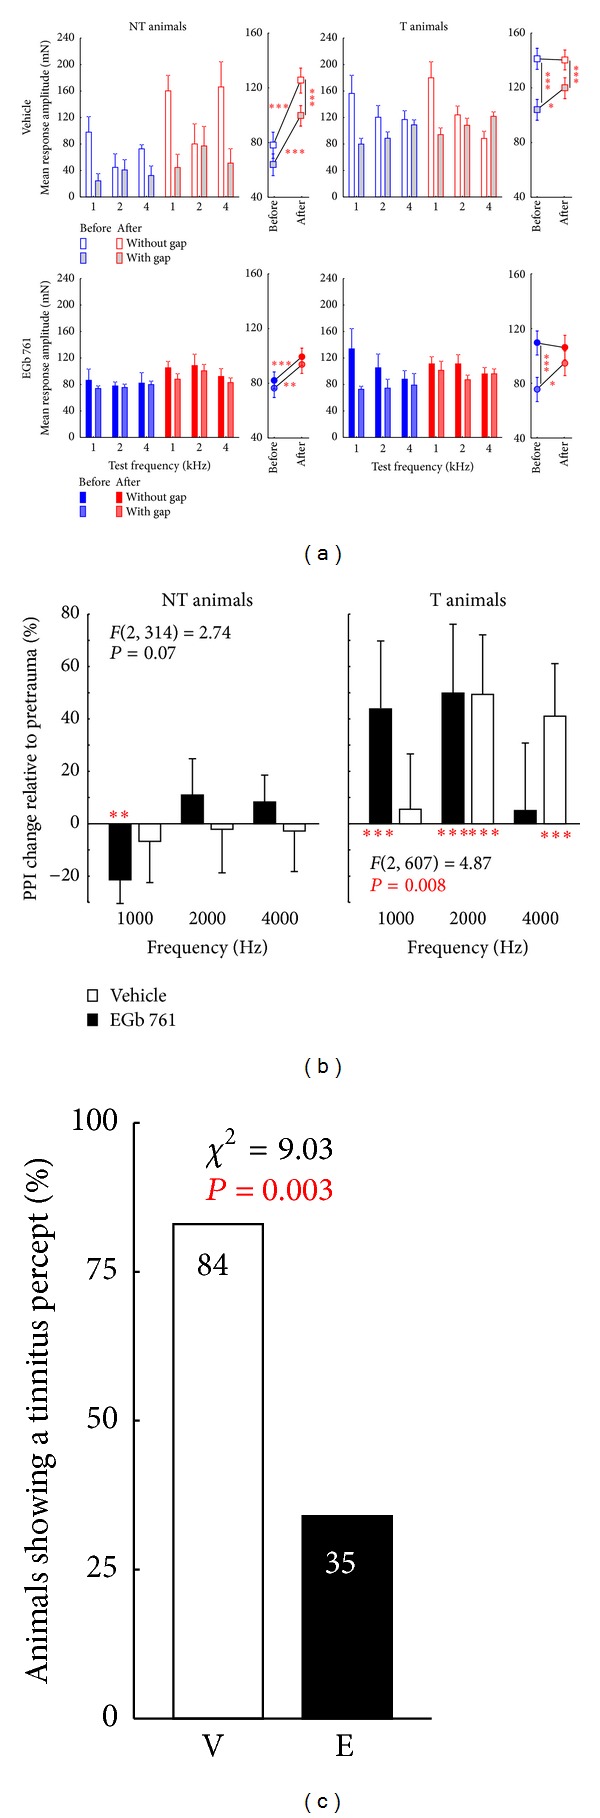
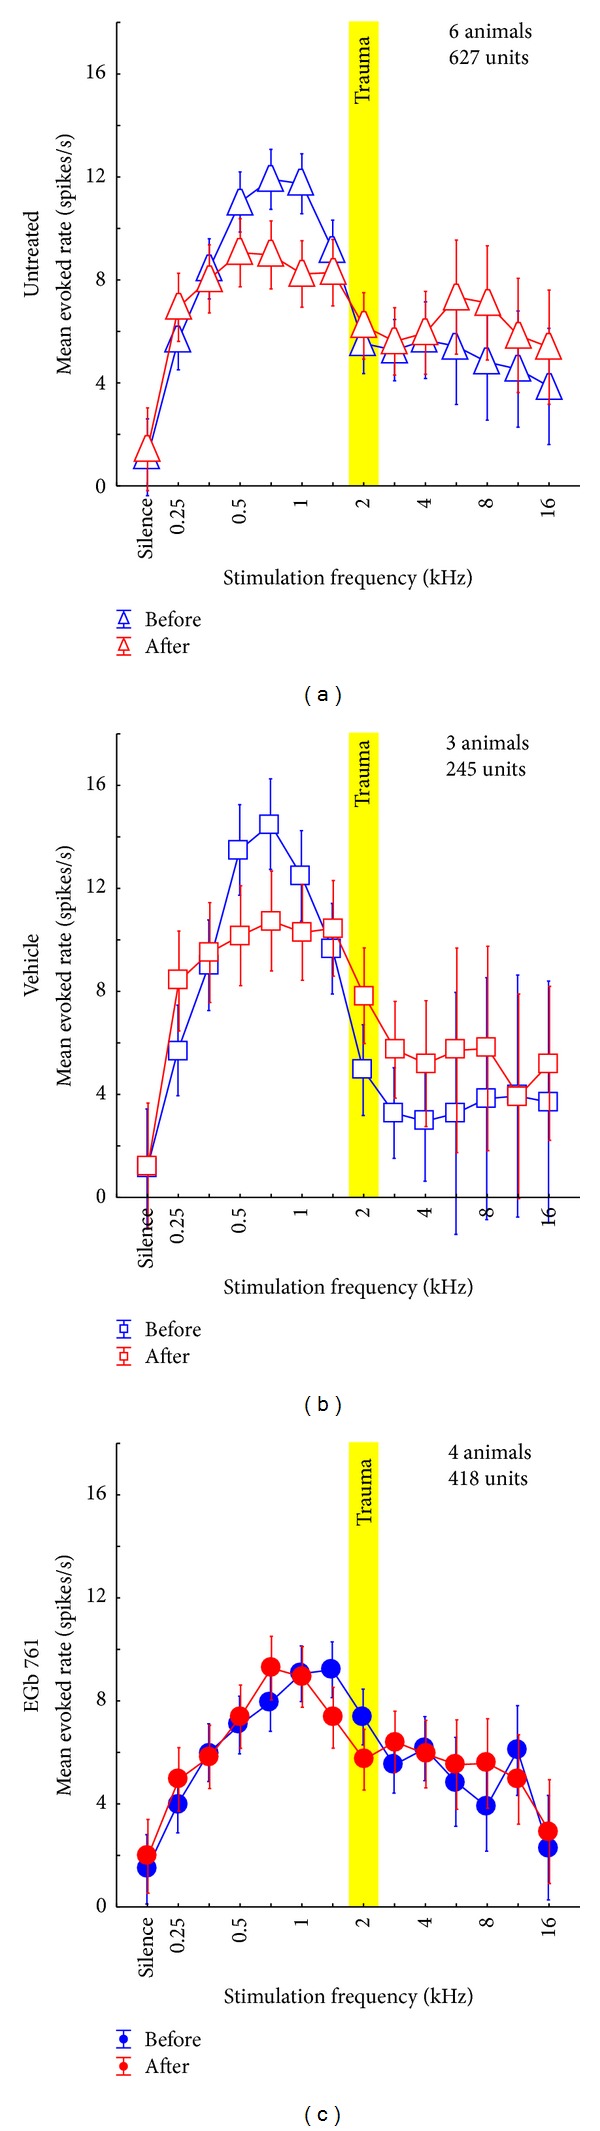
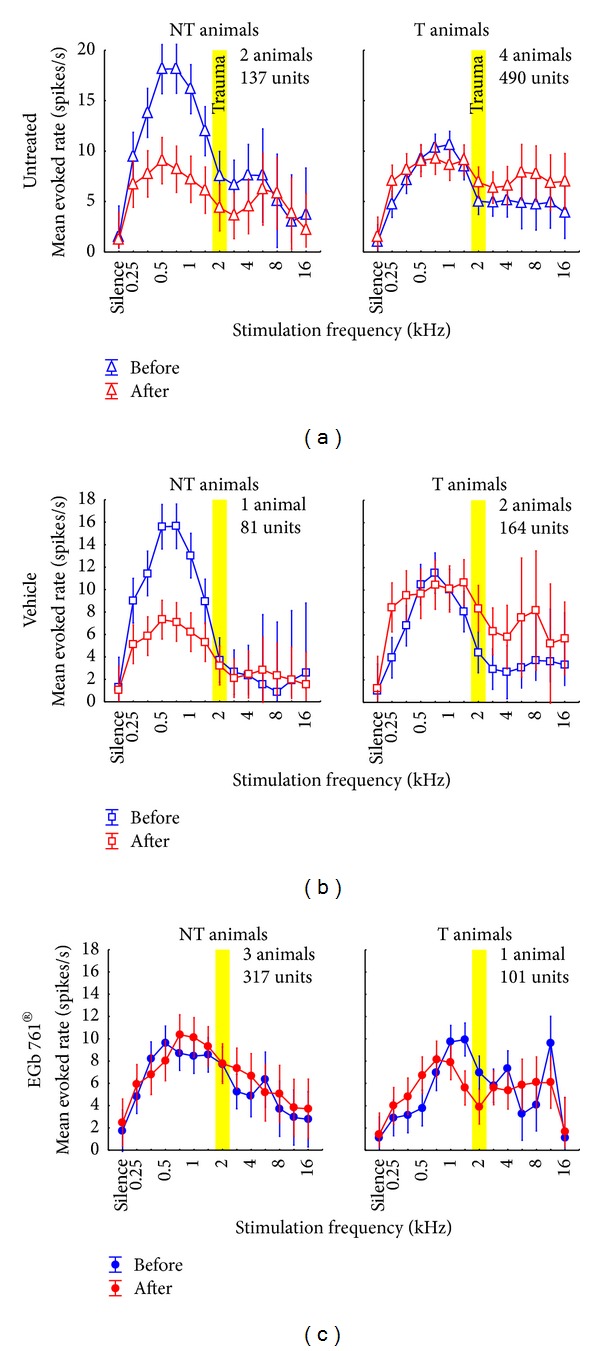
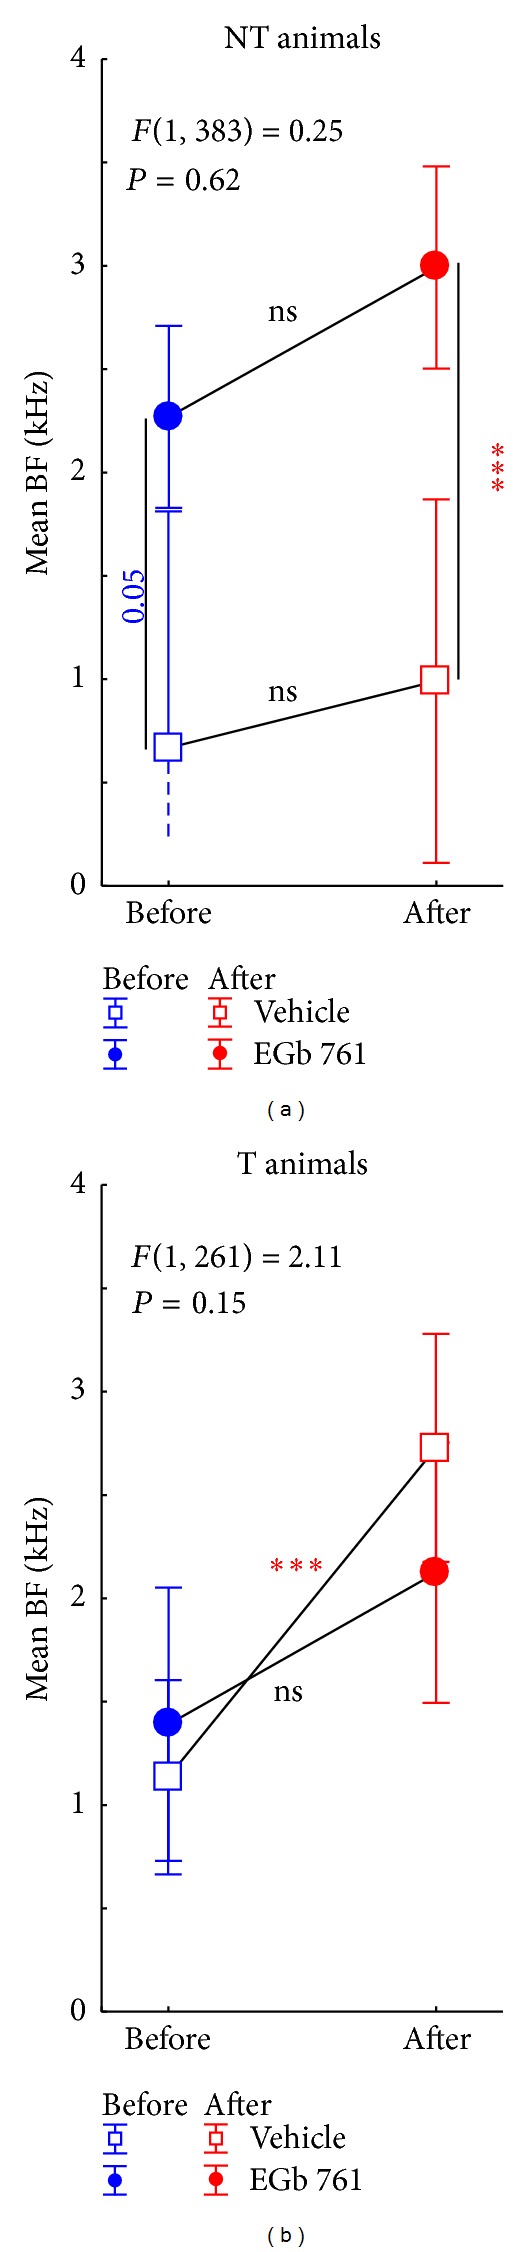
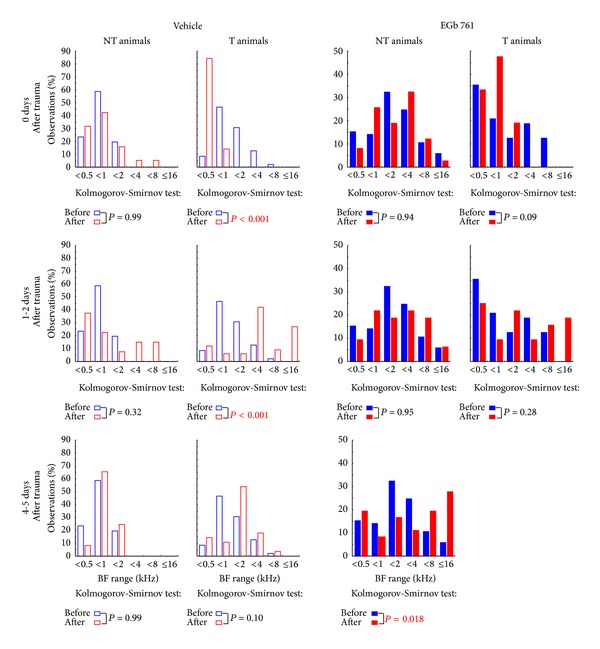
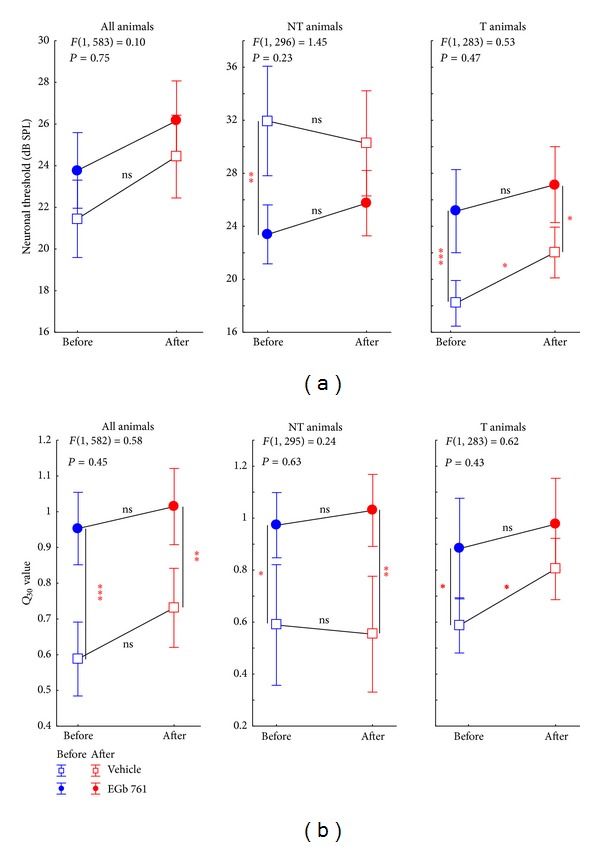
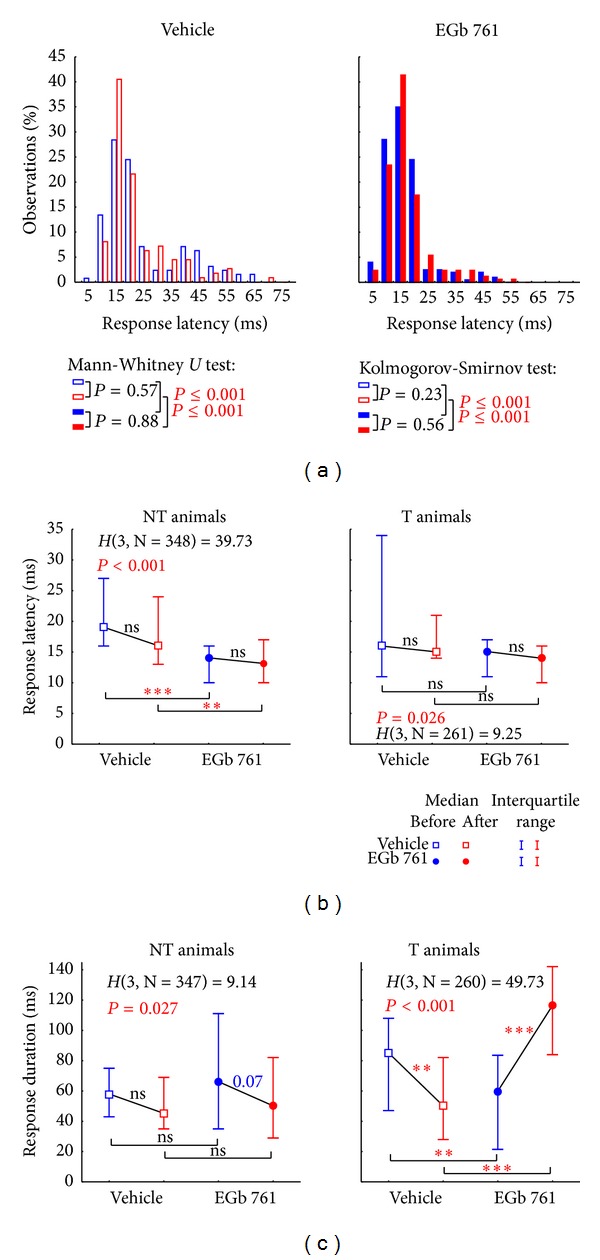
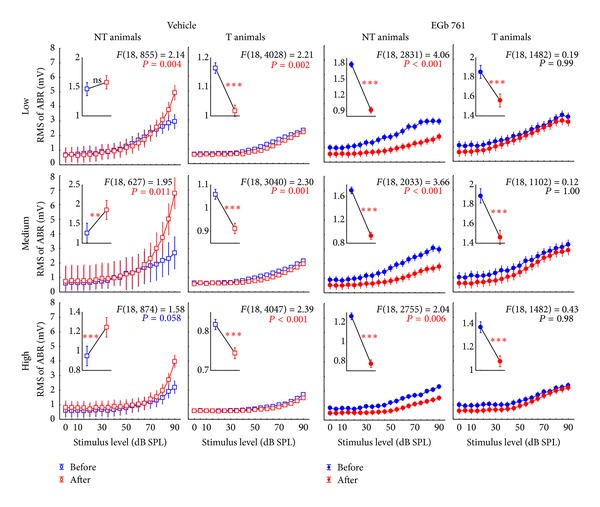
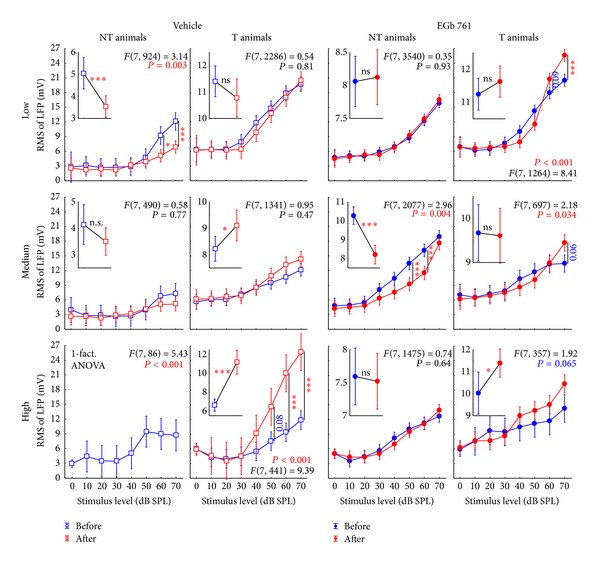
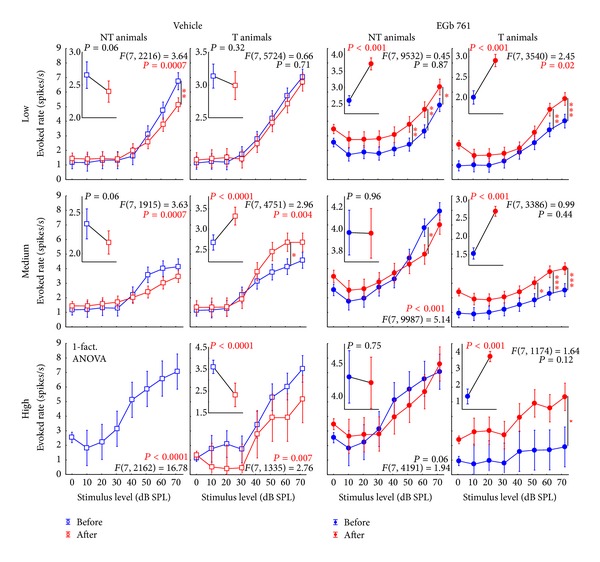
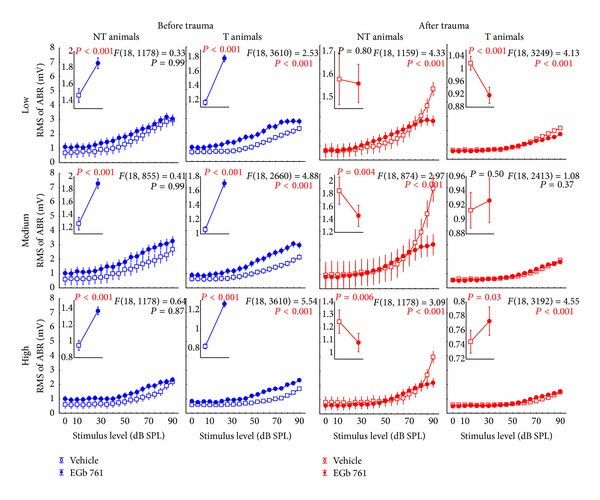
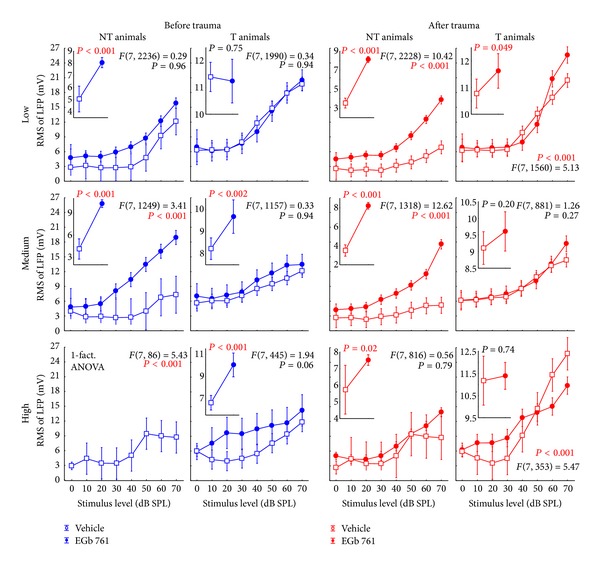
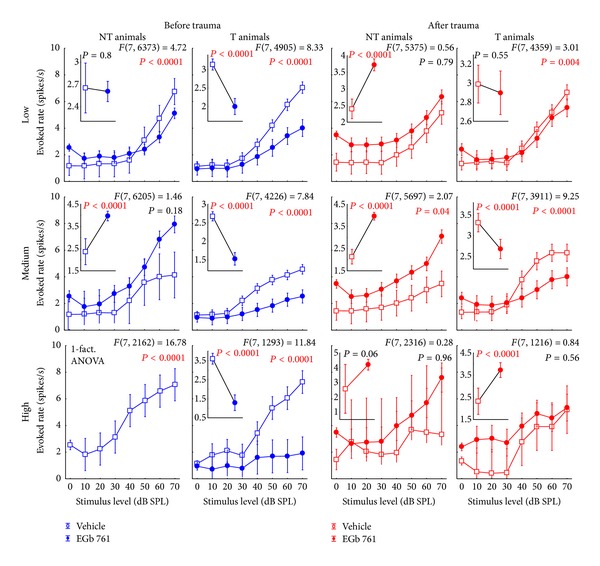
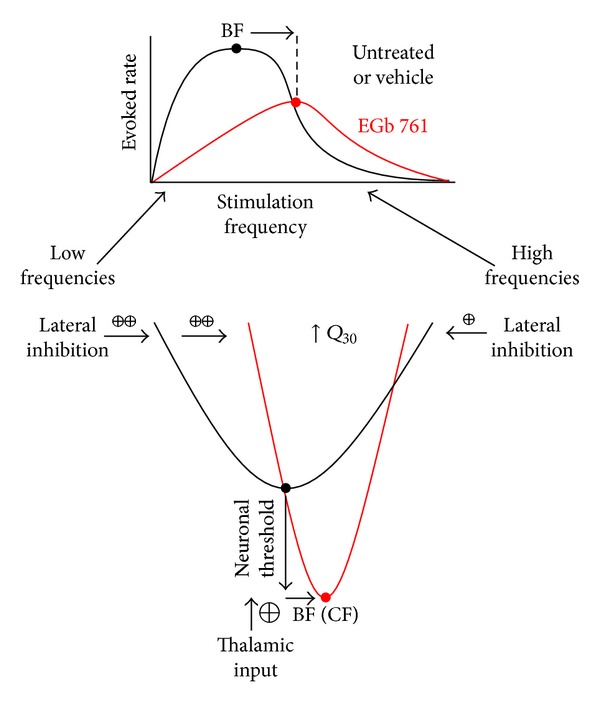
Noise-induced hearing loss (NIHL) and resulting comorbidities like subjective tinnitus are common diseases in modern societies. A substance shown to be effective against NIHL in an animal model is the Ginkgo biloba extract EGb 761. Further effects of the extract on the cellular and systemic levels of the nervous system make it a promising candidate not only for protection against NIHL but also for its secondary comorbidities like tinnitus. Following an earlier study we here tested the potential effectiveness of prophylactic EGb 761 treatment against NIHL and tinnitus development in the Mongolian gerbil. We monitored the effects of EGb 761 and noise trauma-induced changes on signal processing within the auditory system by means of behavioral and electrophysiological approaches. We found significantly reduced NIHL and tinnitus development upon EGb 761 application, compared to vehicle treated animals. These protective effects of EGb 761 were correlated with changes in auditory processing, both at peripheral and central levels. We propose a model with two main effects of EGb 761 on auditory processing, first, an increase of auditory brainstem activity leading to an increased thalamic input to the primary auditory cortex (AI) and second, an asymmetric effect on lateral inhibition in AI.


Figures

Figure 1
Figure 1
Timeline of the experiments. Two weeks prior to trauma (yellow bar) oral application of vehicle or EGb 761 was performed on a daily basis. Pretrauma measurements included behavioral startle responses (turquoise; hearing threshold and gap-noise tinnitus paradigms), ABR measurements (dark green), and electrophysiological recordings in auditory cortex (light green) both under anesthesia. After the acoustic trauma the measurements were repeated within the first seven days after the trauma.
Figure 2
Figure 2
Validation of the hearing threshold ASR paradigm. Given are the mean response amplitudes in mN (±95% confidence interval) for all vehicle treated animals (upper panels) and all EGb 761 treated animals (lower panels) over all prestimulus intensities in dB SPL for the different stimulation frequencies of pre- and startle stimuli. The “pretrauma” (blue) and “posttrauma” (red) data are presented with the corresponding F statistics of the 1-factorial ANOVAs. Note that all statistics were significant, demonstrating that the animals were always (pre- and posttrauma = trauma status) responding to the 90 dB SPL startle stimulus and the different prestimuli.
Figure 3
Figure 3
Hearing threshold and NIHL of all tested animals. (a) Auditory brainstem response (ABR) based audiogram of the healthy animals (before acoustic trauma) of vehicle group (black open squares) and EGb 761 treated group (black solid circles). The left panel documents the mean hearing thresholds with their 95% confidence interval for clicks and all tested tone frequencies with the F-statistics of the interaction of the 2-factorial ANOVA. The center panel depicts the 1-factorial part of the same ANOVA with the factor group (mean values over all tested frequencies and click). Right panels show the same data separated into animals that do not develop a tinnitus percept (upper panel) and those that did show a tinnitus percept after the trauma (lower panel). (b) Acute NIHL, relative to pretrauma in percent (change of ABR threshold relative to pretrauma) of both groups obtained by ABR, measured immediately after trauma at 2 kHz (yellow bar) with their 95% confidence interval. The grey area in the left panel indicates significant hearing loss (single sample t-test versus 0) in both groups (V = vehicle, E = EGb  761), which is also significant if averaged over all tested frequencies and the click stimulus (center panel, asterisks). (c) Hearing loss one day after trauma and (d) 7 days after trauma obtained by auditory startle response audiometry (see Section 2 for details). Note that relative changes of thresholds measured with either ABR or ASR have been demonstrated to be identical [33]. Symbols and abbreviations as above, single sample t-test: ns = not  significant, **P < 0.01, ***P < 0.001.
Figure 4
Figure 4
Results of the gap-noise PPI of the ASR in four exemplary animals. Given are the mean response amplitudes in mN (±standard deviation) for the two noise conditions: without gap (open bars) and with gap (filled bars) before (blue) and after (red) the trauma for all 3 frequencies tested (averaged for both gap noise paradigms). The upper two animals received the vehicle and the lower two animals received the EGb 761 extract before the trauma. All gap conditions produced significantly (t-tests) lower ASR amplitudes before the trauma. In some animals (KS 51 and KS 16) this was also true for the “posttrauma” condition and was a first indication for NT categorization. In other cases (KS 42 and KS 07) gap detection was impaired and did not show any significant change after the trauma at least at some frequencies; this was a first indication of T categorization (cf. Section 2).
Figure 5
Figure 5
Development of tinnitus percept after acoustic trauma at 2 kHz. (a) Mean startle amplitudes in mN (+95% confidence interval) for no-gap (open and solid symbols) and gap condition (gray and shaded filled symbols) of all animals separated by tinnitus development, treatment, and test frequency. 2-factorial ANOVA (only interaction shown) depict the changes in no-gap and gap conditions before and after trauma. Note that even when gap-effects are small on the group level they were always significant in the single animals before trauma. Asterisks indicate significance levels of post hoc Tukey tests: *P < 0.05, **P < 0.01, ***P < 0.001. (b) Change of PPI relative to pretrauma data. Significant positive values of PPI change reflect an impaired PPI, indicating the development of a tinnitus percept. 2-factorial ANOVA indicates that EGb 761 treated animals develop tinnitus percepts at lower frequencies than vehicle treated controls. Asterisks below or above the abscissa indicate significant change of PPI (t-test versus 0): **P < 0.01, ***P < 0.001. (c) Percentage of animals that develop a tinnitus percept after an acoustic trauma at 2 kHz. EGb 761 treated animals show significantly less signs of a tinnitus percept (chi2 test).
Figure 6
Figure 6
Mean evoked neuronal response (±95% confidence interval) to iso-intensity pure tone stimulation across all recorded units in (a) untreated animals from an earlier study [31], (b) vehicle treated animals, and (c) EGb 761-treated animals. Depicted are the mean evoked rates (spikes/s) before (blue) and after (red) acoustic trauma at 2 kHz (yellow bar). For statistical values please refer to Section 3.2.1.
Figure 7
Figure 7
Mean evoked neuronal response (±95% confidence interval) to iso-intensity pure tone stimulation across all recorded units in non-tinnitus and tinnitus perceiving animals. Animals that did not develop a tinnitus percept are grouped in the left column while animals that perceived tinnitus are shown in the right column. Depicted are the mean evoked rates (spikes/s) before (blue) and after (red) acoustic trauma at 2 kHz (yellow bar). (a) Data from untreated animals replotted from an earlier study [31]. 2-factorial ANOVA interaction F statistics: NT: F(13, 1866) = 3.12, P < 0.001; T: F(13, 5952) = 1.54, P = 0.10. (b) Data from vehicle treated animals. 2-factorial ANOVA interaction F-statistics: NT: F(13, 838) = 8.46, P < 0.001; T: F(13, 2772) = 1.42, P = 0.14. Note the similarity between these and the untreated animals in the NT as well as in the T group. (c) Data from EGb 761 treated animals showing clear differences to the other two animal groups. The 2-factorial ANOVA shows strong interaction of time of measurement (before versus after trauma) and stimulation frequency in the T (F(13, 1970) = 5.58, P < 0.001), but not in the NT group (F(13, 4420) = 0.86, P = 0.59).
Figure 8
Figure 8
Effect of noise trauma on mean best frequency (BF) ±95% confidence interval in NT and T animals. Depicted are the statistical interactions of time of measurement (before versus after trauma) and animal group (V versus E) with the F-statistics of the 2-factorial ANOVAs. Asterisks indicate significant Tukey post-hoc-tests levels (ns = not  significant, ***P < 0.001). Note the offset between vehicle and EGb 761 treated animals in the nontinnitus animals' data (a).
Figure 9
Figure 9
Changes in BF frequency distributions over time. Shown are the comparisons of the frequency distributions of BF (observations in %) binned in one octave step of vehicle treated animals (left two columns) and EGb 761-treated animals (right two columns). Treated and untreated animal groups are further subgrouped into NT (first and third column) and T animals (second and fourth column) before the trauma (blue) with the data obtained during 3 different time points windows after trauma (red), from top to bottom: day of trauma, 1 to 2 days after trauma, and 4 to 5 days after trauma. The distributions are tested by Kolmogorov-Smirnov tests corrected for multiple comparisons. Note that we were not able to record from the single animal in the EGb 761 tinnitus group at days 4 to 5.
Figure 10
Figure 10
Trauma and treatment induced changes of neuronal response characteristics in NT and T animals. (a) Statistical interaction (with F-statistics) of time of measurement (before versus after trauma) and animal group (V versus E) with the mean neuronal threshold (±95% confidence interval) averaged across all animals (left panel) or separated into nontinnitus (center panel) and tinnitus animals (right panel). (b) Statistical interaction of time of measurement and animal group on spectral tuning sharpness (Q 30 value) with the same grouping as above. Note that none of the statistical interactions become significant while most data show significant differences between V and E animals in the Tukey post-hoc-tests indicated by the asterisks (ns = not  significant, *P < 0.05, **P < 0.01, ***P < 0.001).
Figure 11
Figure 11
Distributions and Kruskal-Wallis-ANOVAs of neuronal response latency and duration in NT and T animals. (a) Distribution of response latencies (given in % observations binned into 5 ms bins) before (blue) and after (red) trauma in vehicle treated (open symbols) and EGb 761-treated animals (solid symbols) with the median values and interquartile range given above. Additionally, the statistics of the Mann-Whitney U-tests (corrected for multiple comparisons)—testing of median and interquartile range—and the Kolmogorov-Smirnov tests for the testing of the whole distributions against each other are plotted. Note that in both tests only the two pre- and two postdatasets between the groups are significantly different from each other while pre- versus posttrauma data are equal in both animal groups. (b) Median neuronal response latency (in ms ± interquartile range) tested by Kruskal-Wallis-ANOVAs (H-statistics) and multiple comparisons between the subgroups (ns = not  significant, **P < 0.01, ***P < 0.001) separated in nontinnitus and tinnitus perceiving animals treated with vehicle or EGb 761 before and after trauma. (c) Median neuronal response duration (in ms ± interquartile range) was analyzed as above.
Figure 12
Figure 12
Level functions of the auditory brainstem responses (ABR) in NT and T animals grouped for vehicle and EGb 761 treated groups. Given are the mean root mean square (RMS) values of the ABR amplitudes (±95% confidence intervals) as a function of stimulus level before (blue) and after trauma (red) for the four subgroups for low (0.5 to 1.4 kHz), medium (2.0 to 4.0 kHz), and high stimulation frequencies (5.6 to 16.0 kHz). The F-statistics of the 2-factorial ANOVAs are shown for each panel and the corresponding 1-factorial part grouped for time of measurement (pre versus post trauma) is given in each inset (also with the RMS of ABR in mV) with the asterisks indicating the significance level (ns = not  significant, **P < 0.01, ***P < 0.001).
Figure 13
Figure 13
Level functions of the local field potential (LFP) amplitudes in the auditory cortex of NT and T animals grouped into vehicle and EGb 761 treated groups. Presented are the mean RMS values of the LFP amplitudes (±95% confidence intervals) as a function of stimulus level grouped as in Figure 8.
Figure 14
Figure 14
Level functions of the evoked spike rates in the auditory cortex of NT and T animals grouped into vehicle and EGb 761 treated groups. The mean evoked response rates of the auditory neurons in AI (±95% confidence interval) as a function of stimulus level grouped as in Figure 8 are shown.
Figure 15
Figure 15
Replotted data of Figure 8, grouped according to the time of measurement (before versus after trauma) to allow for an easier comparison of vehicle versus EGB 761 treated animals. Note the consistent differences in the ABR amplitudes, especially for pretrauma in vehicle versus EGB 761 treated animals.
Figure 16
Figure 16
Replotted data of Figure 9, grouped according to the time of measurement (before versus after trauma) to allow for an easier comparison of vehicle versus EGB 761 treated animals. Note the consistent differences in the LFP amplitudes, in particular in the NT animals in vehicle versus EGB 761 treated groups.
Figure 17
Figure 17
Replotted data of Figure 10, grouped according to the time of measurement (before versus after trauma) to allow for an easier comparison of vehicle versus EGB 761 treated animals.
Figure 18
Figure 18
Proposed model of the effects of EGb 761 treatment on auditory processing. Upper panel: evoked neuronal response rate in AI for iso-intensity pure tone stimuli in vehicle (black) and EGb 761 treated animals (red). Lower panel: neuronal threshold and tuning of cortical neurons in both animal groups. Based on our data, we propose two main effects of EGb 761 on auditory processing: first, an increase of auditory brainstem activity leading to an increased thalamic input to AI, which results in lower response thresholds and shorter response latencies, and second, an asymmetric effect on lateral inhibition in AI that reduces overall response rates, shifts the best frequency (BF) to higher values, and sharpens spectral tuning (Q 30-values).

Similar articles

Cited by

References

    1. Passchier-Vermeer W, Passchier WF. Noise exposure and public health. Environmental Health Perspectives. 2000;108(supplement 1):123–131. - PMC - PubMed
    1. Ruben RJ. Redefining the survival of the fittest: communication disorders in the 21st century. Laryngoscope. 2000;110(2):241–245. - PubMed
    1. Streppel M, Walger M, von Wedel H, Gaber E. Gesundheitsberichterstattung des Bundes, Statistisches Bundesamt. Heft 29 2006. Hörstörungen und Tinnitus.
    1. Harrison RV. The prevention of noise induced hearing loss in children. International Journal of Pediatrics. 2012;2012:13 pages.473541 - PMC - PubMed
    1. Katzenell U, Segal S. Hyperacusis: review and clinical guidelines. Otology and Neurotology. 2001;22(3):321–326. - PubMed

Publication types

MeSH terms

LinkOut - more resources