. 2014 Jul 15;107(2):411-421.
doi: 10.1016/j.bpj.2014.06.002.

Investigating the structural impact of the glutamine repeat in huntingtin assembly

Affiliations

Investigating the structural impact of the glutamine repeat in huntingtin assembly

Tatiana Perevozchikova et al. Biophys J. .

Abstract

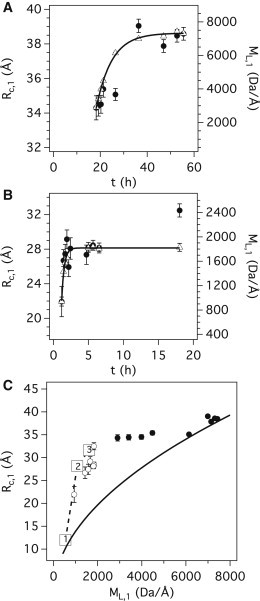
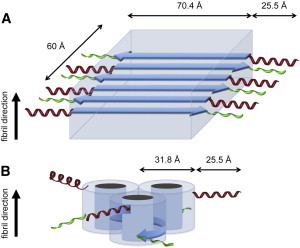
Acquiring detailed structural information about the various aggregation states of the huntingtin-exon1 protein (Htt-exon1) is crucial not only for identifying the true nature of the neurotoxic species responsible for Huntington's disease (HD) but also for designing effective therapeutics. Using time-resolved small-angle neutron scattering (TR-SANS), we followed the conformational changes that occurred during fibrillization of the pathologic form of Htt-exon1 (NtQ42P10) and compared the results with those obtained for the wild-type (NtQ22P10). Our results show that the aggregation pathway of NtQ22P10 is very different from that of NtQ42P10, as the initial steps require a monomer to 7-mer transition stage. In contrast, the earliest species identified for NtQ42P10 are monomer and dimer. The divergent pathways ultimately result in NtQ22P10 fibrils that possess a packing arrangement consistent with the common amyloid sterical zipper model, whereas NtQ42P10 fibrils present a better fit to the Perutz β-helix structural model. The structural details obtained by TR-SANS should help to delineate the key mechanisms that underpin Htt-exon1 aggregation leading to HD.


Figures

Figure 1
Figure 1
SANS on NtQ42P10 fibrils (89 μM peptide concentration) and fit (solid line) using Eq. 5. The q−3 power law contribution to the fit is also shown (dashed line). Error bars: standard errors (SEs) from the radial average of the intensity data on the neutron area detector.
Figure 2
Figure 2
Time-resolved SANS profiles of NtQ42P10 (108 μM) showing the collected time points (bottom to top): 0.43, 0.68, 0.93, 1.18, 1.43, 1.68, 1.93, 2.18, 2.43, 4.71, 4.98, 5.66, 6.53, and 18.04 h. The bottom curve is on absolute intensity scale (cm−1) and the subsequent curves are shifted up in decade increments for clarity. All fits (solid lines) are with Eq. 5. Time points showing three-dimensional scattering (s1 = 0) are denoted (). Error bars: SEs from the radial average of the intensity data on the neutron area detector.
Figure 3
Figure 3
Time-resolved SANS profiles of NtQ22P10 (150 μM) showing the collected time points (bottom to top): 0–2 h, 0–8 h, 12.7, 18.2, 19.2, 20.3, 21.3, 26.5, 36.4, 47, 52.3, and 55.5 h. The bottom curve is on absolute intensity scale (cm−1) and the subsequent curves are shifted up in decade increments for clarity. Fits (solid lines) are with the multiple Guinier-Porod model for 0–2 h, 0–8 h, and 12.7 h time points, and with the single Guinier-Porod model for time points 18.2 h and beyond. Time points showing three-dimensional scattering (s1 = 0 and s2 = 0) are denoted (). Error bars: SEs from the radial average of the intensity data on the neutron area detector.
Figure 4
Figure 4
(A) Aggregation kinetics of NtQ22P10 (130 μM, 1× PBS D2O) monitored by the decrease in monomer concentration with an exponential fit (solid line) and (B) increase in normalized ThT fluorescence signal with an exponential fit (solid line). The initial kinetics (inset) for ThT intensity (solid circles) and 100 – (% monomer) (open triangles) are shown for clarity and comparison. (C) TEM image of the mature fibrils formed by NtQ22P10 (150 μM, 1× PBS D2O).
Figure 5
Figure 5
Fibril growth monitored by time-resolved SANS. (A) Time-dependent changes in NtQ22P10Rc,1 (solid circles, left axis) and ML,1 (open triangles, right axis). An exponential fit with a time offset was applied to the ML,1 data (solid line). (B) Time-dependent changes in NtQ42P10Rc,1 (solid circles, left axis) and ML,1 (open triangles, right axis). Similarly to our prior analysis (17), ML,1 for time points 2.18, 2.43, and 4.71 h were omitted due to sample sedimentation affecting the values. An exponential fit with a time offset was applied to the ML,1 data (solid line). (C) Plot of Rc,1 versus ML,1 measured beyond 17 h for NtQ22P10 (solid circles) and beyond 1 h for NtQ42P10 (open circles). Also shown are the model calculations for a solid cylinder cross section (solid line) and the Perutz hollow cylinder β-helix cross section (dashed line) for one, two, and three filaments per fibril (open squares) as previously reported (17). Errors bars: SEs from the corresponding model fits.
Figure 6
Figure 6
Normalized two-dimensional pair-distance distribution functions, Pc(r), obtained for the mature fibrils of NtQ22P10 (gray line) and NtQ42P10 (black line).
Figure 7
Figure 7
(A) Visualization of the NtQ22P10 fibril cross section based on the constraints provided by the SANS data. The NtQ22P10 fibril has approximately six peptides per 4.75 Å β-sheet repeat, with the Q22 region (β-strands represented by arrows) forming the core and the 17 N-terminal (represented as α-helices) and P10 (represented as type II polyproline helices) regions on the exterior. The dimensions of the Q22 core and length of the 17 N-terminal α-helix are given. (B) Visualization of the NtQ42P10 fibril cross section, where NtQ42P10 has ∼1–1.5 peptides per 4.75 Å β-sheet repeat. The Q42 region forms a β-helix (represented by the arrow) within a single filament, and the 17 N-terminal (represented as α-helices) and P10 (represented as type II polyproline helices) regions reside on the periphery of the filaments. The fibril is composed of two to three filaments, with three filaments displayed in the schematic. The dimensions of the β-helical filament outer diameter and length of the 17 N-terminal α-helix are given.

References

    1. MacDonald M.E., Ambrose C.M., Duyao M.P., Myers R.H., Lin C., The Huntington’s Disease Collaborative Research Group A novel gene containing a trinucleotide repeat that is expanded and unstable on Huntington’s disease chromosomes. Cell. 1993;72:971–983. - PubMed
    1. Sawa A., Nagata E., Snyder S.H. Huntingtin is cleaved by caspases in the cytoplasm and translocated to the nucleus via perinuclear sites in Huntington’s disease patient lymphoblasts. Neurobiol. Dis. 2005;20:267–274. - PubMed
    1. Graham R.K., Deng Y., Hayden M.R. Cleavage at the caspase-6 site is required for neuronal dysfunction and degeneration due to mutant huntingtin. Cell. 2006;125:1179–1191. - PubMed
    1. Darnell G., Orgel J.P.R.O., Meredith S.C. Flanking polyproline sequences inhibit β-sheet structure in polyglutamine segments by inducing PPII-like helix structure. J. Mol. Biol. 2007;374:688–704. - PubMed
    1. Kim M.W., Chelliah Y., Bezprozvanny I. Secondary structure of Huntingtin amino-terminal region. Structure. 2009;17:1205–1212. - PMC - PubMed

Publication types

LinkOut - more resources