. 2014 Sep;11(9):959-65.
doi: 10.1038/nmeth.3029. Epub 2014 Jul 13.

RNA motif discovery by SHAPE and mutational profiling (SHAPE-MaP)

Affiliations

RNA motif discovery by SHAPE and mutational profiling (SHAPE-MaP)

Nathan A Siegfried et al. Nat Methods. 2014 Sep.

Abstract

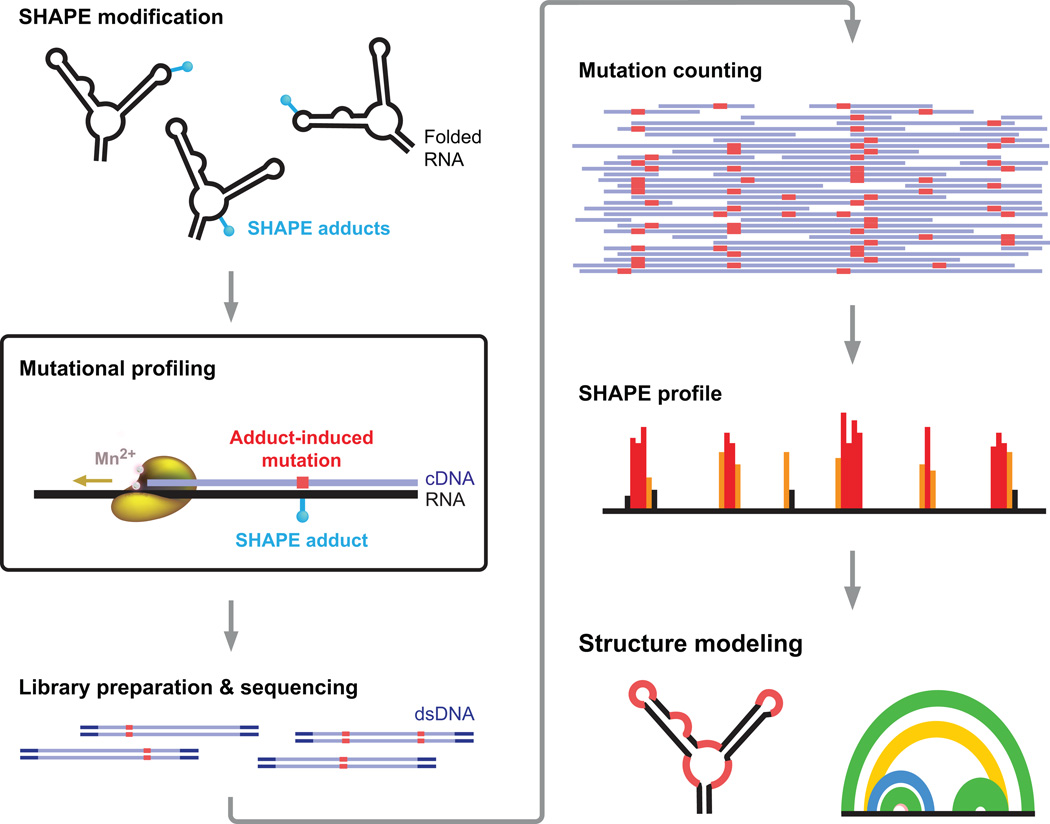
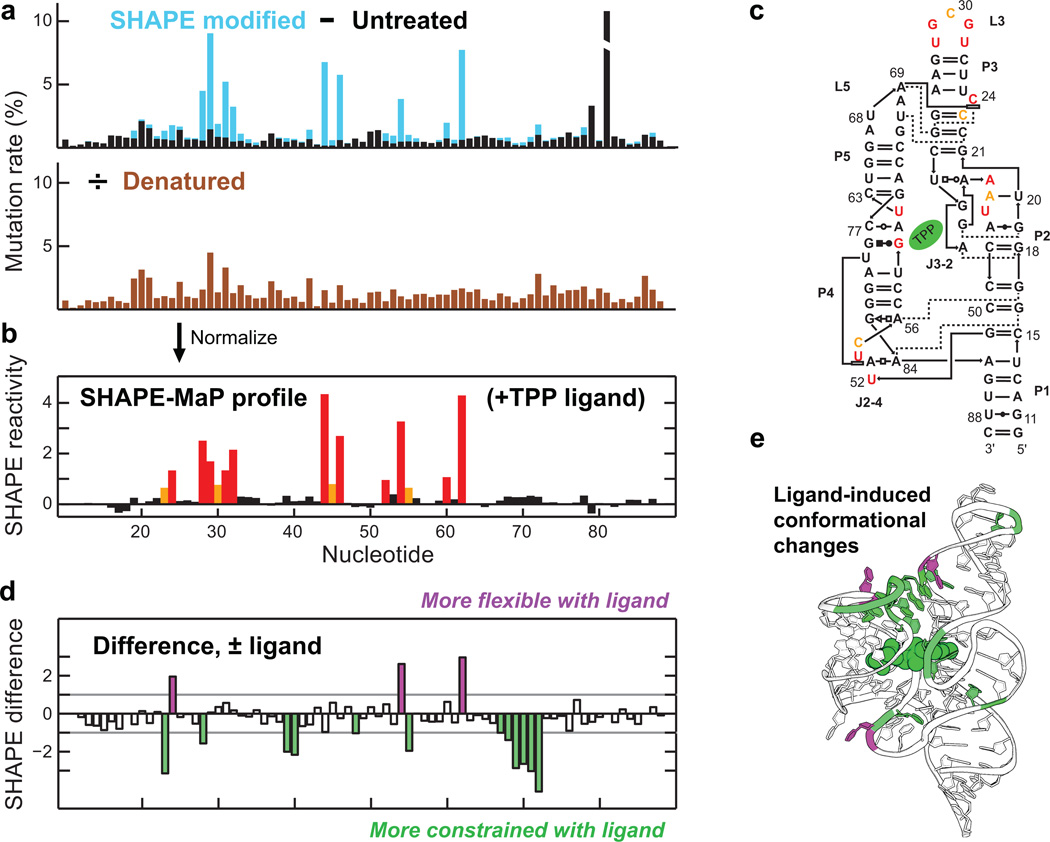
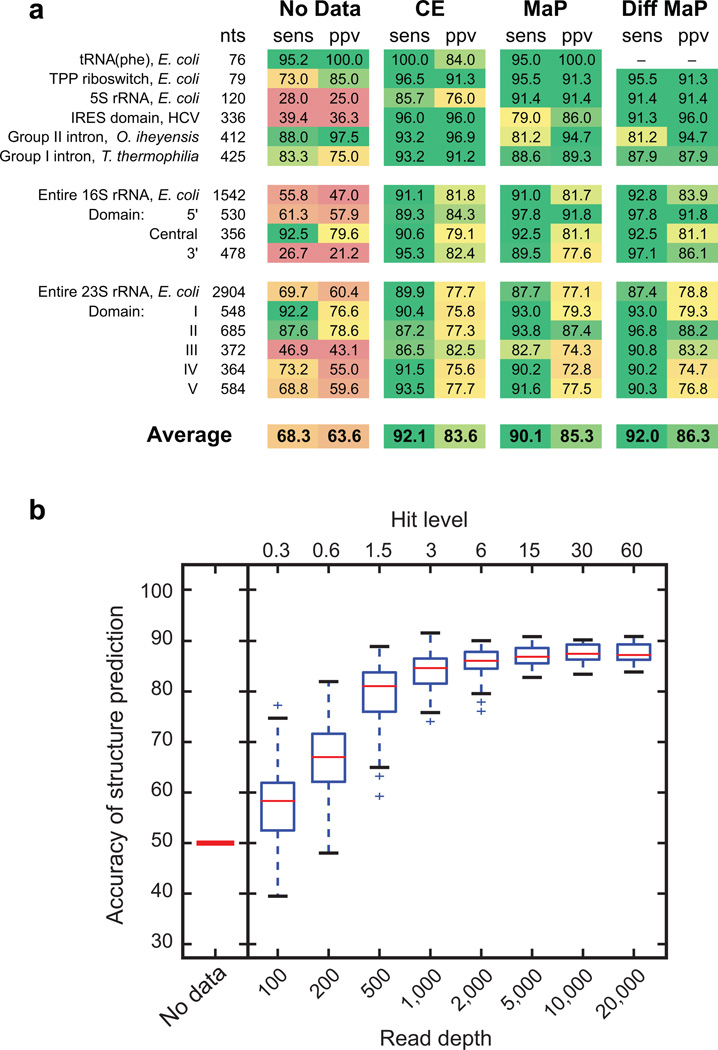
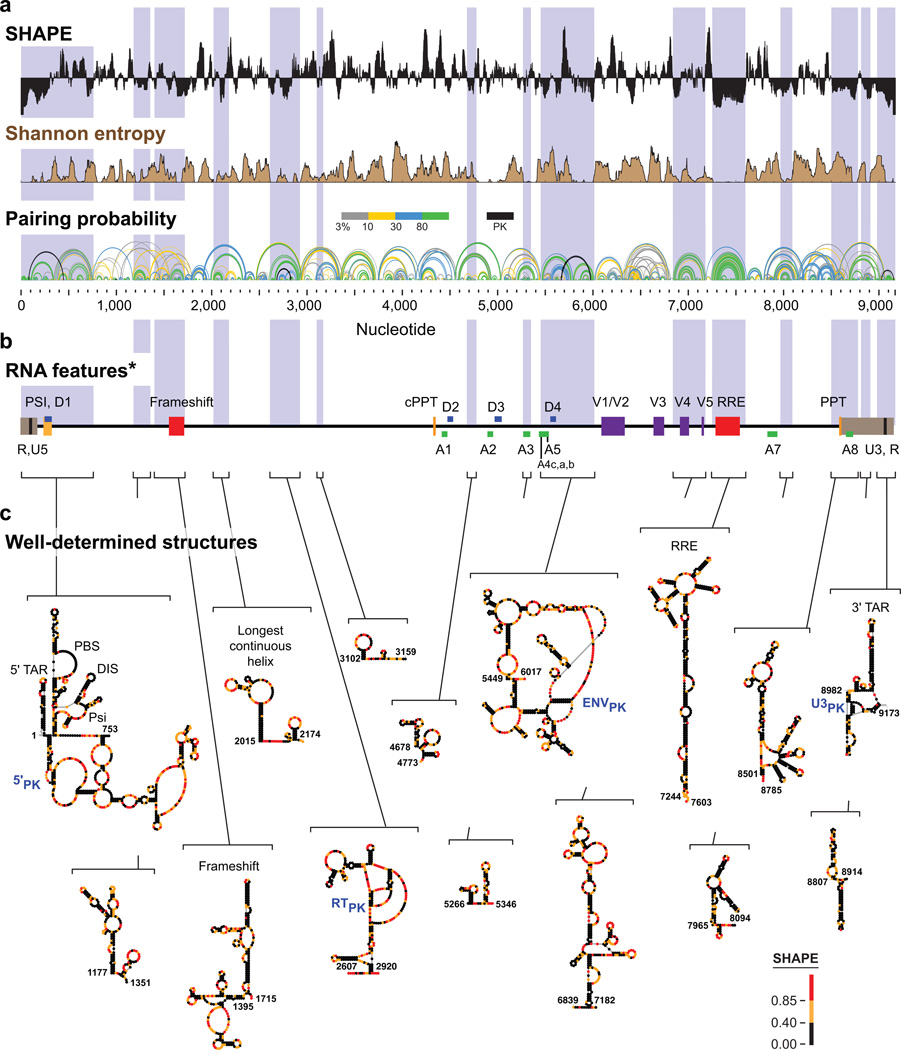
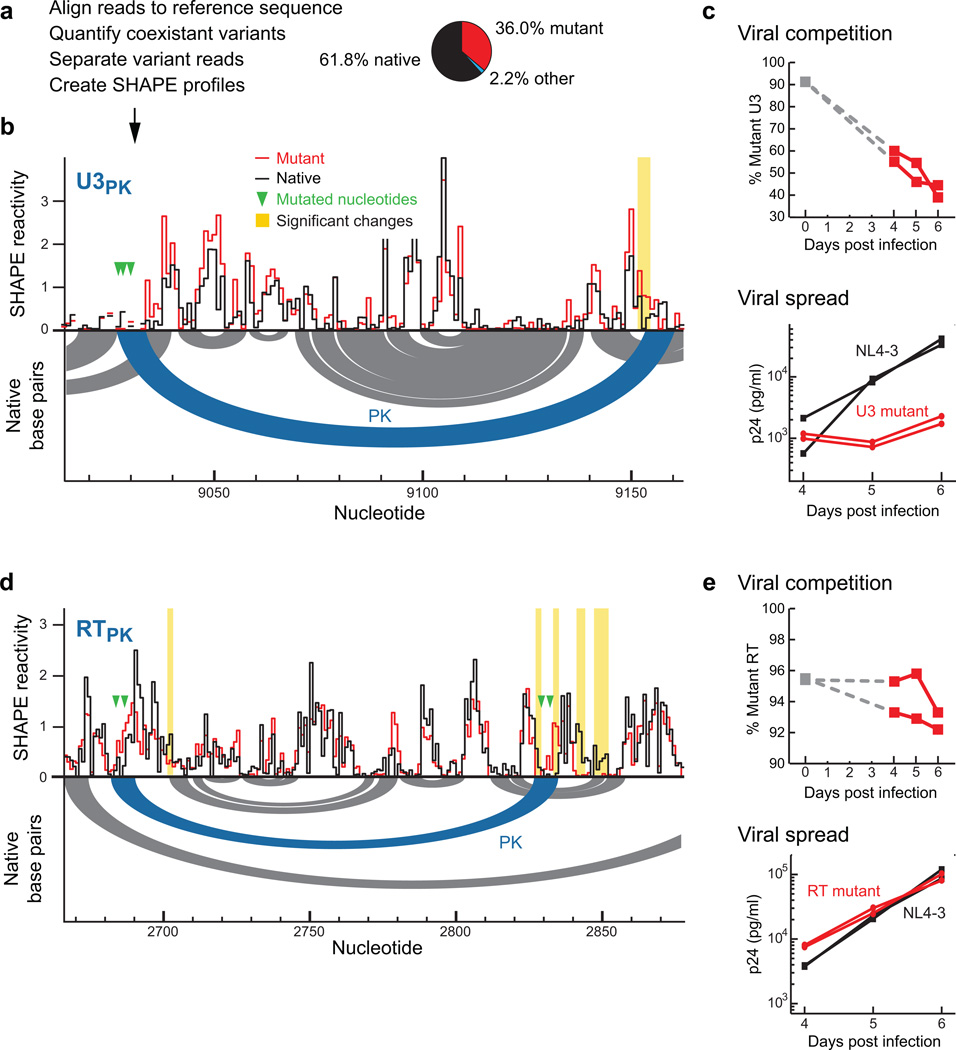
Many biological processes are RNA-mediated, but higher-order structures for most RNAs are unknown, which makes it difficult to understand how RNA structure governs function. Here we describe selective 2'-hydroxyl acylation analyzed by primer extension and mutational profiling (SHAPE-MaP) that makes possible de novo and large-scale identification of RNA functional motifs. Sites of 2'-hydroxyl acylation by SHAPE are encoded as noncomplementary nucleotides during cDNA synthesis, as measured by massively parallel sequencing. SHAPE-MaP-guided modeling identified greater than 90% of accepted base pairs in complex RNAs of known structure, and we used it to define a new model for the HIV-1 RNA genome. The HIV-1 model contains all known structured motifs and previously unknown elements, including experimentally validated pseudoknots. SHAPE-MaP yields accurate and high-resolution secondary-structure models, enables analysis of low-abundance RNAs, disentangles sequence polymorphisms in single experiments and will ultimately democratize RNA-structure analysis.


Figures

Figure 1
Figure 1. SHAPE-MaP Overview
RNA is treated with a SHAPE reagent that reacts at conformationally dynamic nucleotides. Reverse transcription is carried out under conditions such that the polymerase reads through chemical adducts in the RNA and incorporates a nucleotide non-complementary to the original sequence (in red) into the cDNA. The resulting cDNA is sequenced using any massively parallel approach to create mutational profiles (MaP). Sequencing reads are aligned to a reference sequence, and nucleotide-resolution mutation rates are calculated, corrected for background and normalized, producing a standard SHAPE reactivity profile. SHAPE reactivities can then be used to model secondary structures, visualize competing and alternative structures, or quantify any process or function that modulates local nucleotide RNA dynamics.
Figure 2
Figure 2. Nucleotide-resolution interrogation of RNA structure and ligand-induced conformational changes
(a) Mutation rate profiles for the SHAPE modified and untreated TPP riboswitch RNA in the presence of ligand (top) and for SHAPE modification performed under denaturing conditions (bottom). (b) Quantitative SHAPE profile obtained after subtracting the data from the untreated sample from data for the treated sample and normalizing by the denatured control. (c) SHAPE reactivities plotted on the accepted secondary structure of the ligand-bound TPP riboswitch. Red, orange, and black correspond to high, moderate, and low reactivities, respectively. (d) Difference SHAPE profile showing conformational changes in the TPP riboswitch upon ligand binding. (e) Superposition of ligand-induced conformational changes on the TPP riboswitch structure.
Figure 3
Figure 3. Accuracy of SHAPE-MaP-directed secondary structure modeling
(a) Secondary structure modeling accuracies reported as a function of sensitivity (sens) and positive predictive value (ppv) for calculations performed without experimental constraints, with conventional capillary electrophoresis (CE) data, and with SHAPE-MaP data obtained with the 1M7 reagent, or with three-reagent differential (Diff) data. Results are colored on a scale to reflect low (red) to high (green) modeling accuracy. (b) Relationship between sequencing read depth, hit level, and accuracy of RNA structure modeling. Structure prediction accuracy (vertical axis) is shown as the geometric average of the sens and ppv of predicted structures with respect to the accepted model. For the 16S rRNA, this accuracy ranges from 50% in the absence of experimental data to 89% for single-reagent SHAPE (shown), and to 91% for the three-reagent “differential” experiment. Boxplots summarize modeling the secondary structure of the 16S ribosomal RNA as a function of simulated SHAPE-MaP read depth. At each depth, 100 folding trajectories were sampled. The line at the center of the box indicates the median value and boxes indicate the interquartile range. Whiskers contain data points that are within 1.5 times the interquartile range and outliers are indicated with (+) marks. Hit level is the total signal above normalized background per transcript nucleotide.
Figure 4
Figure 4. SHAPE-MaP analysis of the HIV-1 NL4-3 genome
(a) SHAPE reactivities for the NL4-3 HIV-1 genomic RNA. Reactivities are shown as the centered 55-nt median window, relative to the global median; regions above or below the line are more flexible or constrained than the median, respectively. Shannon entropy values for 55-nt windows were calculated by considering the pairing probability of a nucleotide over all structures in a 1M7 and differential SHAPE reactivity data-constrained Boltzmann ensemble and reflect how well determined the secondary structure model is for each nucleotide region. Arcs representing base pairs are colored by their respective pairing probabilities, with green arcs indicating highly probable helices. Areas with many overlapping arcs have multiple potential structures. Pseudoknots (PK) are indicated by black arcs. (b) RNA regions identified as having biological functions. Brackets enclose well-determined regions and are drawn to emphasize locations of these regions relative to known RNA features in the context of the viral genome. Regions correspond to low SHAPE-low Shannon entropy domains and are extended to include all intersecting helices from the lowest predicted free-energy secondary structure. 5’ and 3’ UTRs are brown; splice acceptors and donors are green and blue, respectively; polypurine tracts are yellow; variable domains are purple; and the frameshift and RRE domains are red. These elements fall within regions with low SHAPE and low Shannon entropy much more frequently than expected by chance (p = 0.002; see Online Methods). (c) Secondary structure models for regions, identified de novo, with low SHAPE reactivities and low Shannon entropies. Nucleotides are colored by SHAPE reactivity and pseudoknotted structures are labeled in blue. Larger figure images, showing nucleotide identities, are provided in Supplementary Fig. 7.
Figure 5
Figure 5. Functional and structural validation of newly discovered HIV-1 RNA motifs
(a) Scheme for simultaneous deconvolution and structural analysis of a mixture of native sequence and U3PK mutant genomes.(b) SHAPE profiles for the U3PK pseudoknot bridging U3 and R. The experiment simultaneously probed a mixture of viruses with native sequence and mutant U3PK RNAs. Secondary structure for the native sequence is shown as arcs below the y-axis intercept. Significant SHAPE reactivity differences are emphasized with yellow vertical lines (see Online Methods). (c) Direct growth competition and viral spread for U3PK mutant and native sequence NL4-3 HIV-1 virions in Jurkat cells. Percentage of mutant in the initial inoculum is presented as a grey square at day 0. p24 levels correspond to the amount of HIV-1 capsid protein. (d) SHAPE profiles for the RTPK pseudoknot within the reverse transcriptase coding region. In this case, SHAPE data were obtained in separate experiments for each virus. (e) Viral spread and direct growth competition for RTPK mutant and native sequence NL4-3 HIV-1 virions in Jurkat cells. For the competition data, y-axes are shown on an expanded scale for clarity.

References

    1. Sharp PA. The centrality of RNA. Cell. 2009;136:577–580. - PubMed
    1. Dethoff EA, Chugh J, Mustoe AM, Al-Hashimi HM. Functional complexity and regulation through RNA dynamics. Nature. 2012;482:322–330. - PMC - PubMed
    1. Weeks KM. Advances in RNA structure analysis by chemical probing. Curr. Opin. Struct. Biol. 2010;20:295–304. - PMC - PubMed
    1. Mathews DH, et al. Incorporating chemical modification constraints into a dynamic programming algorithm for prediction of RNA secondary structure. Proc. Natl. Acad. Sci. 2004;101:7287–7292. - PMC - PubMed
    1. Kertesz M, et al. Genome-wide measurement of RNA secondary structure in yeast. Nature. 2010;467:103–107. - PMC - PubMed

Methods References

    1. Lorsch JR, Bartel DP, Szostak JW. Reverse transcriptase reads through a 2′-5′ linkage and a 2′-thiphosphate in a template. Nucleic Acids Res. 1995;23:2811–2814. - PMC - PubMed
    1. Patterson JT, Nickens DG, Burke DH. HIV-1 reverse transcriptase pausing at bulky 2’adducts is relieved by deletion of the RNase H domain. RNA Biol. 2006;3:163. - PubMed
    1. Matathias A, Fox D, Crouse J. SuperScript II RNase H reverse transcriptase. 18064-3. Focus On, Life Technologies; 1999.
    1. Beckman RA, Mildvan AS, Loeb LA. On the fidelity of DNA replication: manganese mutagenesis in vitro. Biochemistry. 1985;24:5810–5817. - PubMed
    1. Wilkinson KA, Merino EJ, Weeks KM. Selective 2′-hydroxyl acylation analyzed by primer extension (SHAPE): quantitative RNA structure analysis at single nucleotide resolution. Nat. Protoc. 2006;1:1610–1616. - PubMed

Publication types

Associated data