. 2015 Feb;52(2):217-31.
doi: 10.1165/rcmb.2013-0310OC.

A novel genomic signature with translational significance for human idiopathic pulmonary fibrosis

Affiliations

A novel genomic signature with translational significance for human idiopathic pulmonary fibrosis

Yasmina Bauer et al. Am J Respir Cell Mol Biol. 2015 Feb.

Abstract

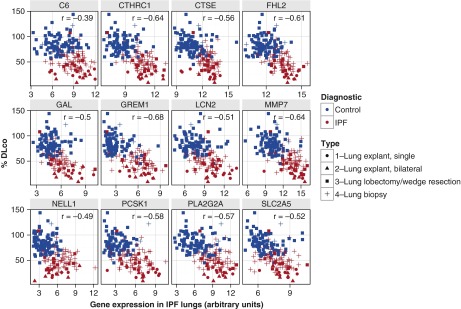
The bleomycin-induced rodent lung fibrosis model is commonly used to study mechanisms of lung fibrosis and to test potential therapeutic interventions, despite the well recognized dissimilarities to human idiopathic pulmonary fibrosis (IPF). Therefore, in this study, we sought to identify genomic commonalities between the gene expression profiles from 100 IPF lungs and 108 control lungs that were obtained from the Lung Tissue Research Consortium, and rat lungs harvested at Days 3, 7, 14, 21, 28, 42, and 56 after bleomycin instillation. Surprisingly, the highest gene expression similarity between bleomycin-treated rat and IPF lungs was observed at Day 7. At this point of maximal rat-human commonality, we identified a novel set of 12 disease-relevant translational gene markers (C6, CTHRC1, CTSE, FHL2, GAL, GREM1, LCN2, MMP7, NELL1, PCSK1, PLA2G2A, and SLC2A5) that was able to separate almost all patients with IPF from control subjects in our cohort and in two additional IPF/control cohorts (GSE10667 and GSE24206). Furthermore, in combination with diffusing capacity of carbon monoxide measurements, four members of the translational gene marker set contributed to stratify patients with IPF according to disease severity. Significantly, pirfenidone attenuated the expression change of one (CTHRC1) translational gene marker in the bleomycin-induced lung fibrosis model, in transforming growth factor-β1-treated primary human lung fibroblasts and transforming growth factor-β1-treated human epithelial A549 cells. Our results suggest that a strategy focused on rodent model-human disease commonalities may identify genes that could be used to predict the pharmacological impact of therapeutic interventions, and thus facilitate the development of novel treatments for this devastating lung disease.

Keywords: animal model; biomarkers; genomics; lung fibrosis.


Figures

Figure 1.
Figure 1.
Gene expression analysis of bleomycin-induced rat lung samples segregate different temporal phases in the development of lung fibrosis. (A) The first two principal components (PC1 and PC2) of this principal component analysis (PCA) account for more than 60% of the total variance, and are used to visualize relative animal positions in the gene expression–defined space throughout the time course experiment. (B) Ingenuity pathway analysis identified different response phases after bleomycin administration. The number of differentially expressed genes with known biological activity (inflammatory disease and connective tissue disorder) is indicated (y axis) for each time point after bleomycin administration (x axis). The top 20 dysregulated genes are indicated for each response phase peak (Days 3 and 14).
Figure 2.
Figure 2.
Scatter plot showing differentially expressed genes of the bleomycin-treated rat lung fibrosis model at Day 7 and patients with idiopathic pulmonary fibrosis (IPF). (A) x and y axis represent the log2 fold gene expression change in IPF and bleomycin-treated rats against their respective controls. The red lines represent the positive correlation between the bleomycin-treated rat and IPF. The black lines represent no expression change in either bleomycin-treated rat or IPF. The genes that are labeled in red displayed the most similar fold differential expression in bleomycin-treated rats and IPF. Genes with significant expression changes in IPF, but no change in bleomycin-treated rats, are indicated in dark blue. Genes with unique change in bleomycin-treated rats, but no change in IPF, are indicated in green. (B) A detailed view of the upper right quadrant of (A), indicating highly conserved, up-regulated genes in bleomycin-treated rat and IPF. Among the most significantly up-regulated genes were Mmp7/MMP7, Pla2 g2a/PLA2G2A, C6/C6, Lcn2/LCN2, and Cthrc1/CTHRC1, as indicated.
Figure 3.
Figure 3.
PCA of IPF and human control using the bleomycin-treated rat genomic signature at Day 7. (A) The first two PCs separate the control subjects (light blue) from the patients with IPF (green). Based on the rat genomic signature, some of the control subjects were identified as patients with IPF (red) and, similarly, some of the patients with IPF behaved like the control subjects (dark blue). (B) Gene identities that support the separation of IPF and control as shown in A. (C) The minimal translational gene subset from B that can be used in a PCA (D) to differentiate the IPF from the control subjects.
Figure 4.
Figure 4.
Expression levels of the translational gene subset with quantitative RT-PCR (QPCR) confirmed differential expression in the bleomycin-treated rat model at Day 7. The y axis shows the log2 of gene expression. The box-plot representation shows the median value (center line), the lower and upper limits of each box depicting the first and third quartiles, respectively. The whiskers represent smallest and largest data points. The statistical significance (P values using t test) between vehicle (VEH) and bleomycin treatment (BLEO) are indicated. Differences are considered significant at: ****P < 0.0001; ***P < 0.001; **P < 0.01; *P < 0.01. ns, not significant.
Figure 5.
Figure 5.
Gene expression changes of MMP7, FHL2, GREM1, and CTHRC1 and percent diffusing capacity of carbon monoxide (%DlCO) segregate patients according to disease severity. Expression levels of the 12 translational genes exhibit a negative Pearson correlation coefficient with the %DlCO. The patients are classified according to the tissue type (category 1, patients with IPF that received transplantation of a single lung [lung explant single]; category 2, both lungs [lung explants bilateral]; category 3, lobectomy/wedge resection; and category 4, biopsy).
Figure 6.
Figure 6.
Expression levels of the set of 12 translational genes in the bleomycin rats at Day 14 with and without pirfenidone treatment, as measured by QPCR. The y axis shows the log2 of gene expression. The box-plot representation shows the median value (center line), the lower and upper limits of each box depicting the first and third quartiles, respectively. The whiskers represent smallest and largest data points. The differences between vehicle and bleomycin and bleomycin with and without pirfenidone (BLEO+P and BLEO) are considered significant at: ****P < 0.0001; ***P < 0.001; **P < 0.01; *P < 0.01. ns, not significant.
Figure 7.
Figure 7.
Relative gene expression levels in transforming growth factor (TGF)-β1–stimulated normal primary human lung fibroblasts (NHLFs) and A549 cells and influence of pirfenidone. The box-plot representation shows the median value of log2 of gene expression (center line), the lower and upper limits of each box depicting the first and third quartiles, respectively. The whiskers represent smallest and largest data points. NHLFs or A549 cells were incubated with vehicle (VEH), TGF-β1 (TGFB), TGF-β1 with pirfenidone (TGFB + PIRF), or pirfenidone alone (PIRF), and gene expression changes were quantified using QPCR after 6 hours. Genes with expression levels that were significantly up-regulated by TGF-β1 and attenuated by pirfenidone are shown in NHLFs (A) and A549 cells (BD). The differences between conditions are considered significant at: ****P < 0.0001; ***P < 0.001; **P < 0.01; *P < 0.01 (n = 4), as indicated. ns, not significant.

Comment in

References

    1. Meltzer EB, Noble PW. Idiopathic pulmonary fibrosis. Orphanet J Rare Dis. 2008;3:8. - PMC - PubMed
    1. Olson AL, Swigris JJ, Lezotte DC, Norris JM, Wilson CG, Brown KK. Mortality from pulmonary fibrosis increased in the United States from 1992 to 2003. Am J Respir Crit Care Med. 2007;176:277–284. - PubMed
    1. Raghu G, Collard HR, Egan JJ, Martinez FJ, Behr J, Brown KK, Colby TV, Cordier J-F, Flaherty KR, Lasky JA, et al. An official ATS/ERS/JRS/ALAT statement: idiopathic pulmonary fibrosis: evidence-based guidelines for diagnosis and management. Am J Respir Crit Care Med. 2011;183:788–824. - PMC - PubMed
    1. Borchers AT, Chang C, Keen CL, Gershwin ME. Idiopathic pulmonary fibrosis—an epidemiological and pathological review. Clin Rev Allergy Immunol. 2010;40:117–134. - PubMed
    1. Wynn TA, Ramalingam TR. Mechanisms of fibrosis: therapeutic translation for fibrotic disease. Nat Med. 2012;18:1028–1040. - PMC - PubMed

Publication types