. 2014 Aug 15;190(4):421-32.
doi: 10.1164/rccm.201404-0670OC.

A functional anatomic defect of the cystic fibrosis airway

Affiliations

A functional anatomic defect of the cystic fibrosis airway

Susan E Birket et al. Am J Respir Crit Care Med. .

Abstract

Rationale: The mechanisms underlying cystic fibrosis (CF) lung disease pathogenesis are unknown.

Objectives: To establish mechanisms linking anion transport with the functional microanatomy, we evaluated normal and CF piglet trachea as well as adult swine trachea in the presence of selective anion inhibitors.

Methods: We investigated airway functional microanatomy using microoptical coherence tomography, a new imaging modality that concurrently quantifies multiple functional parameters of airway epithelium in a colocalized fashion.

Measurements and main results: Tracheal explants from wild-type swine demonstrated a direct link between periciliary liquid (PCL) hydration and mucociliary transport (MCT) rates, a relationship frequently invoked but never experimentally confirmed. However, in CF airways this relationship was completely disrupted, with greater PCL depths associated with slowest transport rates. This disrupted relationship was recapitulated by selectively inhibiting bicarbonate transport in vitro and ex vivo. CF mucus exhibited increased viscosity in situ due to the absence of bicarbonate transport, explaining defective MCT that occurs even in the presence of adequate PCL hydration.

Conclusions: An inherent defect in CF airway surface liquid contributes to delayed MCT beyond that caused by airway dehydration alone and identifies a fundamental mechanism underlying the pathogenesis of CF lung disease in the absence of antecedent infection or inflammation.

Keywords: airway epithelium; cystic fibrosis; mucus transport; optical coherence tomography; viscosity.


Figures
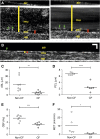
Figure 1.
Figure 1.
Microoptical coherence tomography (μOCT) imaging of human bronchial epithelial (HBE) respiratory epithelia. (A) μOCT images of non–cystic fibrosis (CF) HBE cells grown in culture. Cilia tips (green arrows), mucus layer (mu), airway surface liquid (ASL) layer (yellow bar), and periciliary liquid (PCL) layer (red bar) are seen. PCL and cilia tips are more readily discerned in time-averaged image over 10 s (right) as compared with static image (left). ASL depth (yellow bar) is defined by the distance between the air–mucus interface and the surface of the epithelial layer (ep). PCL depth (red bar) is defined by the distance between the mucus layer and the epithelial surface. (B) Depleted ASL (yellow bar) and PCL (red bar) with cilia (green arrow) entangled within the mucus are visible in a μOCT image of HBE cells derived from a subject with CF. Horizontal and vertical scale bars: 10 μm. See also Video 1. (CF) Analysis of μOCT images from HBE cells derived from non-CF and CF donors and grown in culture yields numerical values for functional and anatomic parameters. ASL depth (C), PCL depth (D), ciliary beat frequency (CBF; E), and mucociliary transport (MCT) rate (F) are shown. *P < 0.05, **P < 0.005, ***P < 0.0005, ****P < 0.00005. Each symbol represents mean value from independent HBE monolayer; at least four donors were evaluated per condition. Note: a component of non-CF control data was previously reported (24, 35).
Figure 2.
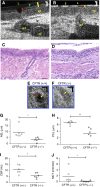
Figure 2.
Microoptical coherence tomography (μOCT) imaging of swine trachea epithelia. (A) μOCT image of trachea explanted from a cystic fibrosis transmembrane conductance regulator (CFTR) (+/+) piglet clearly shows cilia tips (green arrow), airway surface liquid (ASL; yellow bar), and periciliary liquid (PCL; red bar) on the luminal surface (L). Epithelium (ep), lamina propria (lp), a gland (gl), and a gland duct (gd) transecting the image are also visualized. (B) Depleted ASL (yellow bar) and PCL (red bar) and flattened cilia (green arrow) are visible in a μOCT image of tracheal lumen (L) dissected from a CFTR (−/−) newborn piglet. Horizontal and vertical scale bars: 10 μm. (C, D) Histologic specimen stained with hematoxylin and eosin of corresponding area of CFTR (+/+) (C) and CFTR (−/−) (D) trachea. Scale bars: 34 μm. (E, F) Three-dimensional reconstructed en face view of representative duct glands from μOCT imaging. CFTR (+/+) piglet in E clearly shows a thin liquid layer (red arrow) surrounding the mucus within the gland duct (yellow arrow), which is not seen in the CFTR (−/−) piglet (F). Horizontal and vertical scale bars: 10 μm. See also Video 2. (GJ) Analysis of μOCT images from explanted swine yields numerical values for functional and anatomic parameters. ASL depth (G), PCL depth (H), ciliary beat frequency (CBF; I), and mucociliary transport (MCT) rate (J) are shown. *P < 0.05, **P < 0.005. Each symbol represents mean value from independent trachea explant taken from five regions of interest. Note: A component of CFTR (+/+) control data was previously published in tabular format (10, 24).
Figure 3.
Figure 3.
Functional parameters of swine tracheal epithelia with and without shear stress. Analysis of μOCT images from swine tracheal epithelia incubated under physiologic conditions and exposed to static environment or subjected to 0.114 dynes/cm2 shear stress for 4 h before image acquisition. Periciliary liquid (PCL) depth (A), airway surface liquid depth (ASL, B), ciliary beat frequency (CBF, C), and mucociliary transport (MCT, D) are shown for each condition. Each symbol represents a single region of interest after static or shear stress exposure, as indicated. *P < 0.05, **P < 0.005, ***P < 0.0005, ****P < 0.00005. ns = not significant. See also Video 3.
Figure 4.
Figure 4.
Altered functional microanatomy in cystic fibrosis (CF) swine trachea. (A, B) Correlation between periciliary liquid (PCL) and mucociliary transport (MCT) for CF transmembrane conductance regulator (CFTR) (+/+) trachea (A) and CFTR (−/−) trachea (B). Matched data from experiments after shear stress (circles) and static (squares) conditions are included. Linear curve fit in wild type (R2 = 0.17, *P < 0.05) was significantly different than CF (R2 = 0.12; *P < 0.05 for CF vs. non-CF slope comparison; P = 0.06 for linear fit). (C) MCT of CFTR (+/+) trachea compared with CFTR (−/−) trachea when PCL depth was ≥7 μM. P = 0.06. (D, E) Correlation between airway surface liquid (ASL) depth and MCT in CFTR (+/+) trachea (D) and CFTR (−/−) trachea (E). Linear curve fits for CFTR (+/+) (R2 = 0.02, P = not significant) and CFTR (−/−) (R2 = 0.21, P = 0.13) are shown. (F, G) Correlation between ciliary beat frequency (CBF) and MCT for CFTR (+/+) trachea (F) and CFTR (−/−) trachea (G). Linear curve fit for CFTR (+/+) (R2 = 0.03, P = not significant) and CFTR (−/−) (R2 = 0.18, P = 0.08) are shown.
Figure 5.
Figure 5.
Mucus viscosity in situ. (AC) Viscosity of airway surface liquid detected by fluorescence recovery after photobleaching (FRAP). (A) Representative FRAP curve of airway mucus in situ from cystic fibrosis transmembrane conductance regulator (CFTR) (+/+) and CFTR (−/−) piglets. (B, C) Summary data of FRAP half-life as determined in swine trachea explants (B) and primary human bronchial epithelial monolayers from derived from donors with cystic fibrosis (CF) and those without (non-CF) (C). *P < 0.05, n = 3–5 per condition. (D, E) Particle tracking microrheology of the airway surface liquid depth (ASL) of CF and non-CF airway monolayers after cessation of ciliary motion using 0.1% benzalkonium chloride. (D) Representative 2.2-s particle track of 50-nm polyethylene glycol–coated particle in the ASL of CF and non-CF airway monolayers. Scale bar = 1 μm. (E) Frequency-dependent dynamic viscosity estimated from particle tracking. (F) Comparison of the viscosities obtained at the lowest frequency assessed (0.175 Hz) represents effective viscosity of CF and non-CF monolayers. P < 0.05, n = 12 per condition.
Figure 6.
Figure 6.
Inhibition of bicarbonate transport. (AC) Representative time-averaged microoptical coherence tomography (μOCT) images of normal adult swine trachea treated with vehicle control (A), 4,4'-dinitrostilbene-2,2'-disulphonic acid (DNDS) (B), and bumetanide (C) clearly shows periciliary liquid (PCL; red bar) on the luminal surface. Epithelium (ep) and lamina propria (lp) are also visualized. Streaks above the PCL indicate a moving mucus layer (μ) in the vehicle- and DNDS-treated tracheae, whereas bumetanide-treated trachea indicate a scant mucus layer except near a gland. Scale (white bar) = 10 μm. (D) Quantification of PCL depth shows no effect of DNDS treatment on this compartment, whereas PCL depths are reduced in tissue treated with bumetanide. (E). Measurement of mucociliary transport (MCT) rate showed reduced transport in tissues treated with both DNDS and bumetanide. (FH) Linear curve fits for a relationship between PCL depth and MCT rate in vehicle control (F; R2 = 0.007, P = not significant), DNDS-treated (G; R2 = 0.178, P = 0.04), and bumetanide-treated (H; R2 = 0.001, P = not significant) are shown. (I) Particle tracking microrheology of the mucus collected from these trachea yielded 2.2-s representative particle tracks of 500-nm polyethylene glycol–coated particle in the mucus of vehicle control–, DNDS-, and bumetanide-treated tissues. Scale bar = 1 μm. (J) Frequency-dependent dynamic viscosity curves of these mucus samples show significantly higher viscosities in mucus from both DNDS and bumetanide-treated tracheae compared with control. (K) Particle-tracking microrheology of the mucus layer of normal airway monolayers cultured in normal media and bicarbonate-depleted media with and without acetazolamide yields representative particle tracks of 500-nm polyethylene glycol–coated particle. Scale bar = 1 μm. (L) Frequency-dependent dynamic viscosity curves of these mucus samples show significantly higher viscosities in mucus on cells incubated in bicarbonate-depleted media, both with and without acetazolamide, compared with control. *P < 0.05, ****P < 0.0001.

Comment in

References

    1. Rowe SM, Miller S, Sorscher EJ. Cystic fibrosis. N Engl J Med. 2005;352:1992–2001. - PubMed
    1. Poulsen JH, Fischer H, Illek B, Machen TE. Bicarbonate conductance and pH regulatory capability of cystic fibrosis transmembrane conductance regulator. Proc Natl Acad Sci USA. 1994;91:5340–5344. - PMC - PubMed
    1. Quinton PM. Missing Cl conductance in cystic fibrosis. Am J Physiol. 1986;251:C649–C652. - PubMed
    1. Welsh MJ. An apical-membrane chloride channel in human tracheal epithelium. Science. 1986;232:1648–1650. - PubMed
    1. Matsui H, Randell SH, Peretti SW, Davis CW, Boucher RC. Coordinated clearance of periciliary liquid and mucus from airway surfaces. J Clin Invest. 1998;102:1125–1131. - PMC - PubMed

Publication types