. 2014 Jul 17;511(7509):312-8.
doi: 10.1038/nature13547. Epub 2014 Jul 2.

Reprogramming human endothelial cells to haematopoietic cells requires vascular induction

Affiliations

Reprogramming human endothelial cells to haematopoietic cells requires vascular induction

Vladislav M Sandler et al. Nature. .

Abstract

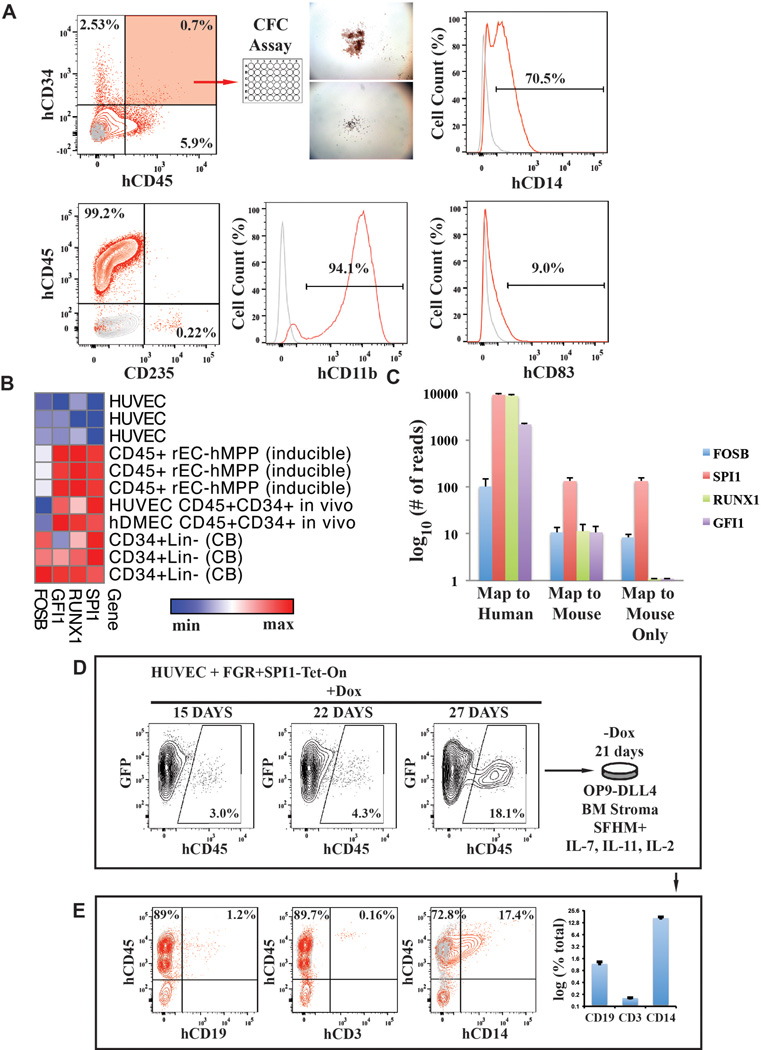
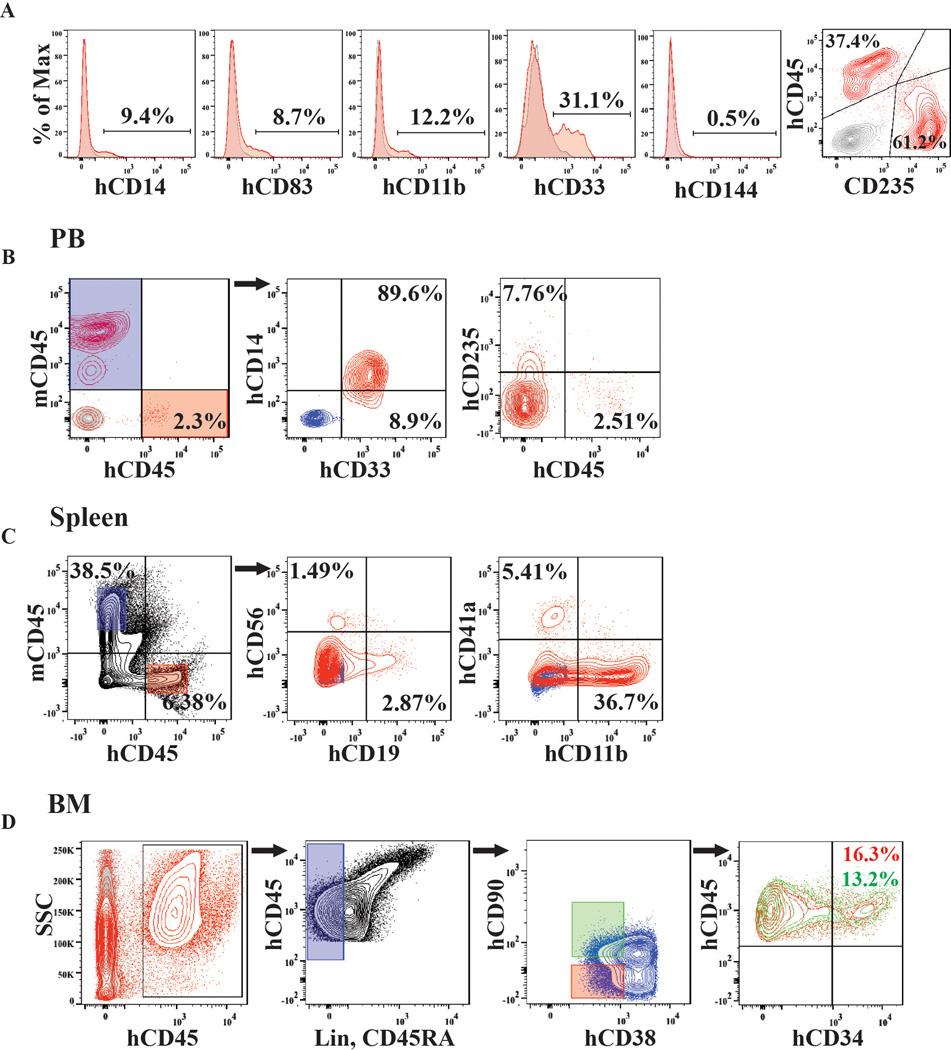
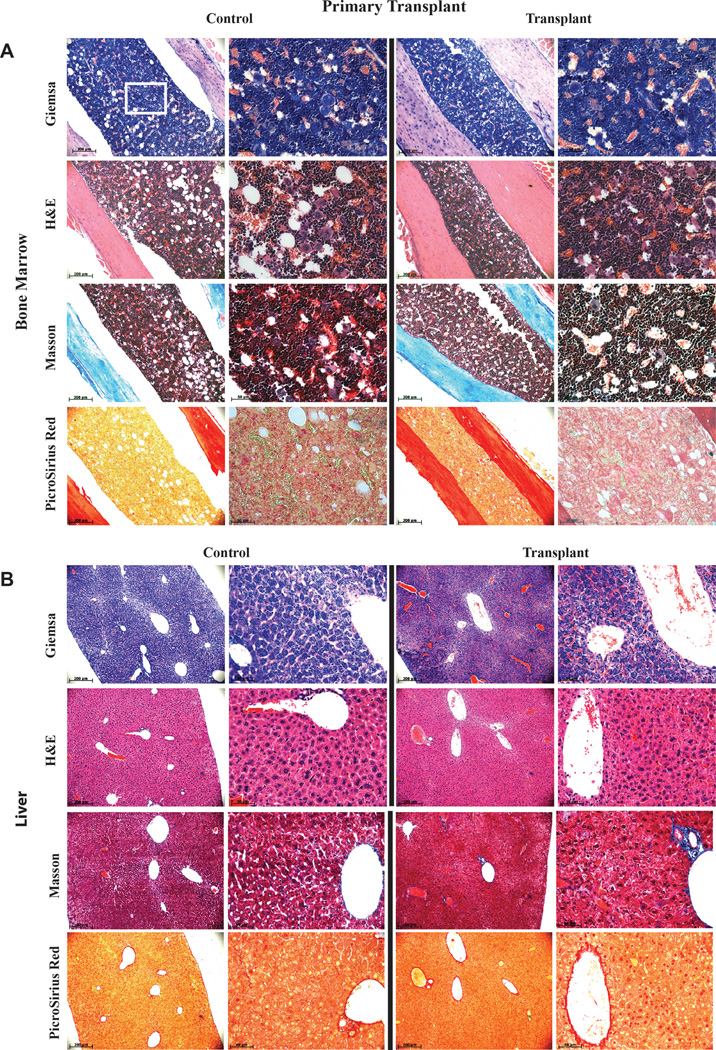
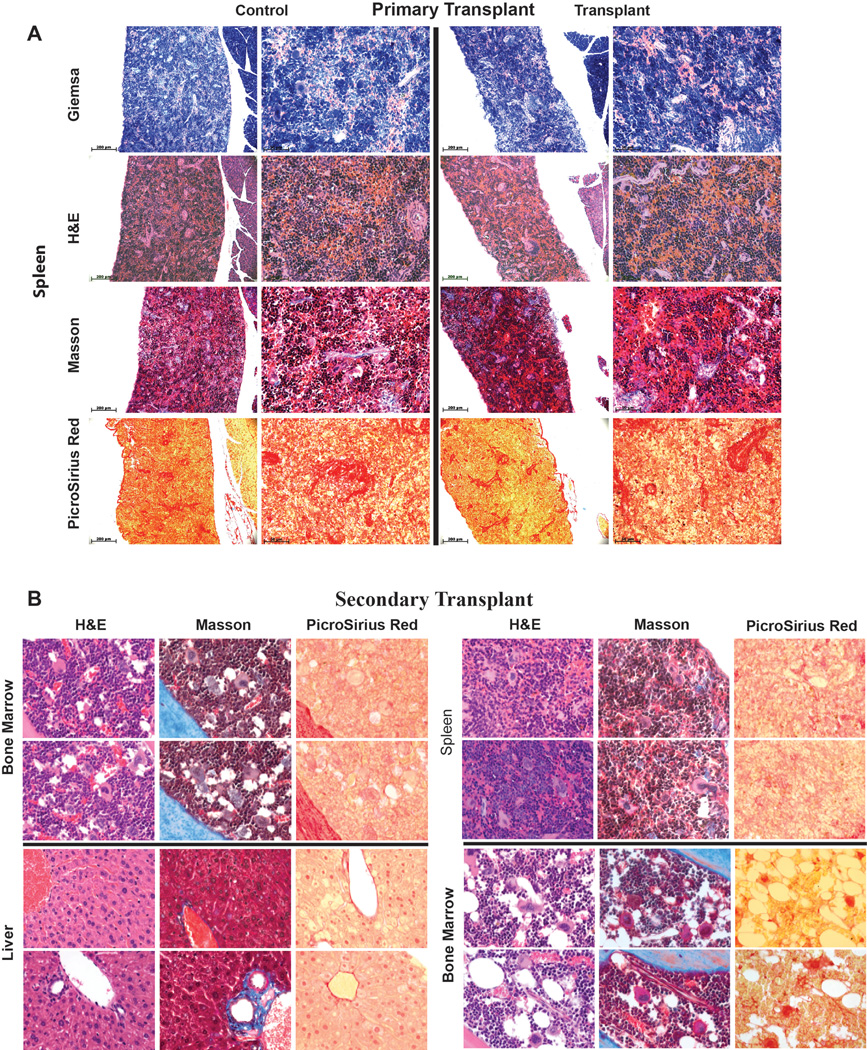
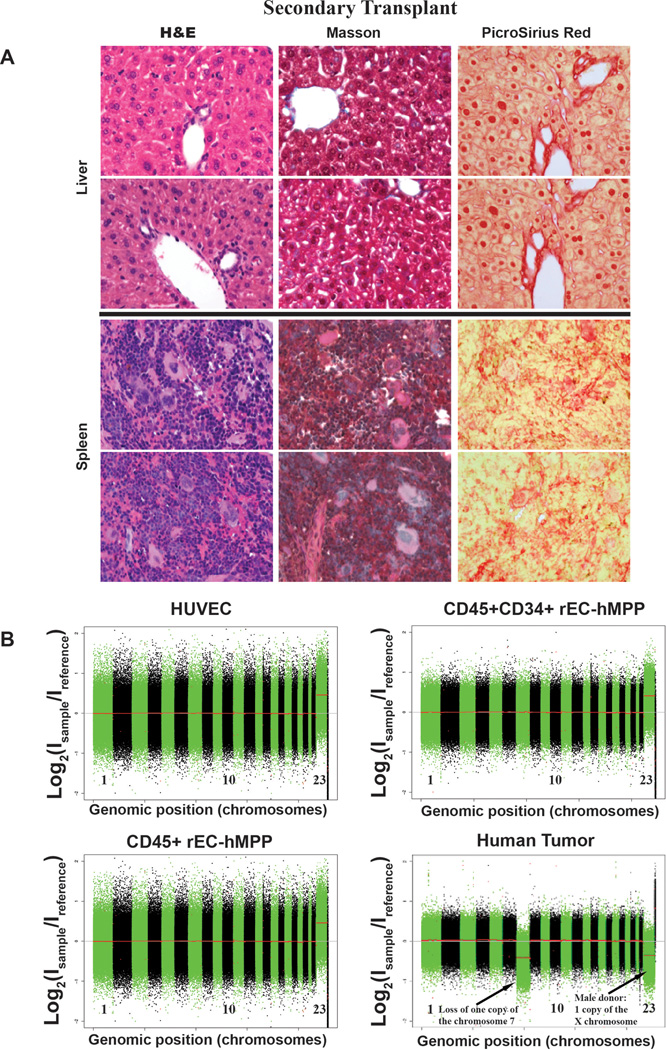
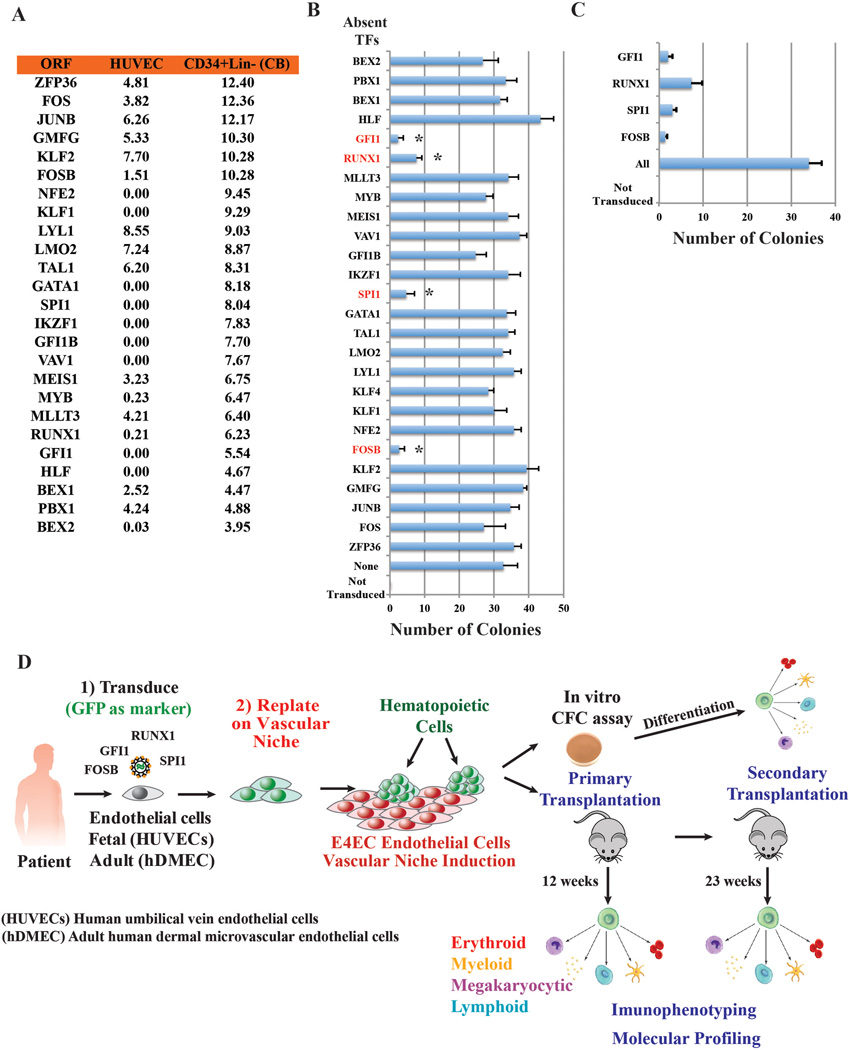
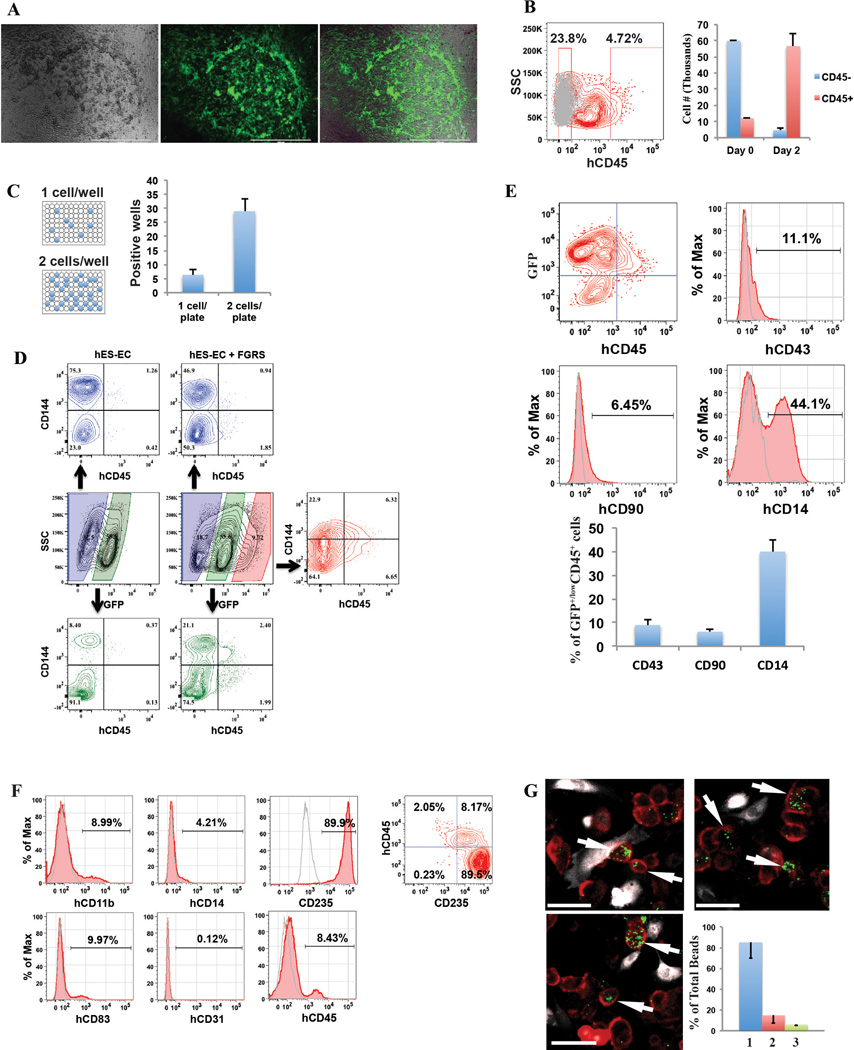
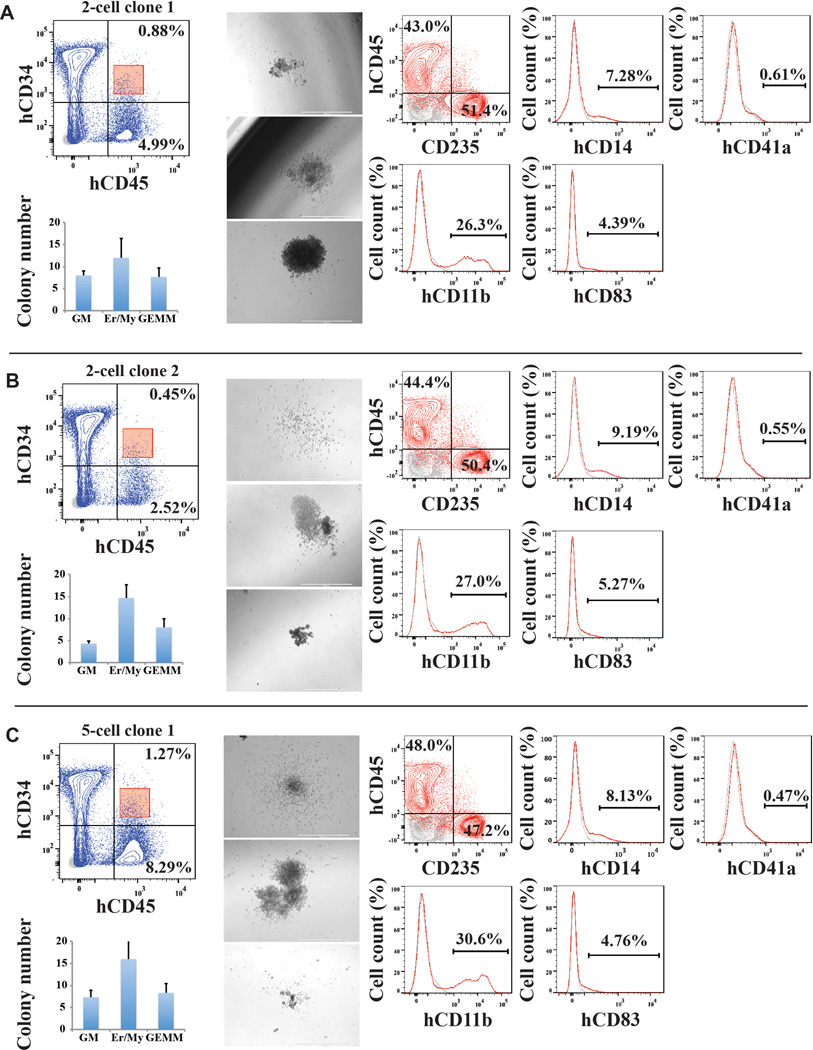
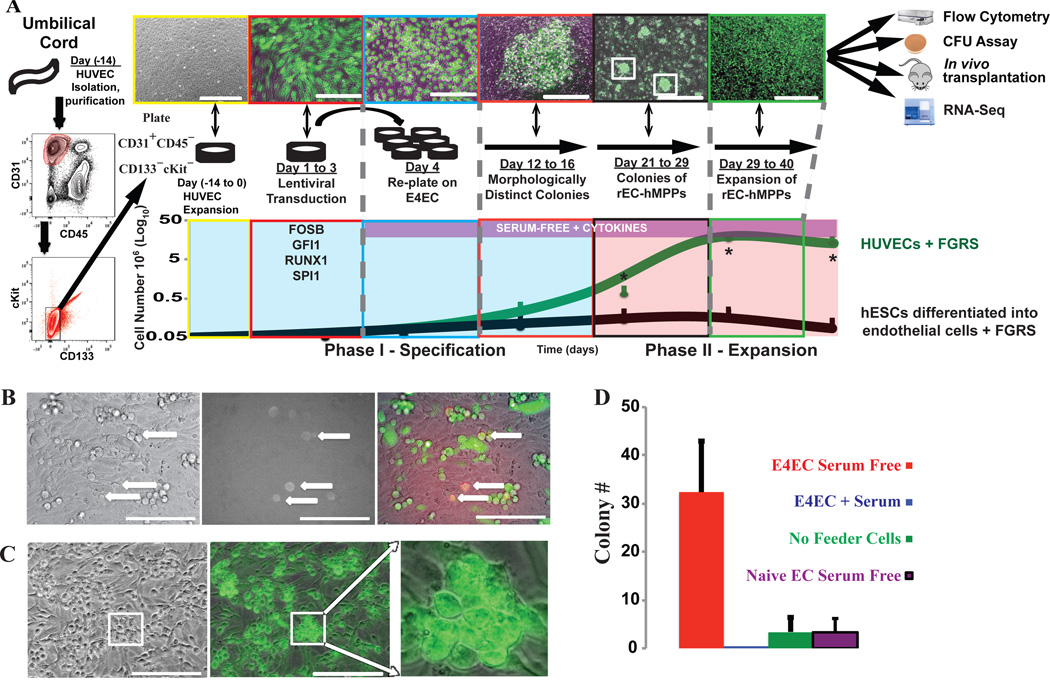
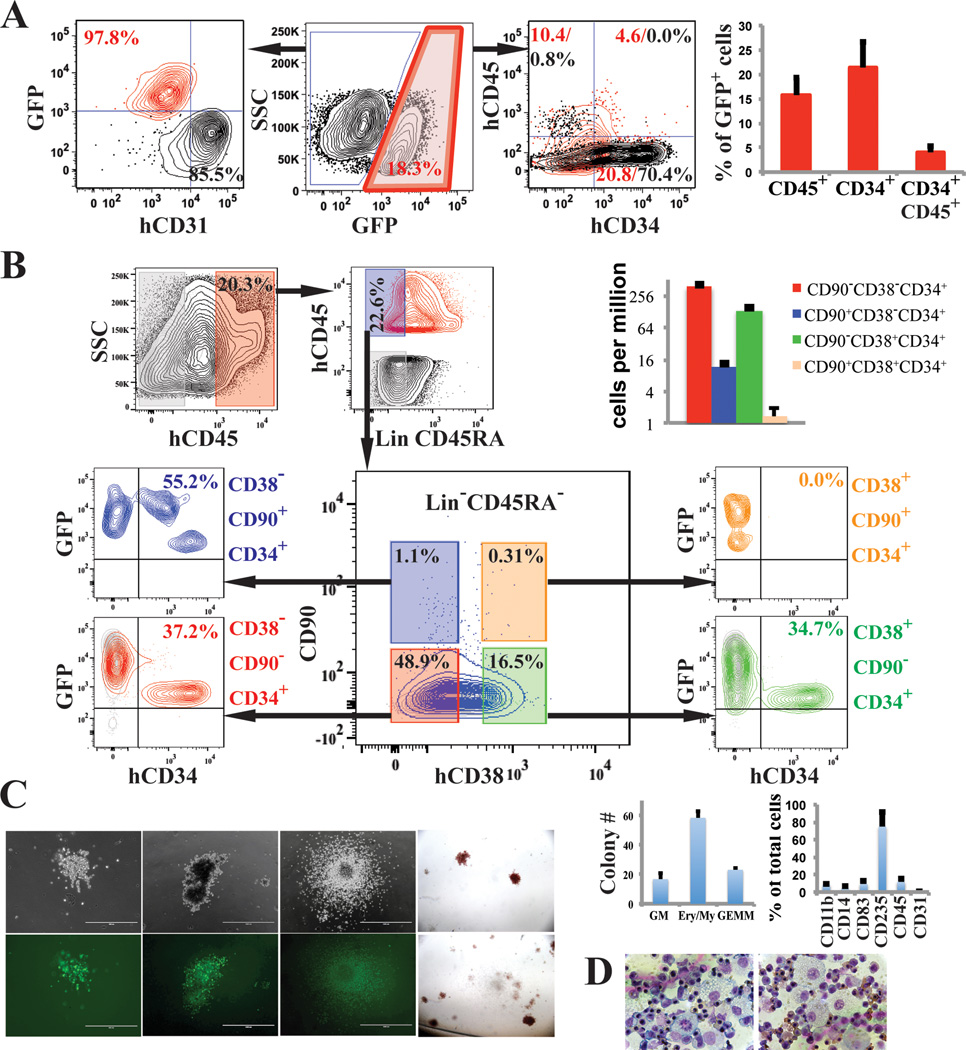
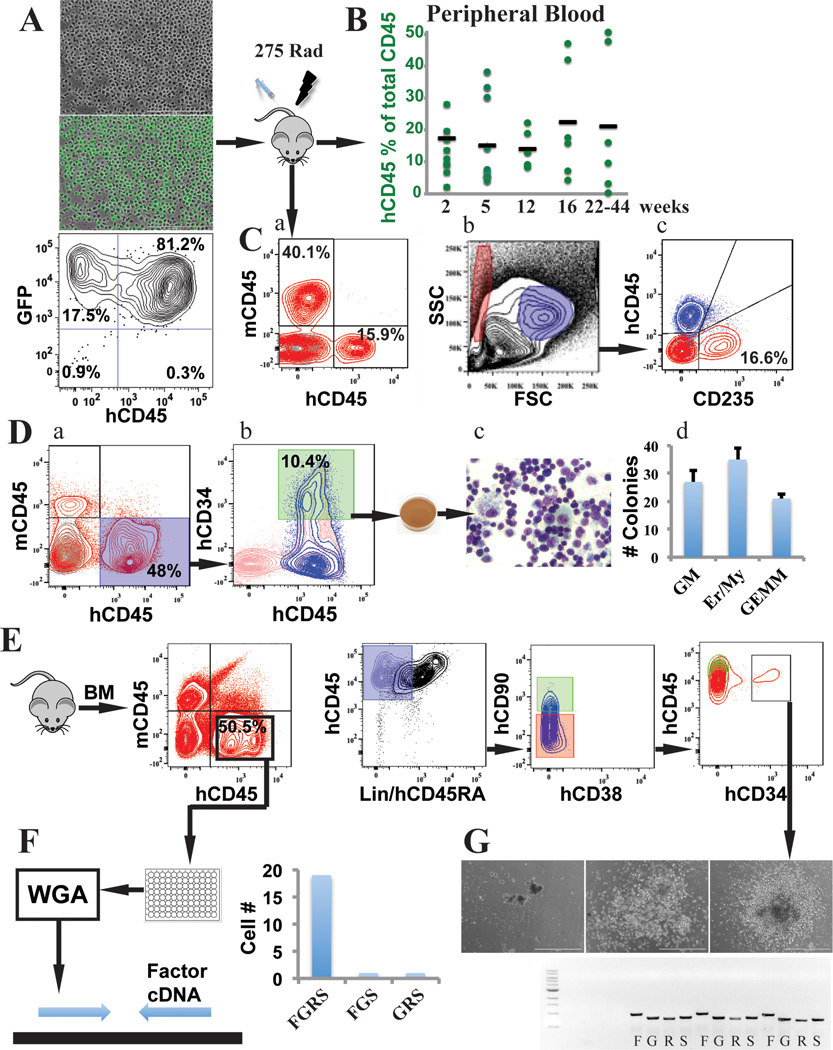
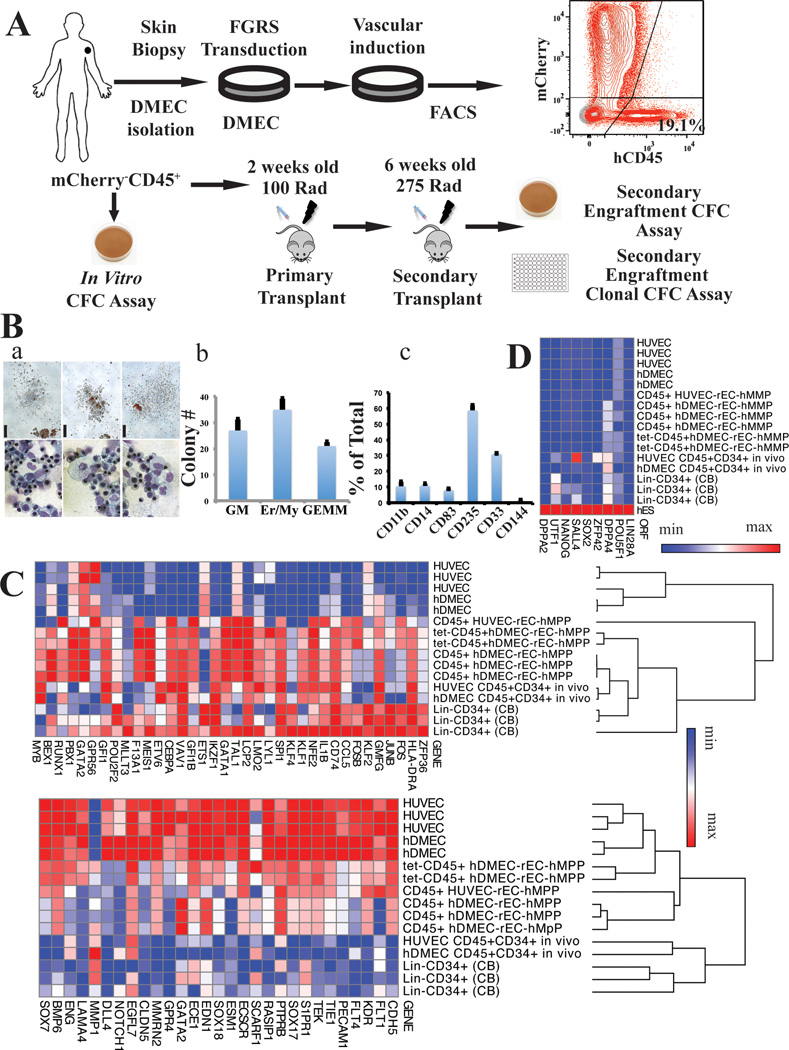
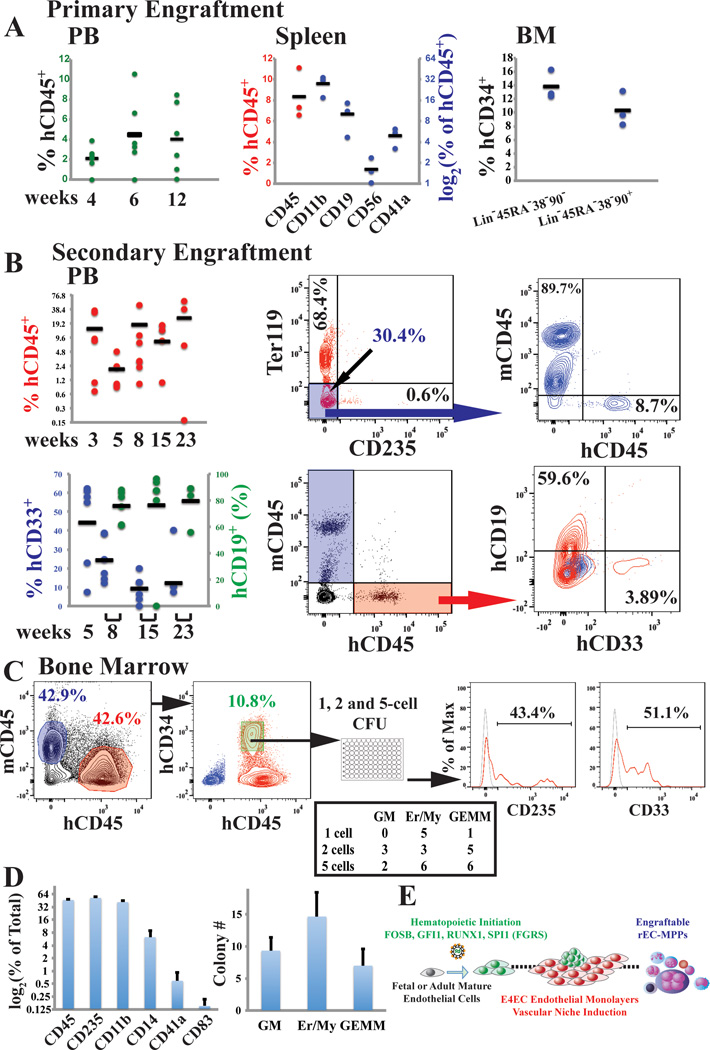
Generating engraftable human haematopoietic cells from autologous tissues is a potential route to new therapies for blood diseases. However, directed differentiation of pluripotent stem cells yields haematopoietic cells that engraft poorly. Here, we have devised a method to phenocopy the vascular-niche microenvironment of haemogenic cells, thereby enabling reprogramming of human endothelial cells into engraftable haematopoietic cells without transition through a pluripotent intermediate. Highly purified non-haemogenic human umbilical vein endothelial cells or adult dermal microvascular endothelial cells were transduced with the transcription factors FOSB, GFI1, RUNX1 and SPI1 (hereafter referred to as FGRS), and then propagated on serum-free instructive vascular niche monolayers to induce outgrowth of haematopoietic colonies containing cells with functional and immunophenotypic features of multipotent progenitor cells (MPPs). These endothelial cells that have been reprogrammed into human MPPs (rEC-hMPPs) acquire colony-forming-cell potential and durably engraft into immune-deficient mice after primary and secondary transplantation, producing long-term rEC-hMPP-derived myeloid (granulocytic/monocytic, erythroid, megakaryocytic) and lymphoid (natural killer and B cell) progenies. Conditional expression of FGRS transgenes, combined with vascular induction, activates endogenous FGRS genes, endowing rEC-hMPPs with a transcriptional and functional profile similar to that of self-renewing MPPs. Our approach underscores the role of inductive cues from the vascular niche in coordinating and sustaining haematopoietic specification and may prove useful for engineering autologous haematopoietic grafts to treat inherited and acquired blood disorders.


Figures

Extended Data Figure 1
Extended Data Figure 1. Screening strategy for identification of minimal set of transcriptions factors (TFs) for reprogramming ECs into hematopoietic cells
A. Candidate genes tested for reprogramming of HUVECs into hematopoietic colonies. To identify TFs that drive EHT transition, we performed RNA-seq of HUVECs and Lin-CD34+ umbilical cord HSPCs to select TFs differentially expressed by HSPCs, but not by HUVECs. We then screened various combinations of differentially expressed TFs to identify a minimal set capable of reprogramming ECs to hematopoietic cells. Levels of expression [log2(RNA-seq value)] in HUVECs and freshly purified CD34+Lin cord blood cells. B. One-by-one elimination of TFs experiment revealed a minimal set of TFs; FOSB, GFI1, RUNX1, and SPI1, (FGRS) capable of generating hematopoietic colonies in the HUVEC culture. A pulled set of 26 TFs minus one TF was evaluated for the ability to evoke formation of hematopoietic clusters (day 21 to 25; n=3). Asterisks show statistically significant (p<0.05) reduction of the number of hematopoietic clusters in the transduced HUVECs compared to the full set of TFs. Control represents non-transduced HUVECs. Transduced cells were cultured on a layer of serum-free E4EC monolayers. C. One-by-one elimination of the FGRS factors shows that all four FGRS-TFs are necessary and sufficient for generation of hematopoietic colonies (day21 to 25; n=3). “All” in B and C: all TFs are present. “Control” in B and C: all TFs are absent. D. Schema for reprogramming of ECs into human multipotent progenitor cells (rEC-hMPPs). Clonal or bulk populations of HUVECs or hDMECs were transduced with the FGRS and after 3 days were replated on subconfluent monolayers of E4EC ECs. The emerging colonies of hematopoietic cells were subjected to 1) multi-variate immunophenotypic analyses, 2) clonal and oligo-clonal CFC assay, and 3) molecular profiling (RNA-seq). Tissues of the engrafted mice were processed for histological examination to rule out any malignant transformation.
Extended Data Figure 2
Extended Data Figure 2. FGRS-transduction and vascular-induction reprogram HUVECs, but not hES-ECs, to proliferating functional rEC-MPPs
A. Multi-colony niche-like structure that physically separates developing hematopoietic colonies from surrounding E4EC vascular niche. The emerging multi-colony sinusoidal-like structures create a unique cellular interface between E4EC monolayers and transduced ECs giving rise to hematopoietic clusters (n=4, scale bar is 1000 µm.) B. Expansion potential of reprogrammed CD45+hematopoietic cells. CD45+ (12×103) and CD45- (60 ×103) cells were sorted into separate wells and expanded for two days. We observed 5-fold expansion of CD45+ cells (56.6 ×10³±7.9 ×10³; n=3) and dramatic reduction of CD45 cells number (4.6×10³±1.0 ×10³; n=3). C. Clonal expansion of CD45+ cells. CD45+cells were FACS sorted into 96-well plates at the density of 1 and 2 cells/well. After seven days of culture, we observed CD45+ cell expansion in 6.3±2.1 wells (93.1±14.5 cells/well) of 1-cell sort and 29.0±4.3 wells (112.1±21.2 cells/well) of the 2-cell sort (n=3). The difference between cell number in 1 and 2-cell sort was statistically not significant (p=0.78) suggesting that the difference in the number of wells with detected cell expansion was rather due to survival of sorted cells than a reflection of the number of cells sorted into a well. D. FGRS-induced generation of hematopoietic cells by hES-derived endothelium (hES-EC). Representative experiment demonstrating that transduced hES-EC (Right 4 panels) generated significantly higher number of CD45+CD144- cells compared to control non-transduced hES-EC (left 3 panels). E. Lineage-specific surface marker analysis of the GFP+CD45+ population of rEC-hMPPs. GFP+CD45+population showed that some of these cells expressed lineage specific surface markers such as CD43+ (8.96%±2.3; n=3), CD90+ (Thy-1+) (6.15%±1.13; n=3) and CD14+ (40.0%±4.95; n=3) (representative flow cytometry measurements; left four panels, statistics for all experiments is in the right-hand bar-graph, n=3). F. Immunophenotypic analysis of CFU colonies grown in the CFC assay performed in Figure 2C,D. G. Macrophages differentiated from rEC-hMPPs are functional capable of phagocytosis. The images (upper row and lower left) show groups of firmly plastic-adherent CD14+ cells (red staining) with clearly visible phagocytosed green fluorescent beads (GFB; green). Endothelial CD144+(VE-cadherin) cells (white staining) were not co-localized with beads. Majority (85.1%±15.1) of GFBs was localized inside CD14+ cells (lower left graph 1). A smaller population of GFBs was distributed outside CD14+ and CD144(VE-cadherin)+ cells (14.8±7.43%; lower left graph 2). The percentage GFBs co-localized with endothelial cells was negligible (4.8±0.83%; lower left graph 3), n=9. Scale bars are 25 µm.
Extended Data Figure 3
Extended Data Figure 3. Naïve HUVECs are devoid of hemogenic potential capable of spontaneous differentiation into MPPs
We performed two sets of experiments to exclude the possibility that rEC-hMPPs were derived from spontaneously differentiating HUVECs with hemogenic or hemangioblastic potential,. A to B: In optimal pro-hematopoietic cultures, naïve non-transduced ECs fail to spontaneously differentiate into rEC-MPPs. A. We grew non-FGRS-transduced HUVECs in the serum-free media used for reprogramming. Neither serum withdrawal, nor addition of hematopoietic cytokines induced formation of CD45+CD34+ cells and HUVECs sustained their vascular identity. Indeed, serum withdrawal increases number of CD34+ HUVECs; SF-serum free, CK-cytokines cocktail (see methods), SB - TGFβ inhibitor SB431542. B. Serum withdrawal suppresses HUVEC proliferation. Inhibition of TGFβ signaling (SB) combined with cytokine cocktail (see methods) restores proliferative potential of HUVECs in serum free media. Difference between proliferation of HUVECs in serum free media and all other conditions is statistically significant (asterisk; p<0.005). Statistical significance between pairs of different conditions is shown with blue arrows and p-values, where p<0.005 is statistically significant. Therefore, human rEC-hMPPs originate from reprogrammed ECs, but not cytokine-mediated outgrowth of contaminating pre-existing hemogenic ECs. C to E: Clonal reprogramming of non-hemogenic HUVECs into rEC-hMPPs using FGRS-transduction and vascular-induction. We performed EC clonal reprogramming experiments to exclude the possibility that rEC-hMPPs were derived from spontaneously differentiating HUVECs with pre-existing hemogenic or hemangioblastic potential,. C. Since E-selectin is only expressed in ECs, we generated clonal cultures of CD45CD144+CD31+CD62E(E-selectin)+ ECs32,33. To this end, CD144+CD31+CD62E+CD45HUVECs were sorted into 96-well plates at 1, 2, 5 and 10 cells per well densities for clonal expansion. Proliferating clones were transduced with FGRS and induced with serum-free E4ECs. D. These clonal cultures yielded rEC-hMPPs comparable to bulk HUVEC cultures. The numbers of hematopoietic-like colonies emerging from 1-cell, 2-cell, 5-cell, and 10-cell clones are not statistically different (p>0.05). E. An example of a hematopoietic-like colony derived from a 1-cell clone #2. Therefore, it is unlikely that rEC-hMPPs are derived through spontaneous differentiation of pre-existing ECs with hemogenic or hemangioblastic potential.
Extended Data Figure 4
Extended Data Figure 4. Clonal reprogramming of non-hemogenic HUVECs into immunophenotypic and functional rEC-hMPPs using FGRS-transduction and vascular-induction
A,B,C: CFC assay of clonally reprogrammed rEC-hMPPs. CD45+CD34+rEC-hMPPs were sorted out (red gate in FACS plots; upper left) and plated for CFC assay. Typical hematopoietic colonies arose in the assay (middle column microphotographs; x4 magnification). FACS plots on the right show immunophenotypic analysis of the cells that arose in the CFC assay, demonstrating differentiation into human CD45CD235+erythroid CD11b+macrophage CD14+monocytic, CD41a+megakaryocytic and CD83+dendritic progenies. The graph in the left lower corner shows quantification of the CFC assay (n=3). Identical panels are shown for two 2-cell clones and one 5-cell clone. A total of 3 independent clones are shown. Thus, given the high efficiency of clonal reprogramming of mature authentic ECs into rEC-hMPPs, it is unlikely that rEC-hMPPs are spontaneously derived from a very rare population of a pre-existing hemogenic or hemangioblastic HUVECs.
Extended Data Figure 5
Extended Data Figure 5. Single cell analysis of lentiviral integration into engrafted rEC-MPPs
CD45+ cells were sorted into a 96-well plate (1 cell/well), lysed in corresponding well for whole genome amplification (WGA) using Phi29 enzyme (see methods). Amplified DNA is shown for all 21 cells in the top two gels. Amplified DNA was used as a template for PCR reactions with a forward primer specific for the CMV promoter and reverse primer specific for the coding sequence of a reprogramming factor. T-test PCR with a lentiviral vector. EW – empty well – no template DNA. Red asterisks show failed PCR amplification of viral integration. PCR products are visible as low molecular weight bands labeled as 1 – FOSB, 2 – GFI1, 3 – RUNX1, 4 – SPI1.
Extended Data Figure 6
Extended Data Figure 6. Conditional expression of FGRS is sufficient for optimal generation of rEC-hMPPs with multilineage potential, including T-Cell lymphoid cells
A to C: Conditional expression of mouse inducible FGRS factors activates endogenous human FGRS in HUVECs sustaining functional hematopoietic cell fate of rEC-hMPPs. A. To test whether FGRS-induced reprogramming triggered expression of endogenous FGRS genes, HUVECs were transduced with lentivirus expressing FGRS-Tet-On and a trans-activator, and grown on E4EC-vascular niche for 18–22 days (n=4) in the presence of doxycycline. Doxycycline was removed from the culture medium after 18–22 days to shut off the expression of mouse FGRS and cells were cultured for additional 7–10 days. Human CD45+CD34+ cells were FACS isolated for CFC assay and whole-transcriptome deep sequencing (RNA-seq). CFC assay revealed emergence of hematopoietic colonies with cells expressing human CD235, CD11b, CD83, and CD14. B. Comparison of transcriptional profiles of the human FGRS expression in human HUVECs, hCD45+ rEC-hMPPs programmed using inducible mouse FGRS, CD45+CD34+ rEC-hMPPs, 22 weeks post-transplantation, hDMEC-derived CD45+CD34+rEC hMPPs after 15 weeks post-secondary engraftment and naïve CD34+Lin+ cells purified from cord blood. C. Analysis of whole-transcriptome RNA-Seq of rEC-hMPPs derived using inducible mouse FGRS (n=3). All RNA-Seq reads were aligned against human and mouse FGRS sequences. RNA-Seq reads that align to human FGRS sequences – “Map to Human”, RNA-Seq reads that align to mouse FGRS sequences – “Map to Mouse”, and RNA-Seq reads that align to mouse FGRS sequences without a possibility to align to human sequences – “Map to mouse Only”. D to E: Optimizing differentiation of rEC-hMPPs into lymphoid progeny D. The number of T-lymphoid progeny of engrafted rEC-hMPP was negligibly small, raising the possibility that constitutive SPI1 expression prevents rEC-hMPP from differentiating into T-cells,. To test this, HUVECs were transduced with lentiviral vectors expressing GFP and that constitutively express FGR-TFs with a Tet-inducible SPI1 (FGR+SPI1-Tet-On construct) for 3 days followed by replating for E4EC-induction. After 27 days of FGR and doxycycline-induced SPI1 expression on E4ECs, GFP+CD45+ hematopoietic-like colonies emerged. Then, doxycycline was withdrawn and the reprogrammed cells were cultured serum-free with Delta-like-4 expressing OP9-stroma (OP9-DLL4) supplemented with IL-7, IL-11, and IL-2. There is an increase of the number of GFP+CD45+ cells emerging during reprogramming of HUVECs by FGR+SPI1-Tet-On construct and E4EC-induction. E. rEC-hMPPs differentiate into CD3+, CD19+ and CD14+ hematopoietic cells in the absence of exogenous expression of SPI1. After 3 weeks, the numbers of the myeloid and lymphoid cells were quantified by flow cytometry. We were able to reliably detect a small fraction of CD3+ cells (0.16±0.01%; n=3), a larger number of CD19+ (1.17±0.13%; n=3) and CD14+ (16.46±1.02%; n=3) cells. Thus, generation of lymphoid cells from rEC-hMPPs could be optimized by transient expression of TFs.
Extended Data Figure 7
Extended Data Figure 7. Adult human hDMECs-derived rEC-hMPPs are capable of in vivo primary and secondary multilineage engraftment
A. Immunophenotypic analysis of cells grown in the CFC assay (from Figure 4B). These panels show quantification of surface marker expression in the cells isolated from the colonies in CFC assay (n=3). hDMECs differentiated into hCD45CD235+ erythroid, CD11b+CD14+ monocyte/macrophage and CD83+ dendritic cell progenies. Minimal CD144 (VE-cadherin) was detected. B. Analysis of peripheral blood (PB) of mice at 4, 6, and 12 weeks post-primary transplantation (Figure 5A) revealed circulating hCD45+ and their hCD33+, hCD14+myeloid and hCD45hCD235+erythroid progenies (n=6). Mouse CD45 (mCD45+) cells were excluded from analyses. Mouse cells – blue. Human cells – red. C. Analysis of spleen of mice at 14 weeks post-primary transplantation (Figure 5A) revealed presence of hCD45+ (Red gate) and their lymphoid (hCD19+, hCD56+) and myeloid (hCD11b+, hCD41a+) progenies (n=3). Mouse CD45 (mCD45+ cells, blue populations). D. Analysis of mice BM at 14 weeks post-primary transplantation (Figure 5A). LinCD45RA cells (blue gate) was analyzed for CD38 and CD90 expression (green and red gates) and subsequently examined for human CD45 and CD34 expression. This analysis revealed presence of hCD34+cells with small populations of both LinCD45RACD38CD90+CD34+ and LinCD45RACD38CD90CD34+ cells satisfying phenotypic definition of human HSCs and MPP, respectively (n=3).
Extended Data Figure 8
Extended Data Figure 8. Analysis of bone marrow (BM) and liver of primary transplanted mice for signs of malignant transformation
Analysis of BM (A) and liver (B) of mice 10 months after primary transplantation (from Figure 3B) of HUVEC derived rEC-hMPPs for signs of malignant transformation. The level of fibrosis was determined using Masson and PicroSirus staining. The architectonic geometry of the BM was determined by sequential multi-cross sectional Wright Giemsa and Hematoxylin-Eosin (H&E) staining and compared to age control non-transplanted NSG mice. We did not observe any evidence of fibrosis or alteration of the geometry of the bone marrow or liver of the transplanted mice. Furthermore, no recipient mouse manifested any anatomical or symptomatic evidence of leukemias, lymphomas or myeloproliferative neoplasm (MPN): lymphadenopathy, organomegaly, illness or hemorrhage. Circulating hCD45+ cells in PB displayed no evidence of lympho/myeloproliferation or dysplasia. Furthermore, microscopic architecture of BM and liver was normal and without fibrotic remodeling or aberrant deposition of collagen or desmin. All images were acquired using color CCD camera. The scale bar is 200µm for low-resolution images in the left columns and 50 µm for high-resolution images in the right columns. Upper left image (Giemsa Control) shows a white square in the center that corresponds to the portion of the image shown at high resolution on the right (the same Giemsa Control sample). This rule applies to all shown images.
Extended Data Figure 9
Extended Data Figure 9. Analysis of spleen of primary transplanted mice and BM, spleen and liver of secondary transplanted mice for signs of malignant transformation
Analysis of spleen of mice 10 months after primary transplantation (from Figure 3B) of HUVEC derived rEC-hMPPs as well as BM (n=2), spleen- and liver- (n=2, Also Extended Data Figure 10A) of mice that were engrafted with secondary transplanted hDMEC-derived rEC-hMPP cells 15 weeks post-transplantation (from Figure 5B) for signs of malignant transformation. The level of fibrosis was determined using Masson and PicroSirus stainings. The architectonic geometry of the BM was determined by sequential multi-cross sectional Wright Giemsa and Hematoxylin-Eosin (H&E) staining and compared to age control non-transplanted NSG mice. We did not observe any evidence of fibrosis or alteration of the geometry of the bone marrow, spleen or liver of the transplanted mice. Furthermore, no recipient mouse manifested any anatomical or symptomatic evidence of leukemias, lymphomas or myeloproliferative neoplasm (MPN): lymphadenopathy, splenomegaly/organomegaly, illness or hemorrhage. Circulating hCD45+ cells in PB displayed no evidence of lympho/myeloproliferation or dysplasia. Furthermore, microscopic architecture of BM, spleen and liver was normal and without fibrotic remodeling or aberrant deposition of collagen or desmin. All images were acquired using color CCD camera. In primary transplants the scale bar is 200µm for low-resolution images in the left columns and 50 µm for high-resolution images in the right columns. Upper left image (Giemsa Control) shows a white square in the center that corresponds to the portion of the image shown at high resolution on the right (the same Giemsa Control sample). This rule applies to all shown images (Primary Transplant). All images in Secondary Transplant are acquired at 60x magnification. All images are acquired at 60x magnification. Top rows of images for each organ are secondary transplants; bottom rows of images for each organ are controls.
Extended Data Figure 10
Extended Data Figure 10. Analysis of liver and spleen of secondary transplanted mice for signs of malignant transformation and analyses of rEC-MPPs for genetic stability
A. Analysis of liver and spleen of secondary transplanted mice for signs of malignant transformation. Repeat analysis of spleen and liver of mice that were engrafted with secondary transplanted hDMEC-derived rEC-hMPP cells 15 weeks post-transplantation for signs of malignant transformation (from Figure 5B). The level of fibrosis was determined by Masson and PicroSirus stainings. The architectonic geometry of the BM was determined by sequential multi-cross sectional Hematoxylin-Eosin (H&E) staining and compared to age control non-transplanted NSG mice. We did not observe any evidence of fibrosis or alteration of the geometry of the spleen or liver of the transplanted mice. Furthermore, no recipient mouse manifested any anatomical or symptomatic evidence of leukemias, lymphomas or myeloproliferative neoplasm (MPN): lymphadenopathy, splenomegaly/organomegaly, illness or hemorrhage. Circulating hCD45+ cells in PB displayed no evidence of lympho/myeloproliferation or dysplasia. Furthermore, microscopic architecture of BM, spleen and liver was normal and without fibrotic remodeling or aberrant deposition of collagen or desmin. All images are acquired at 60x magnification. Top rows of images for each organ are secondary transplants; bottom rows of images for each organ are controls. B. Comparative genomic hybridization analysis (CGH) shows that rEC-hMPPs are genetically stable both in vitro and in vivo. Genomic DNA was extracted from HUVECs, CD45+rEC-hMPPs (35 days post-transduction) or in CD45+CD34+rEC-hMPP sorted from the engrafted NSG BM (24-weeks post-transplantation) and expanded for 72 hours in vitro. A human tumor sample was used as positive control of chromosome rearrangement. Extracted DNA was digested, labeled by random priming and hybridized to the Agilent 1M CGH arrays. The arrays were scanned in an Agilent DNA microarray scanner and obtained data was visualized using Feature Extraction software (version 10.7; Agilent). No genomic abnormalities were identified in CD45+rEC-hMPPs (or in CD45+CD34+rEC-hMPPs engrafted in NSG BM. Hence, rEC-hMPPs remain genetically stable in vitro and in vivo and are not transformed.
Figure 1
Figure 1. Reprogramming of HUVECs and hES-ECs into hematopoietic cells by FGRS TFs-transduction and vascular-induction
A. Schema of reprogramming platform of HUVECs into hematopoietic cells. CD45CD31+CD133cKit cells were sorted from freshly purified HUVECs and expanded (days −14 to 0). Sorted cells were transduced with FGRS (FGRS-ECs)(days 1–3) and grown in EC-media. On day 4, transduced cells were replated on E4ECs in serum-free hematopoietic media (days 12–40). Distinct GFP+ flat colonies were observed at days 12–16, which by days 21–29 remodeled into three-dimensional grape-like colonies. After a month (days 29–40) GFP+ cells expanded ~400-fold (n=4). CD144+VEGFR2+ECs derived from hES-ECs were also transduced with FGRS. The process of reprogramming is subdivided into two phases: Phase I–Specification (Day 1–20) and Phase II–Expansion (Day 21–40). The expanding cultures were assayed for morphological change, cell number, and CD45. Kinetics of reprogramming of HUVECs (Green trace) and expansion of reprogrammed hES-ECs cells (Black trace). B. Emergence of rounded hematopoietic-like GFP+CD45+ cells two to three weeks after HUVECs were transduced with FGRS (white arrows). C. Formation of GFP+ hematopoietic-like colonies on the E4ECs 3–4 weeks after FGRS transduction. D. Generation of GFP+CD45+ hematopoietic-like colonies (C) from FGRS-ECs is enhanced by co-culturing with serum-free E4ECs and blocked by presence of serum (n=8, p<0.05). Scale bar: 200 µm.
Figure 2
Figure 2. rEC-hMPPs phenotypically and functionally resemble multilineage HSPCs
A. FACS analysis of cocultured GFPE4ECs vascular niche along with GFP+ FGRS transduced HUVECs (FGRS-ECs) four weeks post-transduction (n=9). B. Immunophenotypic analysis of FGRS reprogrammed HUVECs (red and blue; n=3). C. Four weeks after FGRS-transduction and E4EC-induction, human GFP+CD45+CD34+ cells were sorted and seeded for CFC assay (n=3). Hematopoietic colonies arose in the CFC assay (magnificationx4); wide field (upper row) and corresponding fluorescent images (bottom row). Left to right: granulocytic-erythroid-monocytic-megakaryocytic (GEMM), Erythroid/Myeloid, and granulocytic-macrophage (GM) colonies, and hemoglobinized colonies. Graph shows CFC assay quantification. D. Wright-Giemsa stain of cells obtained from the CFC assay colonies. 60x magnification.
Figure 3
Figure 3. rEC-hMPPs are capable of in vivo erythro-myeloid-megakaryocytic multilineage engraftment
A. Reprogrammed HUVECs into rEC-hMPPs were transplanted into sub-lethally irradiated (275 Rad) mice (n=9). B. Circulating human CD45+ (hCD45+ ) cells were detected at 2 (n=7; 17.38±7.73%), 5 (n=6; 15.1±13.39%), 12 (n=6; 14.14±5.44%), 16 (n=6; 22.36±17.95%) and 22 to 44 (22–44) (n=6; 21.23±22.27%) weeks post transplantation. The 22–44 weeks engrafted mice were used for further analyses of the myelodysplasia and fibrotic changes (Extended Data Figure 8,9,10A). C. Analysis of the total mononuclear peripheral blood cells at 16 weeks post-transplantation of hCD45+and mouse CD45+(mCD45+) cells, revealed presence of hCD45+(15 9%) and human non-erythroid circulating cells (a). We gated on the FSC/SSC hCD45 erythroid compartment (Red gate) and typical human non-erythroid hCD45+ compartment (Blue gate)(b,c). D. rEC-hMPPs isolated from the host retained their multilineage potential in vitro; secondary CFC-assay. Engraftment of mouse bone marrow (BM) 22 weeks post-transplantation is shown (a). The cells were expanded in vitro for 24 hours (b) and FACS resorted for hCD45+hCD34+ cells for CFC assay. Wright-Giemsa stain (c) of the cytospin of the cells from CFC assay, (magnificationx100 right). Quantification of the CFC assay (d). E. Phenotypic analysis of an in vivo 22 weeks engrafted rEC-hMPPs in BM shows human CD45+Lin CD45RACD38CD90CD34+ MPPs. F. Identification of viral integration on a single-cell level. Whole genome amplification (WGA) of 21 hCD45+cells isolated from a host mouse (E). Quantification of the analysis is shown in the right graph. G. Identification of viral integration on a single-colony level. LinCD45RACD38CD90 CD34+cells (10 cells) were used for a CFC assay. We detected all four FGRS viral vectors in all CFC colonies tested (bottom image; Letters FOSB (F), GFI1 (G), RUNX1 (R), SPI1 (S) show PCR products specific for each of these factors in the first colony).
Figure 4
Figure 4. Functional and transcriptional analysis of adult hDMEC-derived rEC-hMPPs
A. Schematic representation of in vitro and in vivo functional tests of hDMEC-derived rEC-hMPPs. B. (a) Hematopoietic colonies observed in CFC assay (scale bar: 200µm); wide field (upper row). Wright-Giemsa stain of cells from CFC colonies (magnification x60) (bottom row). (b) Quantification of the CFC assay(n=3). (c) Immunophenotypic quantification of surface marker expression in CFU colonies(n=3). C. Global gene transcription profiling of in vitro generated CD45+ rEC-hMPPs (derived from hDMEC and HUVECs) and in vivo engrafted HUVEC-derived CD45+CD34+rEC-hMPPs, 22 weeks post-transplantation and hDMEC-derived CD45+CD34+rEC-hMPPs, 15 weeks post-secondary engraftment (4A). EC-endothelial cells, CB–cord blood cells. D. Comparison of expression of prototypical pluripotency genes shown in (4C). Human embryonic stem cells (hES). The data in C and D are presented as log2 (transcription level).
Figure 5
Figure 5. Adult human hDMECs-derived rEC-hMPPs are capable of in vivo primary and secondary multilineage engraftment
A. Analysis of PB of mice at 4, 6, and 12 weeks post-primary transplantation(n=6). Analysis of spleen and BM of mice at 14 weeks post-primary transplantation(n=3). B. Analysis of the PB of mice at 3, 5, 8 (n=6), 15 (n=4) and 23 (n=4) weeks post-secondary transplantation (n=6). FACS plots on the right show representative analysis of rEC-hMPP secondary engraftment. Mouse Ter119+ and human CD235+ erythroid populations were excluded to obtain an accurate estimation of hCD45+ and mCD45+cells. C. Clonal CFC assay of BM hCD45+hCD34+cells(n=3; left plot). Emerging colonies were counted and classified (middle table). CFC colonies derived from single plated hCD45+hCD34+ cell comprise of mixed-lineage erythroid and myeloid progenies(right plots). D. Reprogrammed cells isolated from the host retained their multi-lineage potential in vitro; secondary CFC assay. E. Schematic representation of steps of reprogramming of ECs into rEC-hMPP by FGRS.

Comment in

References

    1. Rafii S, et al. Human ESC-derived hemogenic endothelial cells undergo distinct waves of endothelial to hematopoietic transition. Blood. 2013;121:770–780. - PubMed
    1. Sturgeon CM, Ditadi A, Clarke RL, Keller G. Defining the path to hematopoietic stem cells. Nat Biotechnol. 2013;31:416–418. - PubMed
    1. Choi KD, et al. Identification of the hemogenic endothelial progenitor and its direct precursor in human pluripotent stem cell differentiation cultures. Cell reports. 2012;2:553–567. - PMC - PubMed
    1. Pereira CF, et al. Induction of a hemogenic program in mouse fibroblasts. Cell Stem Cell. 2013;13:205–218. - PMC - PubMed
    1. Szabo E, et al. Direct conversion of human fibroblasts to multilineage blood progenitors. Nature. 2010;468:521–526. - PubMed

Publication types

MeSH terms

Substances

Associated data