

Copy number variants (CNVs) analysis in a deeply phenotyped cohort of individuals with intellectual disability (ID)
- PMID: 25030379
- PMCID: PMC4107469
- DOI: 10.1186/1471-2350-15-82
Copy number variants (CNVs) analysis in a deeply phenotyped cohort of individuals with intellectual disability (ID)
Abstract
Background: DNA copy number variants (CNVs) are found in 15% of subjects with ID but their association with phenotypic abnormalities has been predominantly studied in smaller cohorts of subjects with detailed yet non-systematically categorized phenotypes, or larger cohorts (thousands of cases) with smaller number of generalized phenotypes.
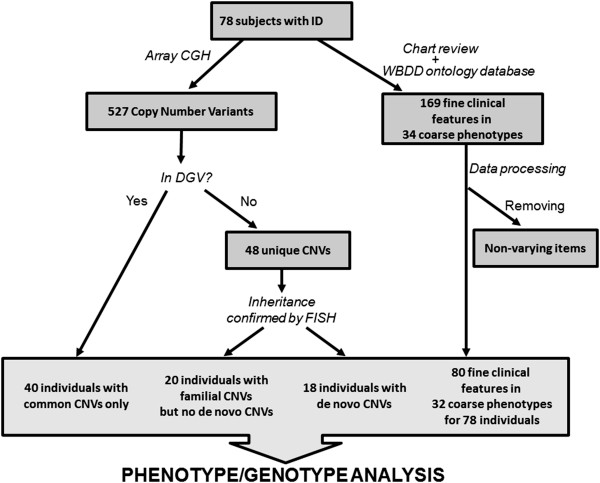
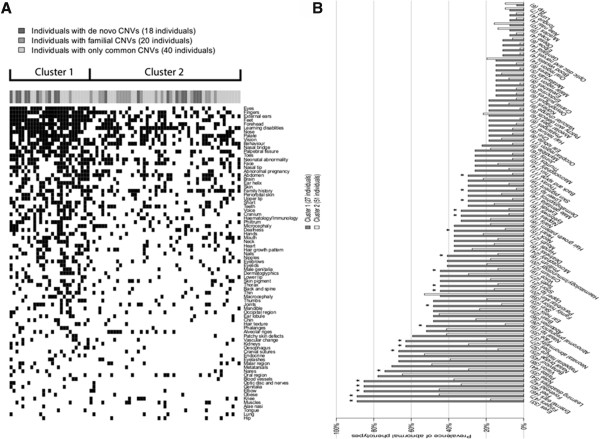
Methods: We evaluated the association of de novo, familial and common CNVs detected in 78 ID subjects with phenotypic abnormalities classified using the Winter-Baraitser Dysmorphology Database (WBDD) (formerly the London Dysmorphology Database). Terminology for 34 primary (coarse) and 169 secondary (fine) phenotype features were used to categorize the abnormal phenotypes and determine the prevalence of each phenotype in patients grouped by the type of CNV they had.
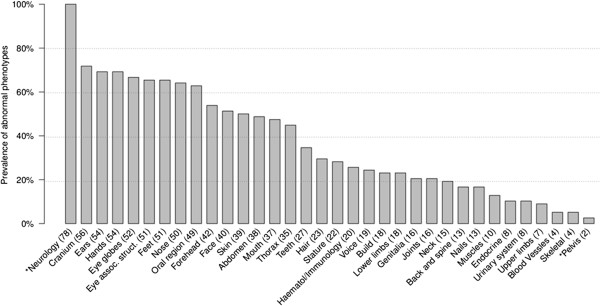
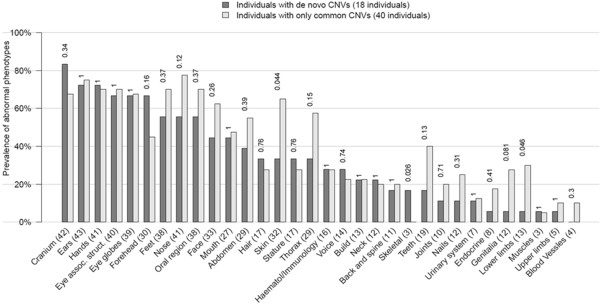
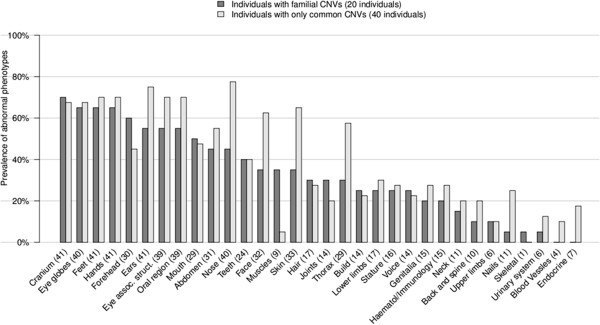
Results: In our cohort more than 50% of cases had abnormalities in primary categories related to head (cranium, forehead, ears, eye globes, eye associated structures, nose) as well as hands and feet. The median number of primary and secondary abnormalities was 12 and 18 per subject, respectively, indicating that the cohort consisted of subjects with a high number of phenotypic abnormalities (median De Vries score for the cohort was 5). The prevalence of each phenotypic abnormality was comparable in patients with de novo or familial CNVs in comparison to those with only common CNVs, although a trend for increased frequency of cranial and forehead abnormalities was noted in subjects with rare de novo and familial CNVs. Two clusters of subjects were identified based on the prevalence of each fine phenotypic feature, with an average of 28.3 and 13.5 abnormal phenotypes/subject in the two clusters respectively (P < 0.05).
Conclusions: Our study is a rare example of using standardized, deep morphologic phenotype clustering with phenotype/CNV correlation in a cohort of subjects with ID. The composition of the cohort inevitably influences the phenotype/genotype association, and our studies show that the influence of the de novo CNVs on the phenotype is less obvious in cohorts consisting of subjects with a high number of phenotypic abnormalities. The outcome of phenotype/genotype analysis also depends on the choice of phenotypes assessed and standardized phenotyping is required to minimize variability.
Figures
Similar articles
-
miRNA and miRNA target genes in copy number variations occurring in individuals with intellectual disability.BMC Genomics. 2013 Aug 10;14:544. doi: 10.1186/1471-2164-14-544. BMC Genomics. 2013. PMID: 23937676 Free PMC article.
-
Clinical significance of de novo and inherited copy-number variation.Hum Mutat. 2013 Dec;34(12):1679-87. doi: 10.1002/humu.22442. Epub 2013 Oct 10. Hum Mutat. 2013. PMID: 24038936
-
The clinical benefit of array-based comparative genomic hybridization for detection of copy number variants in Czech children with intellectual disability and developmental delay.BMC Med Genomics. 2019 Jul 23;12(1):111. doi: 10.1186/s12920-019-0559-7. BMC Med Genomics. 2019. PMID: 31337399 Free PMC article.
-
Copy number variants are frequent in genetic generalized epilepsy with intellectual disability.Neurology. 2013 Oct 22;81(17):1507-14. doi: 10.1212/WNL.0b013e3182a95829. Epub 2013 Sep 25. Neurology. 2013. PMID: 24068782 Free PMC article. Review.
-
Pathogenic or not? Assessing the clinical relevance of copy number variants.Clin Genet. 2013 Nov;84(5):415-21. doi: 10.1111/cge.12242. Epub 2013 Aug 21. Clin Genet. 2013. PMID: 23895381 Review.
Cited by
-
Inherited duplication of the pseudoautosomal region Xq28 in a subject with Gilles de la Tourette syndrome and intellectual disability: a case report.Mol Cytogenet. 2020 Jun 22;13:23. doi: 10.1186/s13039-020-00493-3. eCollection 2020. Mol Cytogenet. 2020. PMID: 32582378 Free PMC article.
-
Genetics of strabismus.Front Ophthalmol (Lausanne). 2023;3:1233866. doi: 10.3389/fopht.2023.1233866. Epub 2023 Jul 20. Front Ophthalmol (Lausanne). 2023. PMID: 38500555 Free PMC article.
-
Copy Number Variations in a Cohort of 420 Individuals with Neurodevelopmental Disorders From the South of Brazil.Sci Rep. 2019 Nov 28;9(1):17776. doi: 10.1038/s41598-019-54347-z. Sci Rep. 2019. PMID: 31780800 Free PMC article.
-
Phenotypic Characterization of Intellectual Disability Caused by MBOAT7 Mutation in Two Consanguineous Pakistani Families.Front Pediatr. 2020 Dec 1;8:585053. doi: 10.3389/fped.2020.585053. eCollection 2020. Front Pediatr. 2020. PMID: 33335874 Free PMC article.
-
Molecular Characterization of Koolen De Vries Syndrome in Two Girls with Idiopathic Intellectual Disability from Central Brazil.Mol Syndromol. 2017 May;8(3):155-160. doi: 10.1159/000456910. Epub 2017 Feb 24. Mol Syndromol. 2017. PMID: 28588437 Free PMC article.
References
-
- Chelly J, Khelfaoui M, Francis F, Cherif B, Bienvenu T. Genetics and pathophysiology of mental retardation. Eur J Hum Genet. 2006;15:701–713. - PubMed
-
- Roeleveld N, Zielhuis GA, Gabreels F. The prevalence of mental retardation: a critical review of recent literature. Dev Med Child Neurol. 1997;15:125–132. - PubMed
-
- Curry CJ, Stevenson RE, Aughton D, Byrne J, Carey JC, Cassidy S, Cunniff C, Graham JM Jr, Jones MC, Kaback MM, Moeschler J, Schaefer GB, Schwartz S, Tarleton J, Opitz J. Evaluation of mental retardation: recommendations of a Consensus Conference: American College of Medical Genetics. Am J Med Genet. 1997;15:468–477. - PubMed
-
- Koolen DA, Pfundt R, de Leeuw N, Hehir-Kwa JY, Nillesen WM, Neefs I, Scheltinga I, Sistermans E, Smeets D, Brunner HG, van Kessel AG, Veltman JA, de Vries BB. Genomic microarrays in mental retardation: a practical workflow for diagnostic applications. Hum Mutat. 2009;15:283–292. - PubMed
-
- Miller DT, Adam MP, Aradhya S, Biesecker LG, Brothman AR, Carter NP, Church DM, Crolla JA, Eichler EE, Epstein CJ, Faucett WA, Feuk L, Friedman JM, Hamosh A, Jackson L, Kaminsky EB, Kok K, Krantz ID, Kuhn RM, Lee C, Ostell JM, Rosenberg C, Scherer SW, Spinner NB, Stavropoulos DJ, Tepperberg JH, Thorland EC, Vermeesch JR, Waggoner DJ, Watson MS. et al.Consensus statement: chromosomal microarray is a first-tier clinical diagnostic test for individuals with developmental disabilities or congenital anomalies. Am J Hum Genet. 2010;15:749–764. - PMC - PubMed
Publication types
MeSH terms
Grants and funding
LinkOut - more resources
Full Text Sources
Other Literature Sources
