

Consumption of added sugars among US children and adults by food purchase location and food source
- PMID: 25030785
- PMCID: PMC4135498
- DOI: 10.3945/ajcn.114.089458
Consumption of added sugars among US children and adults by food purchase location and food source
Abstract
Background: The proposed changes to the Nutrition Facts Label by the US Food and Drug Administration will include information on added sugars for the first time.
Objective: The objective was to evaluate the sources of added sugars in the diets of a representative sample of US children and adults by food purchase location and food source (eg, food group).
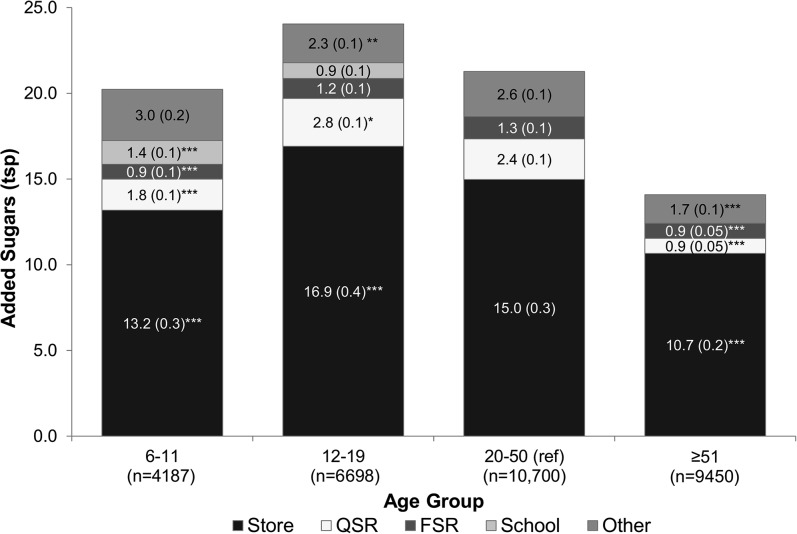
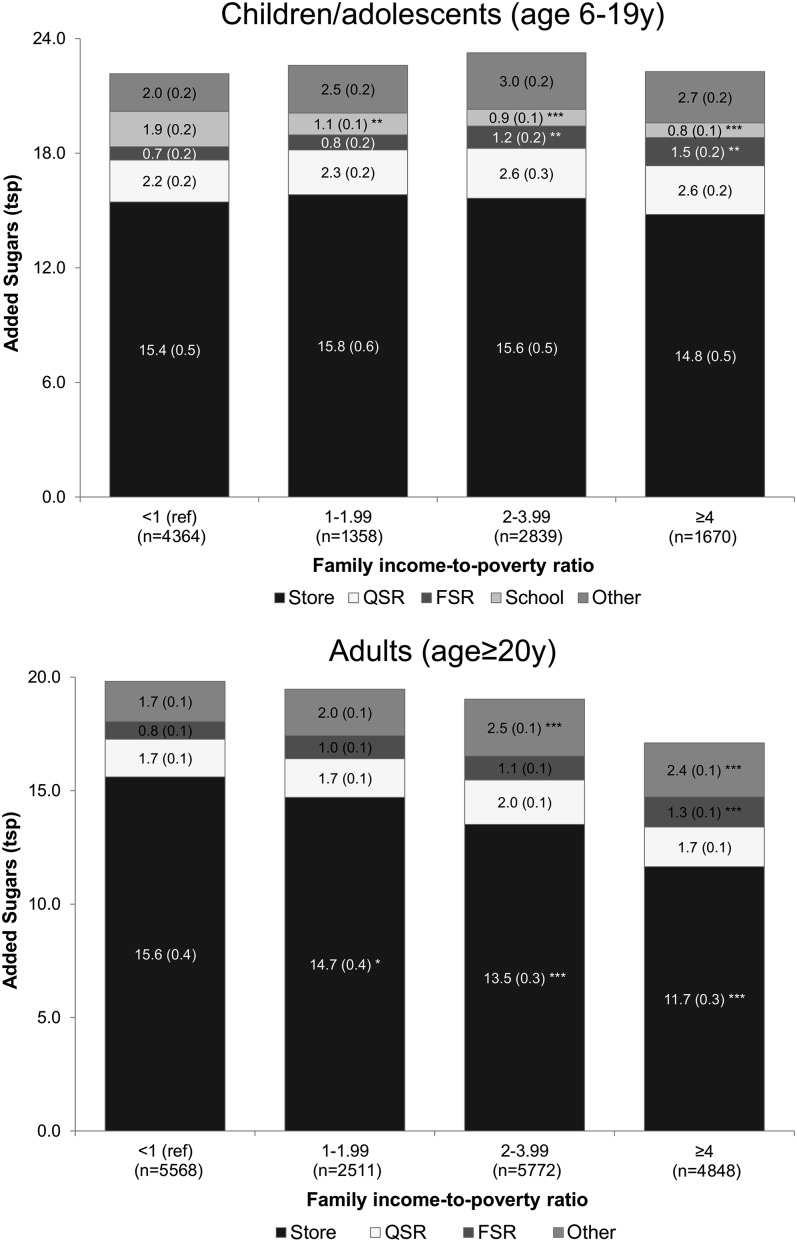
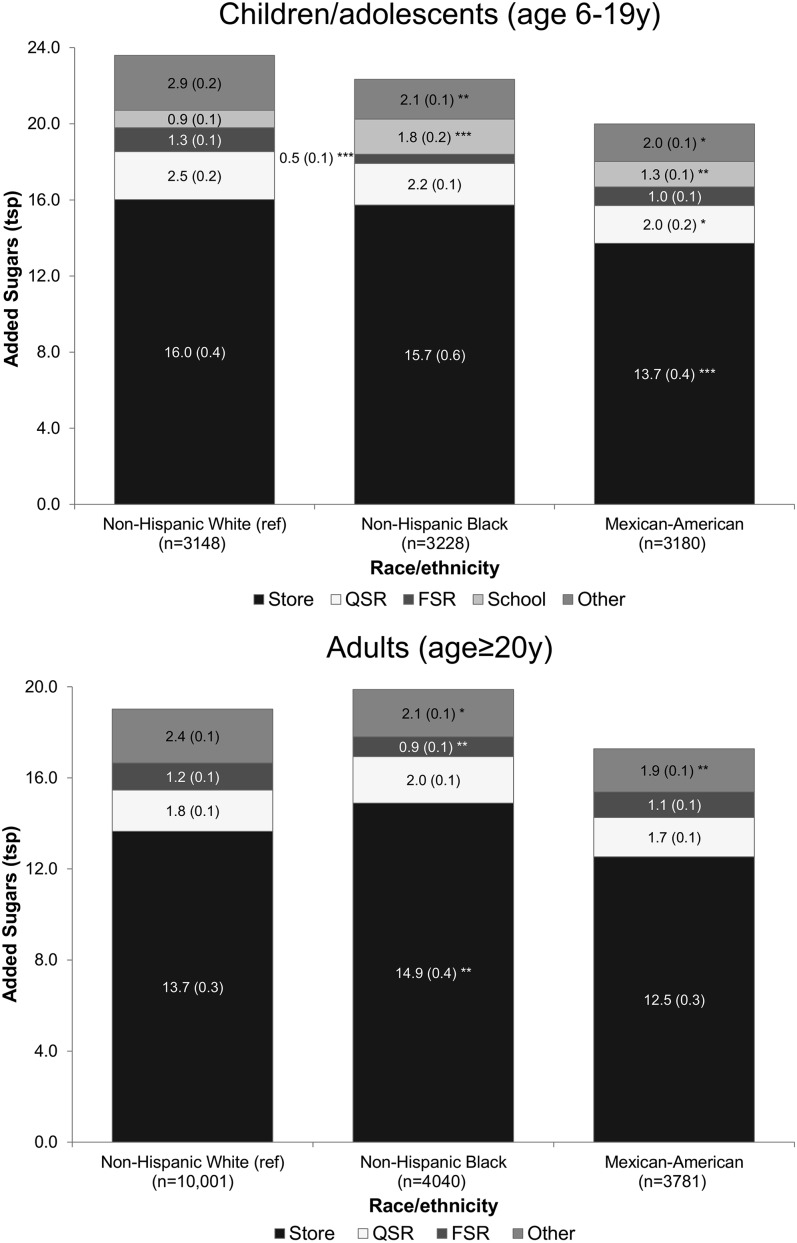
Design: This cross-sectional study among 31,035 children, adolescents, and adults aged ≥6 y from the 2003-2004, 2005-2006, 2007-2008, and 2009-2010 NHANES used data from a 24-h dietary recall to evaluate consumption of added sugars. Food locations of origin were identified as stores (supermarket or grocery store), quick-service restaurants/pizza (QSRs), full-service restaurants (FSRs), schools, and others (eg, vending machines or gifts). Added sugars consumption by food purchase location was evaluated by age, family income-to-poverty ratio, and race-ethnicity. Food group sources of added sugars were identified by using the National Cancer Institute food categories.
Results: Added sugars accounted for ∼14.1% of total dietary energy. Between 65% and 76% of added sugars came from stores, 6% and 12% from QSRs, and 4% and 6% from FSRs, depending on age. Older adults (aged ≥51 y) obtained a significantly greater proportion of added sugars from stores than did younger adults. Lower-income adults obtained a significantly greater proportion of added sugars from stores than did higher-income adults. Intake of added sugars did not vary by family income among children/adolescents. Soda and energy and sports drinks were the largest food group sources of added sugars (34.4%), followed by grain desserts (12.7%), fruit drinks (8.0%), candy (6.7%), and dairy desserts (5.6%).
Conclusions: Most added sugars came from foods obtained from stores. The proposed changes to the Nutrition Facts Label should capture the bulk of added sugars in the US food supply, which suggests that the recommended changes have the potential to reduce added sugars consumption.
© 2014 American Society for Nutrition.
Figures
References
-
- Ervin RB, Ogden CL. Consumption of added sugars among U.S. adults, 2005-2010. NCHS Data Brief 2013;122:1–8.. - PubMed
-
- Ervin RB, Kit BK, Carroll MD, Ogden CL. Consumption of added sugar among U.S. children and adolescents, 2005-2008. NCHS Data Brief 2012;87:1–8.. - PubMed
-
- Van Horn L, Johnson RK, Flickinger BD, Vafiadis DK, Yin-Piazza S, Added Sugars Conference Planning Group. Translation and implementation of added sugars consumption recommendations: a conference report from the American Heart Association Added Sugars Conference 2010. Circulation 2010;122:2470–90. - PubMed
Publication types
MeSH terms
Substances
Grants and funding
LinkOut - more resources
Full Text Sources
Other Literature Sources
