. 2014 Aug;42(14):9313-26.
doi: 10.1093/nar/gku544. Epub 2014 Jul 16.

Embryonic stem cell-specific microRNAs contribute to pluripotency by inhibiting regulators of multiple differentiation pathways

Affiliations

Embryonic stem cell-specific microRNAs contribute to pluripotency by inhibiting regulators of multiple differentiation pathways

Andreas J Gruber et al. Nucleic Acids Res. 2014 Aug.

Abstract

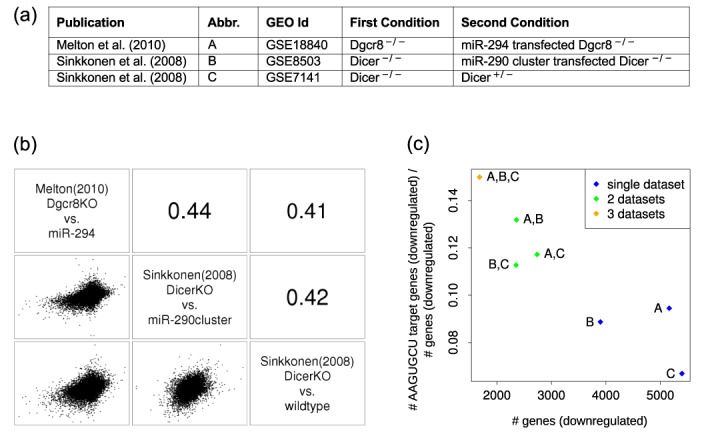
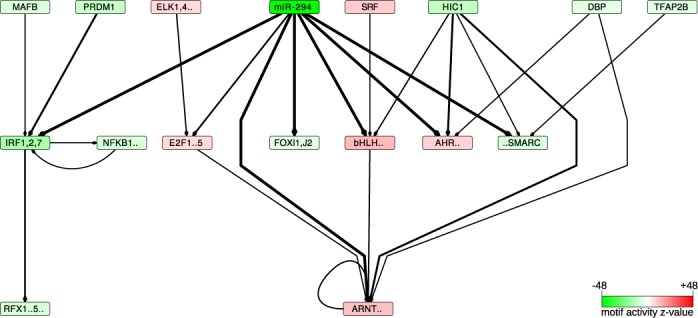
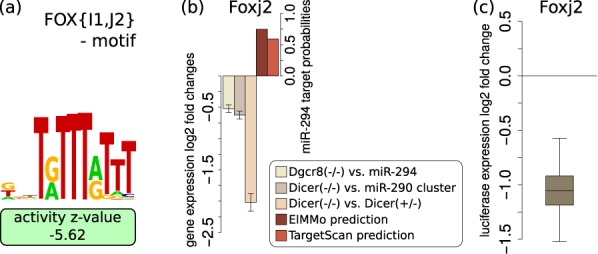
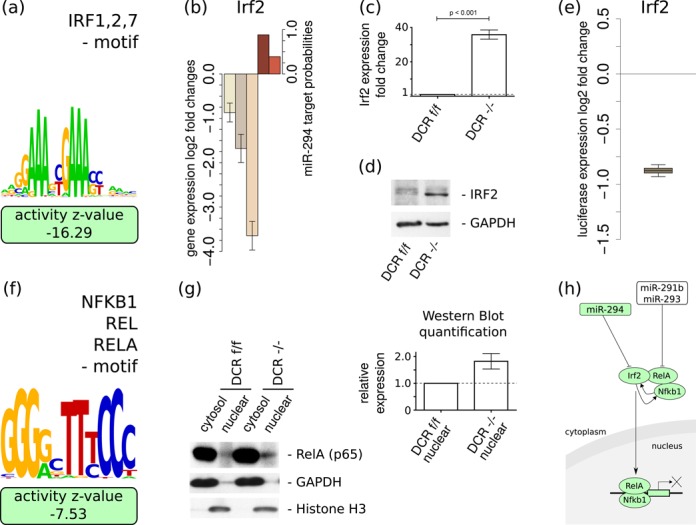
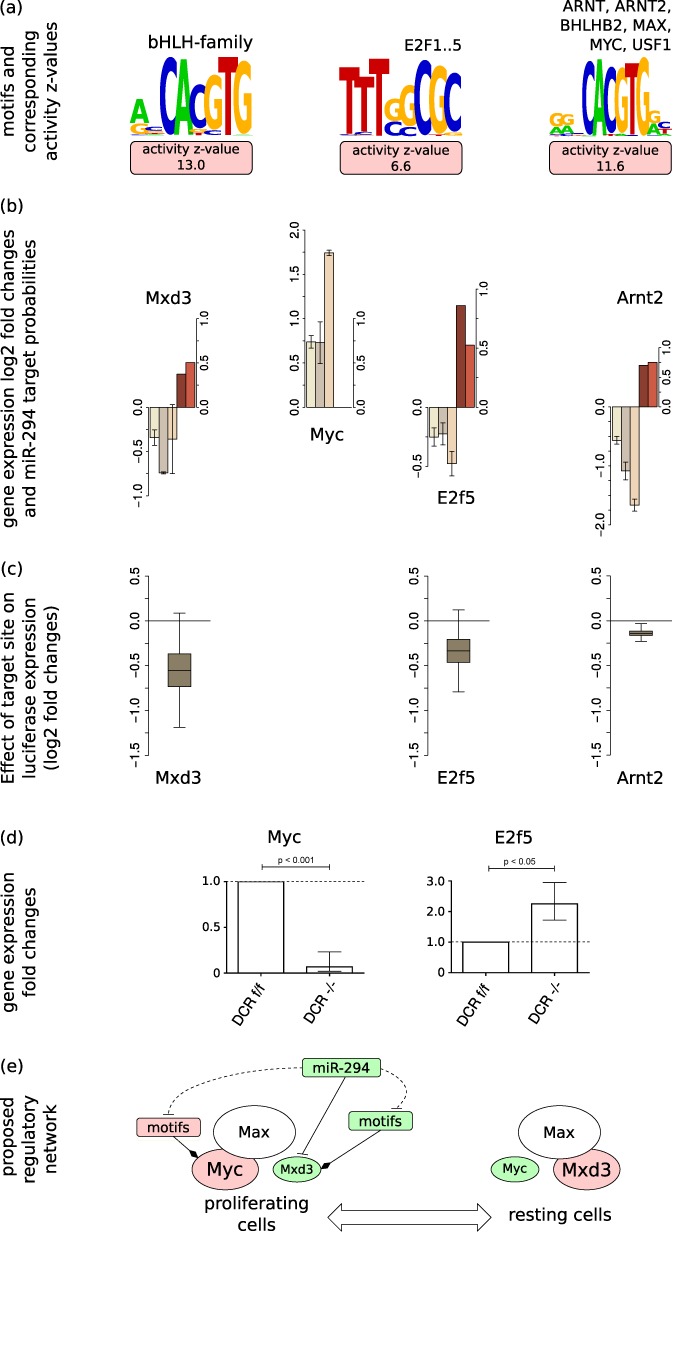
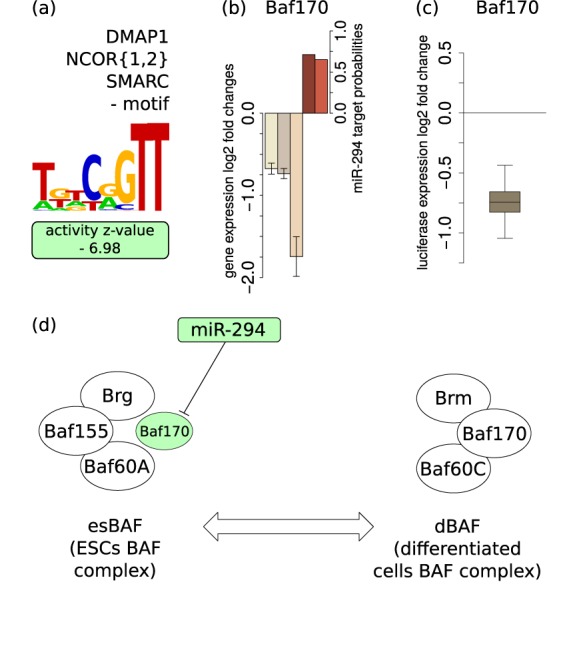
The findings that microRNAs (miRNAs) are essential for early development in many species and that embryonic miRNAs can reprogram somatic cells into induced pluripotent stem cells suggest that these miRNAs act directly on transcriptional and chromatin regulators of pluripotency. To elucidate the transcription regulatory networks immediately downstream of embryonic miRNAs, we extended the motif activity response analysis approach that infers the regulatory impact of both transcription factors (TFs) and miRNAs from genome-wide expression states. Applying this approach to multiple experimental data sets generated from mouse embryonic stem cells (ESCs) that did or did not express miRNAs of the ESC-specific miR-290-295 cluster, we identified multiple TFs that are direct miRNA targets, some of which are known to be active during cell differentiation. Our results provide new insights into the transcription regulatory network downstream of ESC-specific miRNAs, indicating that these miRNAs act on cell cycle and chromatin regulators at several levels and downregulate TFs that are involved in the innate immune response.


Figures

Figure 1.
Figure 1.
Overview of the mRNA expression data sets—(a) Data sources. (b) Matrix of scatter plots (below diagonal) and Pearson's correlation coefficients (above diagonal) of per-gene log2 fold changes in pairs of experiments. The names of the individual data sets are shown on the diagonal. (c) Proportion of predicted targets of the AAGUGCU seed family of miRNAs (TargetScan aggregate PCT score based predictions (4)) among genes that are consistently downregulated in all three (orange), pairs (green) or individual data sets (blue) (indicated by the labels, key given in the ‘Abbr.’ column of the table in panel (a)), plotted against the number of genes that are consistently downregulated in all of the considered data sets.
Figure 2.
Figure 2.
The transcriptional network inferred to be affected by the miRNAs of the AAGUGCU seed family (represented by miR-294)—A directed edge was drawn from a motif A to a motif B if A was consistently (across data sets) predicted to regulate a TF b whose sequence specificity is represented by motif B. The thickness of the edge is proportional to the product of the probabilities that A targets b. For the clarity of the figure, only motifs with absolute z-values >5 and only edges with a target probability product >0.3 are shown. The intensity of the color of a box representing a motif is proportional to the significance of the motif (the corresponding formula image-values can be found in Supplementary Table S3). Red indicates an increase and green a decrease in activity, corresponding to increased and decreased expression, respectively, of the tagets of the motif when the miRNAs are expressed. The full motif names as well as the corresponding TFs are listed in Supplementary Table S7.
Figure 3.
Figure 3.
Foxj2 is a direct target of miR-294—(a) The ‘FOX{I1,J2}’ motif shows a negative change in activity in the presence of miR-294. (b) Foxj2 mRNA log2 fold changes (±1.96*SEM; n = 3) in the Melton et al. Dgcr8−/ − versus miR-294 transfection (yellow), Sinkkonen et al. Dicer−/ − versus miR-290-295 cluster transfection (dark brown) and Dicer−/ − versus Dicer+/ − (light brown) data sets, as well as the prediction scores for these genes as targets of miR-294 as given by ElMMo (30) (dark red) and TargetScan (aggregate PCT) (4) (light red). (c) A luciferase reporter construct carrying the 3′UTR of Foxj2 is downregulated upon co-transfection with miR-294 relative to a construct carrying the Foxj2 3′UTR but with a mutated miR-294 target site (n = 9).
Figure 4.
Figure 4.
miR-294 targets the Irf2 TF and modulates ‘IRF1,2,7’ and ‘NFKB1_REL_RELA’ activities—(a) The activity of the ‘IRF1,2,7’ motif is strongly decreased in the presence of miR-294. (b) The expression of Irf2 is downregulated within all analysed data sets (±1.96*SEM; n = 3) and Irf2 is predicted by ElMMo and TargetScan to be a direct target of miR-294 (color scheme as in Figure 3). Low levels of Irf2 mRNA (c) and protein (d) in DCRflox/flox ES cells compared to miRNA deficient DCR−/ − ESCs are observed with qRT-PCR and western blot, respectively. qRT-PCR experiments were run in triplicate (± SEM; n = 3). (e) The luciferase reporter construct carrying the Irf2 3′UTR shows a strong response to miR-294 co-transfection compared to a similar construct but with a mutated Irf2 target site (n = 9). (f) Sequence logo of the ‘NFKB1_REL_RELA’ motif that is associated with the canonical NF-κB pathway and that exhibits a significant decrease in activity in the presence of miR-294. (g) Western blots of RelA, GAPDH and Histone H3 in nuclear and cytoplasmic fractions in ESCs that do and do not express miRNAs. The densitometric quantification indicates an increased level of nuclear RelA in the DCR−/ − ESCs compared to DCRflox/flox ESCs (± SEM; n = 3). (h) Proposed model of the inhibitory effect of miR-290-295 cluster miRNAs on the canonical NF-κB pathway in pluripotent stem cells. Regulatory motifs are denoted by colored rectangles and individual genes by ovals. See text for the evidence of individual interactions.
Figure 5.
Figure 5.
miR-294 impacts cell cycle regulation at multiple levels—(a) MARA analysis reveals that miR-294 induces positive activity changes of multiple motifs involved in cell cycle regulation. Shown are the sequence logos of these motifs: the Myc- and Arnt2-associated motif ‘ARNT_ARNT2_BHLHB2_MAX_MYC_USF1’, the putative Myc-regulating ‘E2F1..5′ motif and the Mxd3-associated ‘bHLH-family’ motif. (b) log2 mRNA fold changes (±1.96*SEM; n = 3) of Myc, Arnt2, E2f5 and Mxd3 (color scheme as in Figure 3) in the analyzed data sets. (c) Luciferase constructs carrying the 3′UTR of Arnt2, E2f5 or Mxd3, respectively, are downregulated upon co-transfection with miR-294 relative to constructs carrying the same 3′UTRs but with mutated miR-294 binding sites (n = 9). (d) qRT-PCR shows decreased expression of Myc and increased expression of E2f5 in DCR−/ − ESCs relative to DCRflox/flox ESCs. qRT-PCR experiments were run in triplicate (±SEM; n = 3). (e) Proposed model of miR-294-dependent regulation of the Myc-Max/Mxd-Max network. Shapes scheme is as in Figure 4. Green or red shapes represent negative or positive changes (in motif activities or gene expression fold changes), respectively. Dashed lines indicate indirect and solid lines direct regulatory links between motifs/genes.
Figure 6.
Figure 6.
The BAF170 (Smarcc2) component of the dBAF chromatin remodeling complex is a direct target of miR-294—(a) MARA analysis reveals a negative activity change of the ‘DMAP1_NCOR{1,2}_SMARC’ motif in the presence of miR-294. (b) Expression of BAF170 (Smarcc2) is consistently downregulated in the presence of miR-294 in all considered experimental data sets (±1.96*SEM; n = 3; color scheme as in Figure 3). (c) A luciferase construct carrying the BAF170 3′UTR is downregulated upon co-transfection with miR-294 relative to a construct carrying a mutated 3′UTR (n = 9). (d) Model of the possible involvement of miR-294 in the maintenance of the ESC-specific chromatin remodeling complex esBAF. The miRNA-induced reduction in BAF170 levels may contribute to the maintenance of appropriate levels of esBAF complexes in ESCs thereby maintaining self-renewal and proliferation (48). Color, shapes and lines scheme is as in Figure 5.

References

    1. Bartel D.P. MicroRNAs: genomics, biogenesis, mechanism, and function. Cell. 2004;116:281–297. - PubMed
    1. Lim L.P., Lau N.C., Garrett-Engele P., Grimson A., Schelter J.M., Castle J., Bartel D.P., Linsley P.S., Johnson J.M. Microarray analysis shows that some microRNAs downregulate large numbers of target mRNAs. Nature. 2005;433:769–773. - PubMed
    1. Selbach M., Schwanhäusser B., Thierfelder N., Fang Z., Khanin R., Rajewsky N. Widespread changes in protein synthesis induced by microRNAs. Nature. 2008;455:58–63. - PubMed
    1. Friedman R.C., Farh K.K.-H., Burge C.B., Bartel D.P. Most mammalian mRNAs are conserved targets of microRNAs. Genome Res. 2009;19:92–105. - PMC - PubMed
    1. Kanellopoulou C., Muljo S.A., Kung A.L., Ganesan S., Drapkin R., Jenuwein T., Livingston D.M., Rajewsky K.C.P. Dicer-deficient mouse embryonic stem cells are defective in differentiation and centromeric silencing. Genes Dev. 2005;19:489–501. - PMC - PubMed

Publication types