. 2015 Sep;220(5):2983-96.
doi: 10.1007/s00429-014-0839-0. Epub 2014 Jul 17.

Expression profile analysis of hippocampal CA1 pyramidal neurons in aged Ts65Dn mice, a model of Down syndrome (DS) and Alzheimer's disease (AD)

Affiliations

Expression profile analysis of hippocampal CA1 pyramidal neurons in aged Ts65Dn mice, a model of Down syndrome (DS) and Alzheimer's disease (AD)

Melissa J Alldred et al. Brain Struct Funct. 2015 Sep.

Abstract

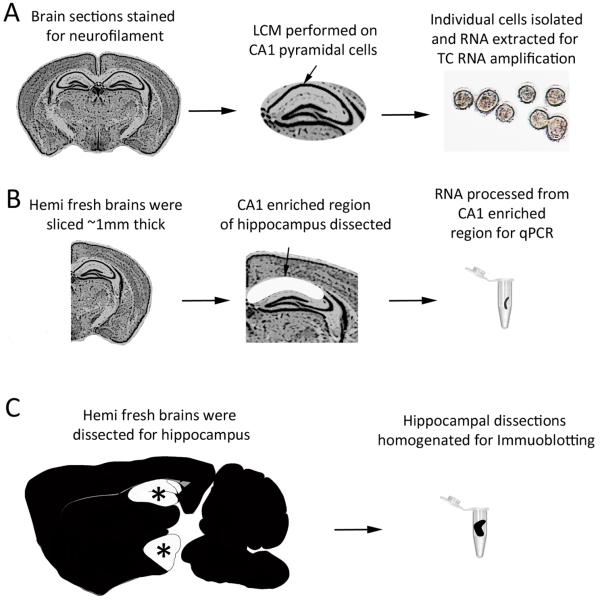
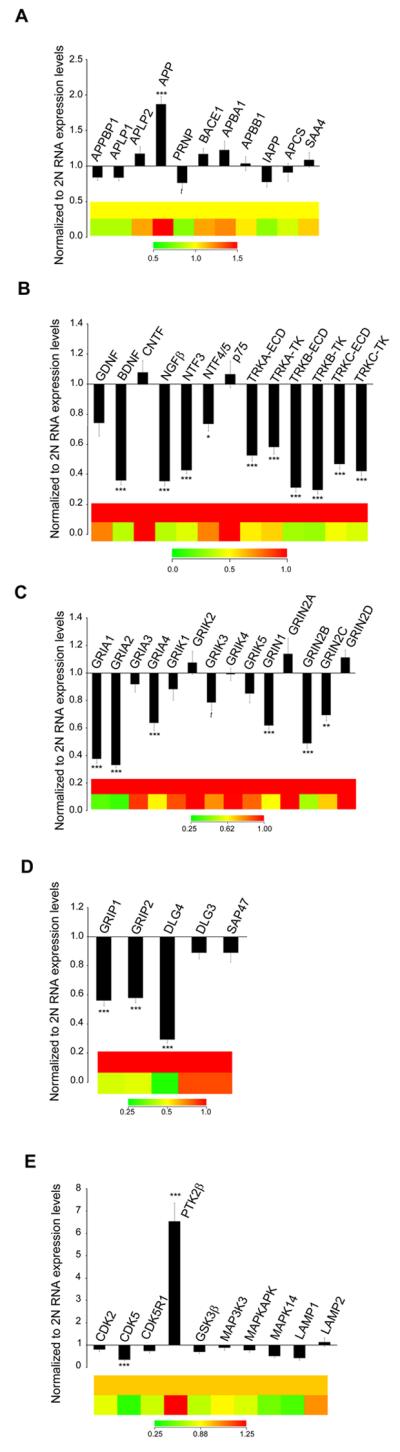
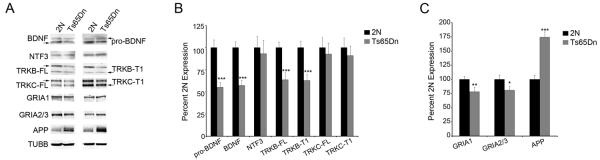
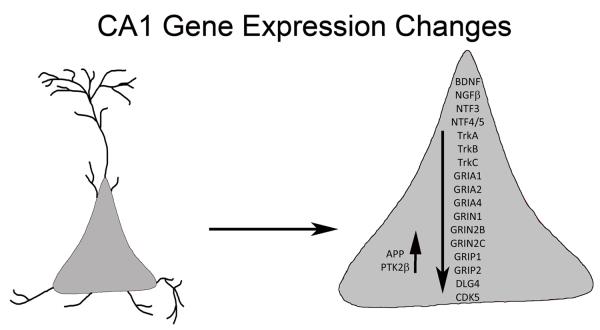
Down syndrome (DS) is caused by the triplication of human chromosome 21 (HSA21) and is the most common genetic cause of intellectual disability, with individuals having deficits in cognitive function including hippocampal learning and memory and neurodegeneration of cholinergic basal forebrain neurons, a pathological hallmark of Alzheimer's disease (AD). To date, the molecular underpinnings driving this pathology have not been elucidated. The Ts65Dn mouse is a segmental trisomy model of DS and like DS/AD pathology, displays age-related cognitive dysfunction and basal forebrain cholinergic neuron (BFCN) degeneration. To determine molecular and cellular changes important for elucidating mechanisms of neurodegeneration in DS/AD pathology, expression profiling studies were performed. Molecular fingerprinting of homogeneous populations of Cornu Ammonis 1 (CA1) pyramidal neurons was performed via laser capture microdissection followed by Terminal Continuation RNA amplification combined with custom-designed microarray analysis and subsequent validation of individual transcripts by qPCR and protein analysis via immunoblotting. Significant alterations were observed within CA1 pyramidal neurons of aged Ts65Dn mice compared to normal disomic (2N) littermates, notably in excitatory and inhibitory neurotransmission receptor families and neurotrophins, including brain-derived neurotrophic factor as well as several cognate neurotrophin receptors. Examining gene and protein expression levels after the onset of BFCN degeneration elucidated transcriptional and translational changes in neurons within a vulnerable circuit that may cause the AD-like pathology seen in DS as these individuals age, and provide rational targets for therapeutic interventions.


Figures

Figure 1
Figure 1. Representation of LCM, microdissection, and regional dissections for microarray, qPCR, and immunoblotting, respectively
(A) Paraffin-embedded brain tissue is depicted with CA1 pyramidal neurons isolated by LCM and purification for microarray studies. (B) qPCR was performed on RNA purified from CA1 enriched microdissected fresh tissue. (C) Immunoblotting was performed on whole hippocampi dissected from individual mouse hemibrains.
Figure 2
Figure 2. Microarray observations from Ts65Dn CA1 pyramidal neurons
Bar graphs and color coded heatmaps illustrating transcript levels in Ts65Dn (n = 13) and 2N (n = 12) mice at 10-24 months of age in CA1 neurons. (A) APP (but not other AD-related genes) showed upregulation in aged Ts65Dn mice, while PRNP showed a trend toward downregulation compared to 2N controls. (B) The majority of neurotrophins and their cognate neurotrophin receptors showed significant downregulation including BDNF, NGFβ, NTF3, and NTF4/5 and the TrkA, TrkB and TrkC receptors (both the ECD and TK domains were examined) while the p75NTR(TNFR) receptor was unchanged. (C) Downregulation of select GluR subunits included AMPA receptor subunits GRIA1, GRIA2, and GRIA4, kainite receptor subunit GRIK3 (trend) and NMDA receptor subunits GRIN1, GRIN2B and GRIN2C is demonstrated. (D) GluR-interacting proteins also showed downregulation including GRIP1, GRIP2, and DLG4 (PSD-95). (E) Cyclin dependant kinase (CDK5) gene showed downregulation along with the small subunit of calpain while the protein tyrosine kinase 2B gene (PTK2B) showed significant upregulation.(*p < 0.01), (**p < 0.005), and (*** p < 0.001) (t= trend p < 0.07). Error bars indicate standard error of the mean (SEM).
Figure 3
Figure 3. Validation of select microarray findings via qPCR
(A) Significant downregulation of the GluR subunits GRIA1 and GRIA2, but not GRIA3 or GRIA4 is shown. The NMDA receptor GRIN1 subunit displayed a near-trend toward downregulation. DLG4 (PSD-95) also was downregulated. (B) BDNF and the NGF receptor TrkA (NTRK1) and the BDNF receptor TrkB (NTRK2) showed significant downregulation, in accordance with the microarray results. The NTF3 receptor TrkC (NTRK3) was not differentially regulated. (C) The small subunit of calpain (CAPNS1) was unchanged, whereas the alpha-adrenergic 1B receptor (ADRA1B) was downregulated. Key, (* p < 0.05), (** p < 0.02), and (*** p < 0.001). Error bars indicate SEM.
Figure 4
Figure 4. Immunoblotting of hippocampal dissections showed changes in protein levels consistent with mRNA expression level changes
Immunoblot analysis using regional hippocampal dissections was performed to assess whether selected transcriptional alterations resulted in commensurate protein level changes in Ts65Dn mice compared to 2N littermates at 18-24 months of age. (A) Representative immunoblots were obtained from 18-24 month old 2N and Ts65Dn mice for GRIA1, GRIA2/3, NTF3, pro-BDNF, mature BDNF, TrkB full length (TrkB-FL), truncated TrkB (TrkB-T1), TrkC full length TrkC-FL), truncated TrkC (TrkC-T1) and APP. β-tubulin (TUBB) expression was used as a loading control. (B) Normalized expression levels compared to TUBB expression show significant downregulation of TrkB-FL (p<0.0001), TrkB-T1 (p<0.0001), pro-BDNF (p<0.0001) and BDNF (p<0.0001). NTF3, TrkC and TrkC-T1 showed no difference in protein expression levels. (C) GluR subunits GRIA1 (p<0.0015) and GRIA2/3 (p<0.02) showed significant downregulation, while APP (p<0.0001) was upregulated compared to controls. Expression level data was normalized to TUBB expression ± SD.
Figure 5
Figure 5
Schematic representation of gene expression level changes as observed within CA1 pyramidal neurons in aged Ts65Dn mice compared to 2N littermates

References

    1. Akeson E, Lambert J. Ts65Dn-localization of the translocation breakpoint and trisomic gene content in a mouse model for Down syndrome. Cytogenet Cell Genet. 2001;276:270–276. - PubMed
    1. Alldred MJ, Che S, Ginsberg SD. Terminal Continuation (TC) RNA amplification enables expression profiling using minute RNA input obtained from mouse brain. Int J Mol Sci. 2008;9:2091–2104. - PMC - PubMed
    1. Alldred MJ, Che S, Ginsberg SD. Terminal continuation (TC) RNA amplification without second strand synthesis. J Neurosci Methods. 2009;177:381–385. - PMC - PubMed
    1. Alldred MJ, Duff KE, Ginsberg SD. Microarray analysis of CA1 pyramidal neurons in a mouse model of tauopathy reveals progressive synaptic dysfunction. Neurobiol Dis. 2012;45:751–762. - PMC - PubMed
    1. Applied Biosystems Guide to Performing Relative Quantitation of Gene Expression Using Real-Time Quantitative PCR. Gene Expr. 2008;2009:1–60.

Publication types