. 2014 Jul 16;34(29):9551-61.
doi: 10.1523/JNEUROSCI.4889-13.2014.

Cortical neurodynamics of inhibitory control

Affiliations

Cortical neurodynamics of inhibitory control

Kai Hwang et al. J Neurosci. .

Abstract

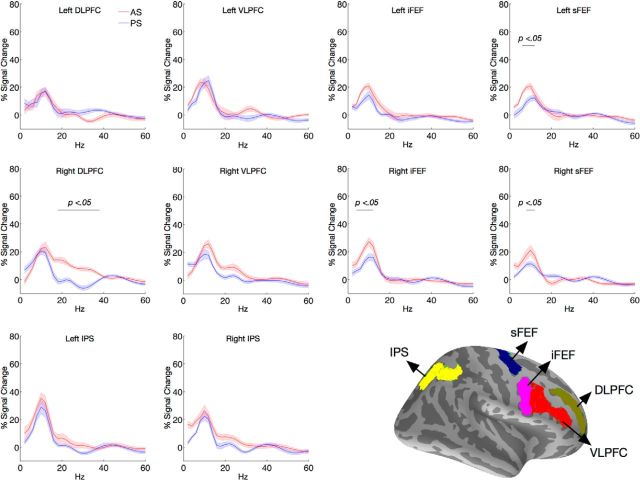
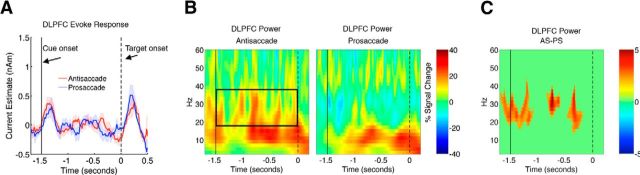
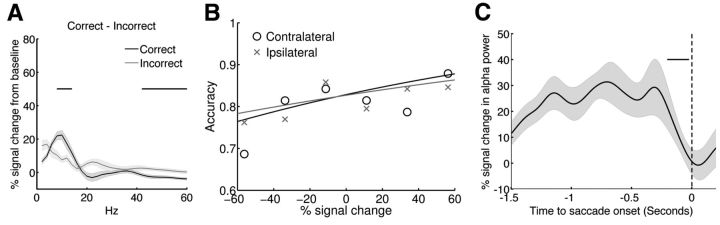
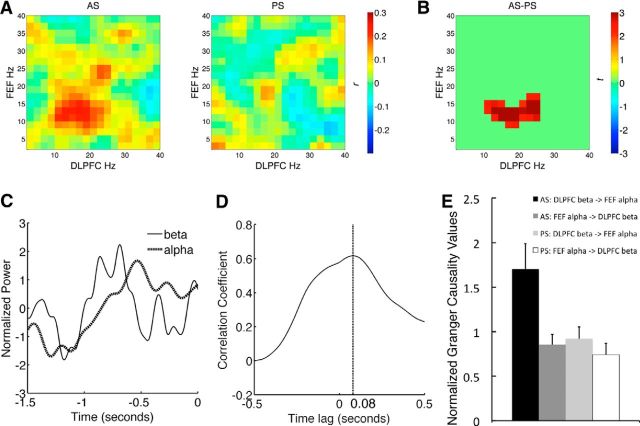
The ability to inhibit prepotent responses is critical for successful goal-directed behaviors. To investigate the neural basis of inhibitory control, we conducted a magnetoencephalography study where human participants performed the antisaccade task. Results indicated that neural oscillations in the prefrontal cortex (PFC) showed significant task modulations in preparation to suppress saccades. Before successfully inhibiting a saccade, beta-band power (18-38 Hz) in the lateral PFC and alpha-band power (10-18 Hz) in the frontal eye field (FEF) increased. Trial-by-trial prestimulus FEF alpha-band power predicted successful saccadic inhibition. Further, inhibitory control enhanced cross-frequency amplitude coupling between PFC beta-band (18-38 Hz) activity and FEF alpha-band activity, and the coupling appeared to be initiated by the PFC. Our results suggest a generalized mechanism for top-down inhibitory control: prefrontal beta-band activity initiates alpha-band activity for functional inhibition of the effector and/or sensory system.

Keywords: antisaccade; inhibitory control; neural oscillations; prefrontal cortex.


Figures

Figure 1.
Figure 1.
SNR of ROIs. SNR estimate is used to identify dipoles where oscillatory activities are robust. Note that medial ROIs showed considerably lower SNR. The following anatomical labels from FreeSurfer parcellation were used to constrain ROI definition. ACC, anterior and middle-anterior part of the cingulate gyrus and sulci; SEF, paracentral lobule and sulcus; FEF, superior and inferior part of the precentral sulcus; IPS, intraparietal sulcus; DLPFC, middle frontal sulcus; VLPFC, inferior frontal sulcus, opercular, and triangular part of the inferior frontal gyrus.
Figure 2.
Figure 2.
Averaged spectral power during the preparatory period for all ROIs. The black horizontal bar indicates the spectral cluster that showed significant task modulation in spectral power. Bottom right depicts the anatomical masks used to define the ROIs. Note that for each participant, ROIs were created in their respective native surface space, thus the exact dipole location used for ROI definition varied across individuals. Shaded areas indicate 1 SE.
Figure 3.
Figure 3.
Temporal and spectral dynamics of DLPFC neural activity. A, Evoked responses for the AS and PS tasks in the right DLPFC. B, Time-frequency plot of DLPFC neural activity. Squared area indicates the spectrum that showed significant task modulation. C, Time-frequency clusters that showed significant task modulation (AS>PS, randomization test p < 0.05, cluster corrected). Shaded areas represent 1 SE.
Figure 4.
Figure 4.
Temporal and spectral dynamics of FEF neural activity. A, Evoked responses for the AS and PS tasks in bilateral FEF. B, Time-frequency plot of FEF neural activity. Squared area indicates the spectrum that showed significant task modulation. C, Time-frequency clusters that that showed significant task modulation (AS>PS, randomization test p < 0.05, cluster corrected). Shaded areas represent 1 SE.
Figure 5.
Figure 5.
FEF alpha-band power indexes functional inhibition of saccade-related activity. A, Comparison of preparatory power between correctly performed AS trials and incorrectly performed AS trials. The black horizontal bar indicates the spectral cluster that showed significant performance modulation. B, FEF alpha-band power during the preparatory period predicts the probability of successfully inhibiting reflexive saccades. “o” represents AS task performance to contralateral cues, black solid line is the fitted curve based on the logistic regression, and “x” represents the AS task performance to ipsilateral cues, gray line is the fitted curve based on the logistic regression. C, FEF alpha-band power decreased from 204 to 24 ms before the onset of saccade (as indicate by the horizontal dark bar). Time 0 indicates the onset of saccades (vertical dash line). Shaded area represents 1 SE.
Figure 6.
Figure 6.
Functional coupling between DLPFC beta-band activity and FEF alpha-band activity. A, Cross frequency amplitude coupling matrices between the DLPFC and the FEF. Color bar indicates the strength of functional connectivity (correlation coefficient, r). B, Spectral cluster that showed significantly stronger beta-alpha amplitude coupling between the DLPFC and the FEF for the AS task, when compared with the PS task. Color bar indicates the test statistic (t). C, The timing of power amplitude time courses. Time courses were normalized by converting to z-scores to equate the mean amplitude and variance. D, Lagged correlations between DLPFC beta-band amplitude and EFF alpha-band amplitude. The x-axis indicates the time lag of DLPFC beta-band activity leading FEF alpha-band activity. Maximum correlation was found when DLPFC led FEF by 80 ms (the dashed vertical line). E, Granger causality values between DLPFC beta-band activity and FEF alpha-band activity. Error bar indicates 1 SE.

References

    1. Akaishi R, Morishima Y, Rajeswaren VP, Aoki S, Sakai K. Stimulation of the frontal eye field reveals persistent effective connectivity after controlled behavior. J Neurosci. 2010;30:4295–4305. doi: 10.1523/JNEUROSCI.6198-09.2010. - DOI - PMC - PubMed
    1. Alexander GE, DeLong MR, Strick PL. Parallel organization of functionally segregated circuits linking basal ganglia and cortex. Annu Rev Neurosci. 1986;9:357–381. doi: 10.1146/annurev.ne.09.030186.002041. - DOI - PubMed
    1. Anderson JC, Kennedy H, Martin KA. Pathways of attention: synaptic relationships of frontal eye field to V4, lateral intraparietal cortex, and area 46 in macaque monkey. J Neurosci. 2011;31:10872–10881. doi: 10.1523/JNEUROSCI.0622-11.2011. - DOI - PMC - PubMed
    1. Aron AR. From reactive to proactive and selective control: developing a richer model for stopping inappropriate responses. Biol Psychiatry. 2011;69:e55–68. doi: 10.1016/j.biopsych.2010.07.024. - DOI - PMC - PubMed
    1. Aron AR, Poldrack RA. Cortical and subcortical contributions to stop signal response inhibition: role of the subthalamic nucleus. J Neurosci. 2006;26:2424–2433. doi: 10.1523/JNEUROSCI.4682-05.2006. - DOI - PMC - PubMed

Publication types

LinkOut - more resources