. 2014 Jun 16:7:10.
doi: 10.1186/1756-8935-7-10. eCollection 2014.

Targeted Chromatin Capture (T2C): a novel high resolution high throughput method to detect genomic interactions and regulatory elements

Affiliations

Targeted Chromatin Capture (T2C): a novel high resolution high throughput method to detect genomic interactions and regulatory elements

Petros Kolovos et al. Epigenetics Chromatin. .

Abstract

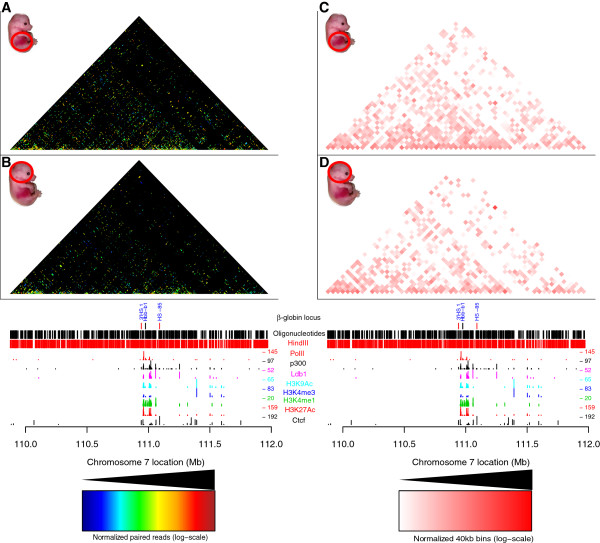
Background: Significant efforts have recently been put into the investigation of the spatial organization and the chromatin-interaction networks of genomes. Chromosome conformation capture (3C) technology and its derivatives are important tools used in this effort. However, many of these have limitations, such as being limited to one viewpoint, expensive with moderate to low resolution, and/or requiring a large sequencing effort. Techniques like Hi-C provide a genome-wide analysis. However, it requires massive sequencing effort with considerable costs. Here we describe a new technique termed Targeted Chromatin Capture (T2C), to interrogate large selected regions of the genome. T2C provides an unbiased view of the spatial organization of selected loci at superior resolution (single restriction fragment resolution, from 2 to 6 kbp) at much lower costs than Hi-C due to the lower sequencing effort.

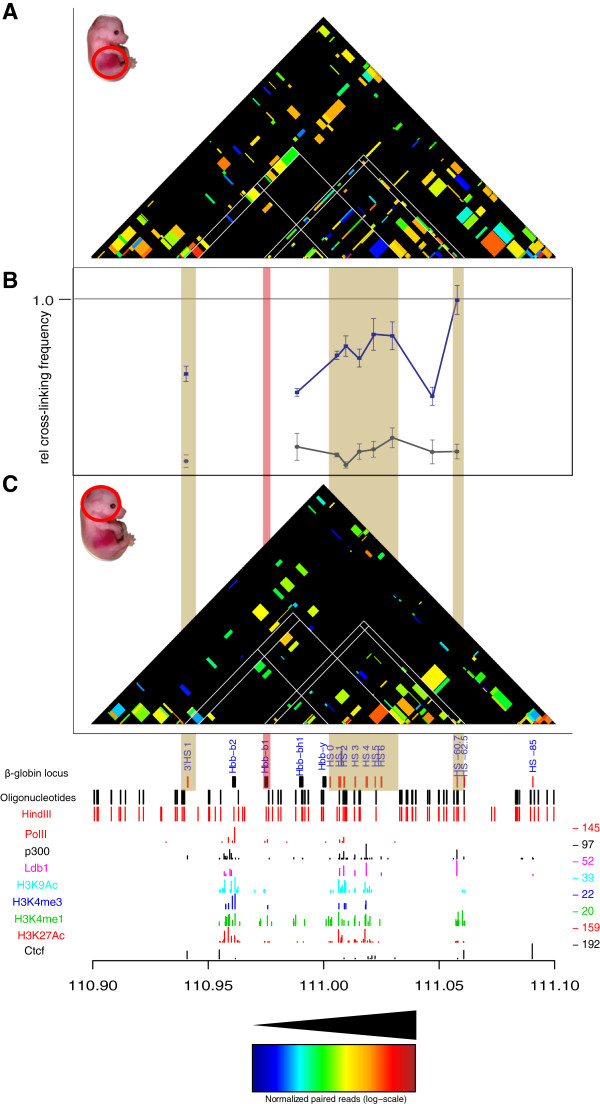
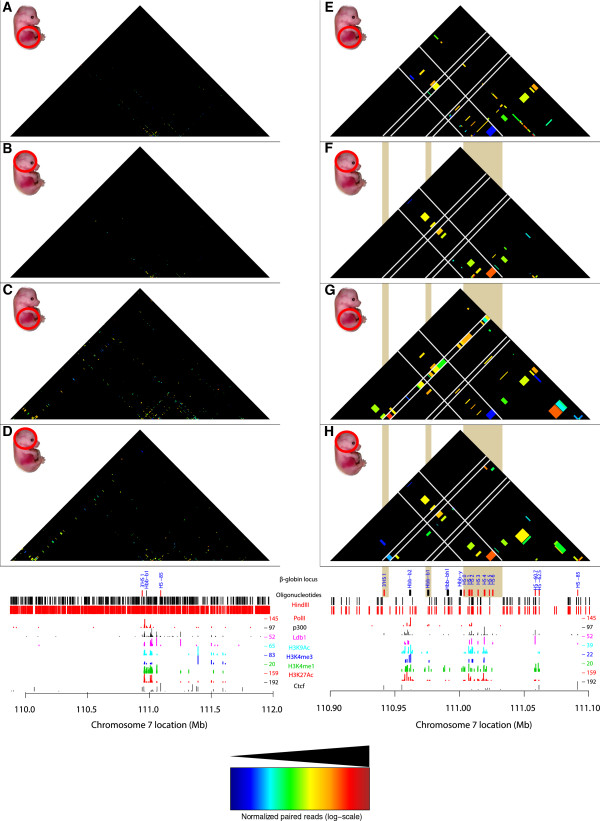
Results: We applied T2C on well-known model regions, the mouse β-globin locus and the human H19/IGF2 locus. In both cases we identified all known chromatin interactions. Furthermore, we compared the human H19/IGF2 locus data obtained from different chromatin conformation capturing methods with T2C data. We observed the same compartmentalization of the locus, but at a much higher resolution (single restriction fragments vs. the common 40 kbp bins) and higher coverage. Moreover, we compared the β-globin locus in two different biological samples (mouse primary erythroid cells and mouse fetal brain), where it is either actively transcribed or not, to identify possible transcriptional dependent interactions. We identified the known interactions in the β-globin locus and the same topological domains in both mouse primary erythroid cells and in mouse fetal brain with the latter having fewer interactions probably due to the inactivity of the locus. Furthermore, we show that interactions due to the important chromatin proteins, Ldb1 and Ctcf, in both tissues can be analyzed easily to reveal their role on transcriptional interactions and genome folding.

Conclusions: T2C is an efficient, easy, and affordable with high (restriction fragment) resolution tool to address both genome compartmentalization and chromatin-interaction networks for specific genomic regions at high resolution for both clinical and non-clinical research.

Keywords: Chromatin conformation capture; Enhancers; Long range interactions; Promoters.


Figures

Figure 1
Figure 1
Overview of the targeted chromosome capture (T2C) procedure. Isolated cross-linked chromatin is digested with a restriction enzyme (dark blue lines) and ligated under diluted conditions to favor ligations between restriction fragments that are spatially in proximity. After de-cross-linking and a secondary digestion (orange lines), the overhangs are repaired followed by adapter ligation. Different address sequences can be used in the adapters for different samples to allow multiplexing of different samples (hybridization of different samples to the same set of oligonucleotides). The resulting library is hybridized to a set of unique oligonucleotides on an array or oligonucleotides in solution that are captured on beads. The unique oligonucleotides (green, red, black, and blue lines) are located as close as possible to the first restriction site. The hybridized DNA, which contains the library of all interactions from the selected area of the genome, is eluted and is pair-end sequenced on an Illumina HiSeq2000 followed by bioinformatic analysis and visualization of the chromatin interactions (that is, sequences in close proximity). Each point in the chromatin interaction map, represents an interaction (in restriction fragment resolution, each block represents the size of the restriction fragment) between two fragments in the genome.
Figure 2
Figure 2
Comparison of interactions detected by T2C for the human chr11p15.5 region with Hi-C and 4C-seq. (A) Hi-C data generated by Dixon et al. for IMR90 cells covering the H19/IGF2 region of interest, presented at a resolution 40 kbp with their respective domain boundaries (DB) depicted as black boxes [1]. (B) T2C interactions in HB2 cells at a 40 kbp resolution. The overall topological domain pattern observed by the two methods is similar (rs = 0.64, P <2.2 × 10-16). (C) T2C interaction with their actual resolution at restriction fragment level. (D) Interactions detected by 3C [33]. The restriction fragments are indicated with yellow triangles. (E) 4C-seq interaction data [14], for a viewpoint close to the IGF2 gene. (F) Interactions observed for a particular viewpoint by T2C plotted with logarithmic y-axis. The position of the viewpoint is indicated as bold pink line to allow a direct comparison between the methods. The thin pink lines indicate a couple of interaction fragments for ease of comparison.
Figure 3
Figure 3
Comparison of the compartmentalization and interactions for the β-globin locus. T2C performed in a 2.1 Mb region around the β-globin locus for mouse primary erythroid cells (A) and mouse fetal brain cells (B) from E12.5 mice. The topological domain patterns between different biological materials are identical and are independent of the number of interactions. Analysis of the interactions obtained with T2C obtained from mouse primary erythroid cells (C) and mouse fetal brain cells (D) were plotted at 40 kbp resolution to compare T2C to the regular Hi-C binning. The overall topological domain pattern is similar in the two tissues. All the T2C interactions are normalized to the same color code (see color inset). The bottom tracks show a linear representation of the β-globin locus, the oligonucleotides probes positions (black lines), HindIII recognition sites (red lines) and the ChIP-seq derived binding sites of PolII (red lines), Ldb1 (purple lines) [38], Ctcf (black lines), p300 (black lines), and various histone modification markers (light blue, dark blue, green, and red) [37] in mouse erythroleukemia cells.
Figure 4
Figure 4
Comparison of T2C with 3C-qPCR for the β-globin promoter. T2C for mouse primary erythroid cells (A) and mouse fetal brain cells (C) from E12.5 mice, revealed the same interactions from the β-globin promoter when comparing them to 3C-qPCR (B). The 3C-qPCR was adapted and modified from Drissen et al.[16] with blue line depicting the interactions for primary erythroid cells and with grey the interactions for mouse fetal brain cells from E12.5 mice. White lines indicate the areas of particular interest (such as 3’HS1, β-globin promoter, Locus Control Region (LCR) and 5′ HS-60/-62) in the β-globin locus. Interactions between LCR, the β-globin promoter and the 3′HS1 are lost in mouse brain cells. The shaded vertical bars indicate the comparison between the different panels. The red vertical bar indicates the β-globin promoter. All the T2C interactions are normalized to the same color code (see color inset). The bottom tracks show a linear representation of the β-globin locus, the oligonucleotides probes positions (black lines), HindIII recognition sites (red lines) and the ChIP-seq derived binding sites of PolII (red lines), Ldb1 (purple lines) [38], Ctcf (black lines), p300 (black lines), and various histone modification markers (light blue, dark blue, green, and red) [37] in mouse erythroleukemia cells.
Figure 5
Figure 5
T2C/ChIP-seq intersection plot. A comparison of the interactions containing one or two fragments with a Ldb1 or Ctcf binding site. Interactions are plotted, at restriction fragment resolution, over a 2.1 Mb region around the β-globin locus for Ldb1 (A, B) or Ctcf (C, D) for mouse primary erythroid cells (A, C) and mouse fetal brain cells (B, D) from E12.5 mice. The topological sub-domain around the β-globin locus is clearly depicted in the mouse primary erythroid cells when compared to mouse brain cells. Focusing on the β-globin locus, T2C-intersection plots, at restriction fragment resolution, of interactions that contain a Ldb1 bound fragment (E, F) or a Ctcf bound fragment (G, H), for mouse primary erythroid cells (E, G) and mouse brain cells (F, H). White lines indicate particular areas of interest (like 3′HS1, the β-globin promoter and the Locus Control Region (LCR)) in the β-globin locus. The mouse primary erythroid cells interactions between LCR, β-globin promoter, and 3′HS1 are lost in mouse brain cells. The shaded vertical bars indicate the comparison between the different panels. All the interactions are normalized to the same color code (see color inset). The bottom tracks show a linear representation of the β-globin locus, the oligonucleotides probes positions (black lines), HindIII recognition sites (red lines) and the ChIP-seq derived binding sites of PolII (red lines), Ldb1 (purple lines) [38], Ctcf (black lines), p300 (black lines), and various histone modification markers (light blue, dark blue, green, and red) [37] in mouse erythroleukemia cells.
Figure 6
Figure 6
The mean, median, and the number of T2C interactions for the Ldb1 or Ctcf containing fragments. The number of Ldb1 (A) and Ctcf (B) interactions is lower in mouse fetal brain when compared to primary erythroid cells. Furthermore, the mean and the median of the distance between either Ldb1 (C) or Ctcf (D) interaction partners is lower in mouse fetal brain cells when compared to mouse primary erythroid cells. P values were calculated using the Mann–Whitney U test.
Figure 7
Figure 7
Comparison of capture efficiencies. The efficiency with which each fragment of the selected area is captured was derived from counting all of the reads for any particular fragment, that is, all its interactions, its self-ligation, and non-cleaved material and plotting these against the presence of two, one, or no oligonucleotides (probes) in the fragment (A). This shows that the presence of one or two oligonucleotides does not make a difference in the capture as would be expected under conditions where the oligonucleotides are in saturation. When no oligonucleotides are present for a particular fragment, the number of reads will be lower, because the reads due to self-ligation cannot be captured. When the reads are corrected for the self-ligation and non-cleaved fragments this difference largely disappears (B). P values were calculated using the Mann–Whitney U test.

References

    1. Dixon JR, Selvaraj S, Yue F, Kim A, Li Y, Shen Y, Hu M, Liu JS, Ren B. Topological domains in mammalian genomes identified by analysis of chromatin interactions. Nature. 2012;485:376–380. doi: 10.1038/nature11082. - DOI - PMC - PubMed
    1. Cremer T, Cremer C. Chromosome territories, nuclear architecture and gene regulation in mammalian cells. Nat Rev Genet. 2001;2:292–301. doi: 10.1038/35066075. - DOI - PubMed
    1. Dillon N, Trimborn T, Strouboulis J, Fraser P, Grosveld F. The effect of distance on long-range chromatin interactions. Mol Cell. 1997;1:131–139. doi: 10.1016/S1097-2765(00)80014-3. - DOI - PubMed
    1. Mueller-Storm HP, Sogo JM, Schaffner W. An enhancer stimulates transcription in trans when attached to the promoter via a protein bridge. Cell. 1989;58:767–777. doi: 10.1016/0092-8674(89)90110-4. - DOI - PubMed
    1. Jhunjhunwala S, van Zelm MC, Peak MM, Cutchin S, Riblet R, van Dongen JJ, Grosveld FG, Knoch TA, Murre C. The 3D structure of the immunoglobulin heavy-chain locus: implications for long-range genomic interactions. Cell. 2008;133:265–279. doi: 10.1016/j.cell.2008.03.024. - DOI - PMC - PubMed