Clinical Trial
. 2014 Jul 17;10(7):e1004251.
doi: 10.1371/journal.ppat.1004251. eCollection 2014 Jul.

T-bet and Eomes are differentially linked to the exhausted phenotype of CD8+ T cells in HIV infection

Affiliations
Clinical Trial

T-bet and Eomes are differentially linked to the exhausted phenotype of CD8+ T cells in HIV infection

Marcus Buggert et al. PLoS Pathog. .

Abstract

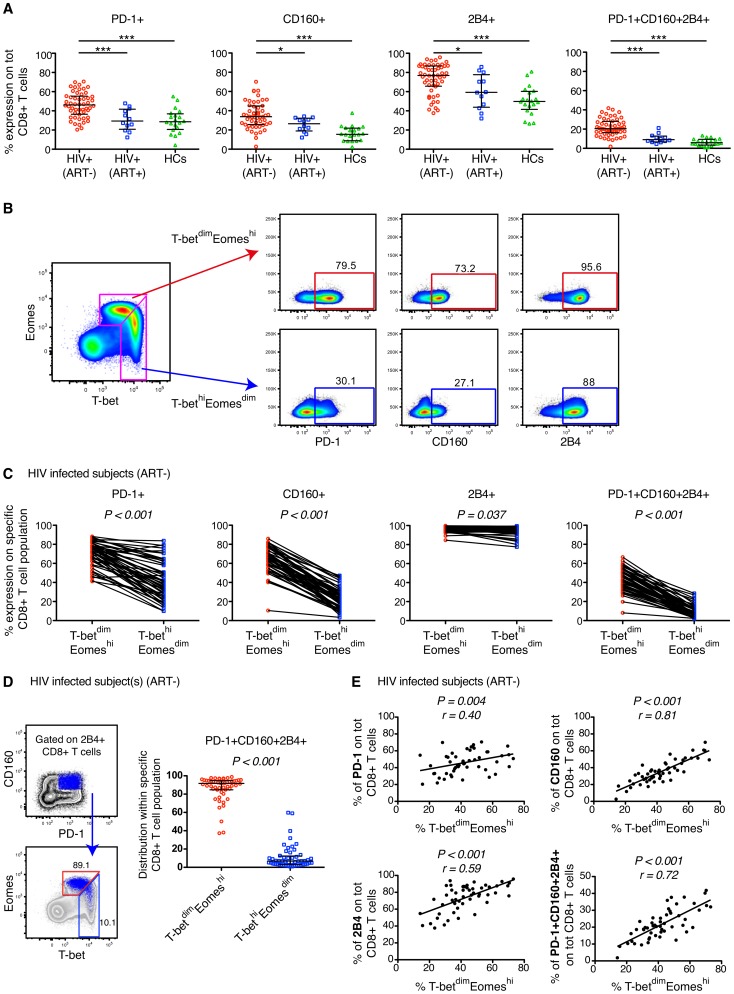
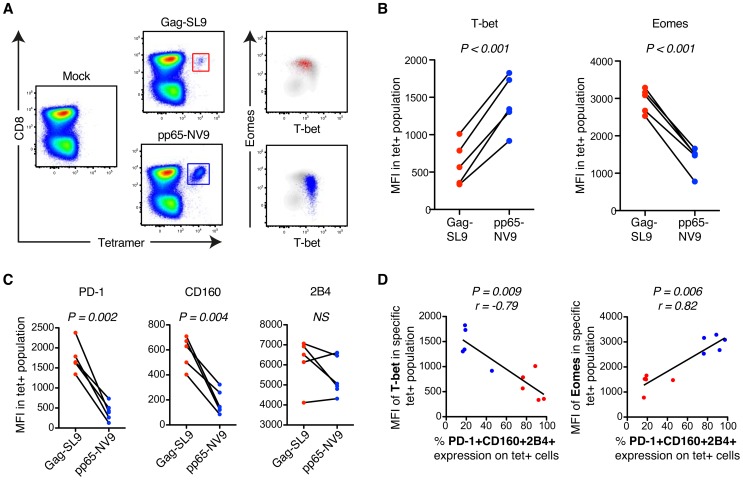
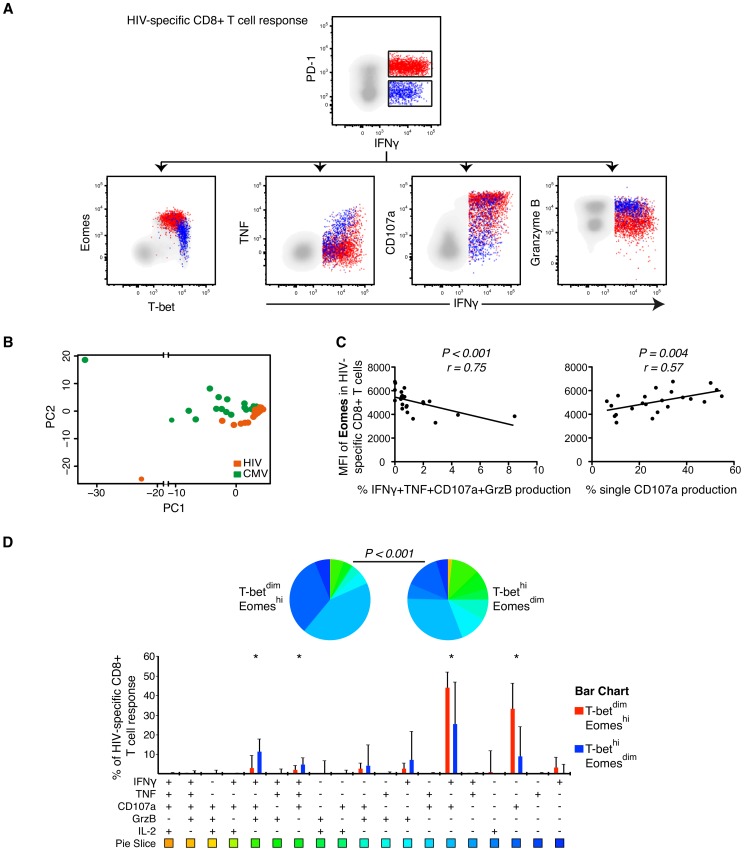
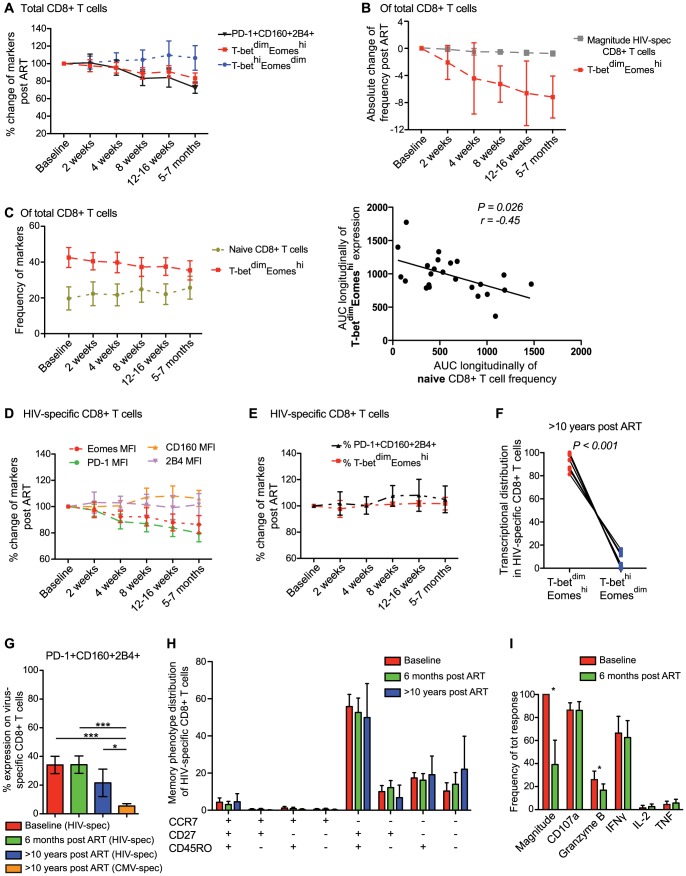
CD8(+) T cell exhaustion represents a major hallmark of chronic HIV infection. Two key transcription factors governing CD8(+) T cell differentiation, T-bet and Eomesodermin (Eomes), have previously been shown in mice to differentially regulate T cell exhaustion in part through direct modulation of PD-1. Here, we examined the relationship between these transcription factors and the expression of several inhibitory receptors (PD-1, CD160, and 2B4), functional characteristics and memory differentiation of CD8(+) T cells in chronic and treated HIV infection. The expression of PD-1, CD160, and 2B4 on total CD8(+) T cells was elevated in chronically infected individuals and highly associated with a T-bet(dim)Eomes(hi) expressional profile. Interestingly, both resting and activated HIV-specific CD8(+) T cells in chronic infection were almost exclusively T-bet(dim)Eomes(hi) cells, while CMV-specific CD8(+) T cells displayed a balanced expression pattern of T-bet and Eomes. The T-bet(dim)Eomes(hi) virus-specific CD8(+) T cells did not show features of terminal differentiation, but rather a transitional memory phenotype with poor polyfunctional (effector) characteristics. The transitional and exhausted phenotype of HIV-specific CD8(+) T cells was longitudinally related to persistent Eomes expression after antiretroviral therapy (ART) initiation. Strikingly, these characteristics remained stable up to 10 years after ART initiation. This study supports the concept that poor human viral-specific CD8(+) T cell functionality is due to an inverse expression balance between T-bet and Eomes, which is not reversed despite long-term viral control through ART. These results aid to explain the inability of HIV-specific CD8(+) T cells to control the viral replication post-ART cessation.


Conflict of interest statement

The authors have declared that no competing interests exist.

Figures

Figure 1
Figure 1. Expression patterns of inhibitory receptors and T-bet/Eomes on total CD8+ T cells.
(A) The percentage expression of PD-1, CD160, 2B4 and co-expression of PD-1+CD160+2B4+ on total CD8+ T cells in chronic untreated HIV infected subjects, HIV+ (ART−) (n = 52); individuals on long-term ART, HIV+ (ART+) (n = 12); and healthy controls, HCs (n = 20). Statistical analysis was performed with one-way ANOVA, non-parametric Kruskal Wallis test with Dunn's multiple comparison test to compare all pairs of columns; *P<0.05, **P<0.01 and ***P<0.001. Median and IQR are depicted in the scatter plots. (B) Gating strategy to distinguish the T-betdimEomeshi (red arrow) and T-bethiEomesdim (blue arrow) memory population and subsequent expression patterns of PD-1, CD160 and 2B4 in a HIV infected subject. (C) The frequency of PD-1, CD160, 2B4 and PD-1+CD160+2B4+ on total T-betdimEomeshi (red) and T-bethiEomesdim (blue) CD8+ T cells for all untreated HIV infected subjects (n = 52). Statistical analysis was performed with Wilcoxon matched-pairs single rank test. (D) Gating strategy to distinguish the localization within the T-bet/Eomes axis of total PD-1+CD160+2B4+ CD8+ T cells for a HIV infected subject. The scatter plot shows the distribution of PD-1+CD160+2B4+ expression between T-betdimEomeshi (red) and T-bethiEomesdim (blue) CD8+ T cells. Wilcoxon matched-pairs single rank test was conducted to obtain P value. (E) Correlation analysis between the frequencies of T-betdimEomeshi cells and PD-1, CD160, 2B4 and PD-1+CD160+2B4+ CD8+ T cells in all untreated HIV infected subjects. Spearman non-parametric test was used to test for correlations.
Figure 2
Figure 2. HIV- and CMV-specific CD8+ T cell expression of inhibitory receptors and T-bet/Eomes in untreated HIV infection.
(A) Gating strategy illustrating the localization within the T-bet/Eomes axis of HIV- (red) and CMV-specific CD8+ T cells (blue). (B) Distribution within the T-betdimEomeshi and T-bethiEomesdim population of HIV- and CMV-specific CD8+ T cell responses. All data is derived from the untreated HIV infected subjects (n = 52). Median and IQR are shown in all graphs and non-parametric Kruskal Wallis test followed by Dunn's multiple comparison test was performed to compare all pairs of columns; *P<0.05, **P<0.01 and ***P<0.001. (C) The frequency of PD-1, CD160, 2B4 and PD-1+CD160+2B4+ on HIV- and CMV-specific CD8+ T cells. Mann-Whitney tests were performed to conclude significance between the groups (median and IQR). (D) Localization of PD-1+CD160+2B4+ expressing HIV-specific CD8+ T cells (red) within the T-bet/Eomes axis and distribution between the T-betdimEomeshi and T-bethiEomesdim population. Wilcoxon matched-pairs single rank test was performed to show on significant differences between the groups. (E) SPICE analysis of inhibitory receptors combinations between the T-betdimEomeshi (red) and T-bethiEomesdim (blue) population for HIV-specific CD8+ T cells. Median and IQR are shown for all bars and Wilcoxon matched-pairs single rank tests were performed to compare outcomes between groups; *P<0.05. Permutation test was performed between the pie charts.
Figure 3
Figure 3. MHC class-I tetramer stainings of HIV- and CMV-specific CD8+ T cells in chronic HIV infection.
(A) Gating strategy of HIV-Gag/SL9-tet+ (red) and CMV-pp65/NV9-tet+ (blue) CD8+ T cells and their distribution within the T-bet/Eomes axis. (B) The MFI of T-bet and Eomes for Gag/SL9-tet+ and pp65/NV9-tet+ cells. Paired t-tests were used to compare differences between the groups. (C) The MFI of PD-1, CD160 and 2B4 between Gag/SL9-tet+ and pp65/NV9-tet+ cells. Paired t-tests were used to compare differences between the groups. (D) Correlation analysis between the frequency of virus-specific PD-1+CD160+2B4+ cells and MFI of T-bet or Eomes. Spearman non-parametric test was used to test for correlations.
Figure 4
Figure 4. Polyfunctional characterization of virus-specific CD8+ T cells in untreated HIV-infected individuals.
(A) Distribution of PD-1+ (red) and PD-1− (blue) HIV-specific CD8+ T cells within the T-bet/Eomes axis and linkage to IFNγ and TNF, CD107a and Granzyme B expression. (B) Boolean combinations of all functional and inhibitory markers (n = 256) were combined using PCA, generating a HIV- (orange) and CMV-specific (green) PC1 and PC2 score for each HIV infected subject (n = 23). (C) Correlations between the MFI of Eomes and IFNγ, TNF, CD107a and Granzyme B or single CD107a secretion. (D) SPICE analysis of all functional combinations between the T-betdimEomeshi (red) and T-bethiEomesdim (blue) population for HIV-specific CD8+ T cells. Median and IQR are shown for all bars and Wilcoxon matched-pairs single rank tests were performed to compare outcomes between groups; *P<0.05. Functional combinations where the IQR did not exceed 1% are not depicted in the graph. Permutation test was performed between the pie charts.
Figure 5
Figure 5. Phenotypic characterization of T-bet and Eomes expression in untreated HIV-infection.
(A) Representative plots of an untreated HIV infected patient showing the distribution of total PD-1+CD160+2B4+ CD8+ T cells (orange) within different memory phenotype compartments, based on CD45RO, CD27 and CCR7 expression. The distribution of total PD-1+CD160+2B4+ CD8+ T cells was determined in all chronic untreated HIV infected subjects (B) FACS plots from an HIV infected subject showing the distribution of total T-betdimEomeshi (green) cells within the different memory phenotype compartments. Also, the phenotypic distribution of total T-betdimEomeshi CD8+ T cells within different memory compartments for all untreated HIV infected subjects. Median and IQR are shown for all populations. (C) The % of TM and EM compartmentalization for Gag/SL9-tet+ and pp65/NV9-tet+ cells. Paired t-tests were used to compare differences between the groups. (D) Correlations between the MFI of Eomes and TM or EM compartmentalization of Gag/SL9-tet+ and pp65/NV9-tet+ cells. Spearman non-parametric test was used to test for correlations.
Figure 6
Figure 6. Longitudinal characterization of CD8+ T cell exhaustion and T-bet/Eomes expression following ART initiation.
(A) Longitudinal analysis from baseline (same day as ART initiation) and 6 months post ART for total PD-1+CD160+2B4+ (black), T-betdimEomeshi (red) and T-bethiEomesdim (blue) expression on CD8+ T cells (n = 24). (B) The decay of HIV-specific CD8+ T cell magnitude (grey) and frequency T-betdimEomeshi (red) post ART. (C) The frequency of naïve (asparagus) and T-betdimEomeshi (red) expressing CD8+ T cells longitudinally post ART and Spearman correlation analysis between the area-under-curve (AUC) longitudinally for naïve and T-betdimEomeshi expressing cells. Graphs illustrating the changes in frequency of (D) MFI of Eomes (red), PD-1 (green), CD160 (orange) and 2B4 (pink) expression, and (E) % of PD-1+CD160+2B4+ (black) and T-betdimEomeshi (red) expression from baseline and longitudinally after 6 months on ART. All time-points represents the mean and 95% CI. (F) Distribution of HIV-specific CD8+ T cells within the T-betdimEomeshi and T-bethiEomesdim population after >10 years on ART (n = 12). (G) Frequency of HIV-specific PD-1+CD160+2B4+ CD8+ T cells at baseline (red), 6 months (green), >10 years on ART (blue) and CMV-specific PD-1+CD160+2B4+ CD8+ T cells >10 years on ART (orange). (H) Memory phenotype distribution of HIV-specific CD8+ T cells at baseline (red), 6 months (green) and >10 years on ART (blue). (I) Frequency of each individual function (of total HIV-specific response) before (red) and 6 months after ART (green) (n = 12). For G–I, median and IQR are provided for the bars, where (G–H) Kruskal Wallis test followed by Dunn's multiple comparison test was performed to compare 3 or more columns (***P<0.001, *P<0.05) and (I) Wilcoxon single rank tests (*P<0.05) were used for paired comparisons.

References

    1. Intlekofer AM, Takemoto N, Kao C, Banerjee A, Schambach F, et al. (2007) Requirement for T-bet in the aberrant differentiation of unhelped memory CD8+ T cells. The Journal of experimental medicine 204: 2015–2021. - PMC - PubMed
    1. Intlekofer AM, Takemoto N, Wherry EJ, Longworth SA, Northrup JT, et al. (2005) Effector and memory CD8+ T cell fate coupled by T-bet and eomesodermin. Nature immunology 6: 1236–1244. - PubMed
    1. Pearce EL, Mullen AC, Martins GA, Krawczyk CM, Hutchins AS, et al. (2003) Control of effector CD8+ T cell function by the transcription factor Eomesodermin. Science 302: 1041–1043. - PubMed
    1. Banerjee A, Gordon SM, Intlekofer AM, Paley MA, Mooney EC, et al. (2010) Cutting edge: The transcription factor eomesodermin enables CD8+ T cells to compete for the memory cell niche. Journal of immunology 185: 4988–4992. - PMC - PubMed
    1. Joshi NS, Cui W, Chandele A, Lee HK, Urso DR, et al. (2007) Inflammation directs memory precursor and short-lived effector CD8(+) T cell fates via the graded expression of T-bet transcription factor. Immunity 27: 281–295. - PMC - PubMed

Publication types